Cities with the Highest Percentage of Population Employed in Educational Services in Kansas
RELATED REPORTS & OPTIONS
Educational Services
Kansas
Compare Cities
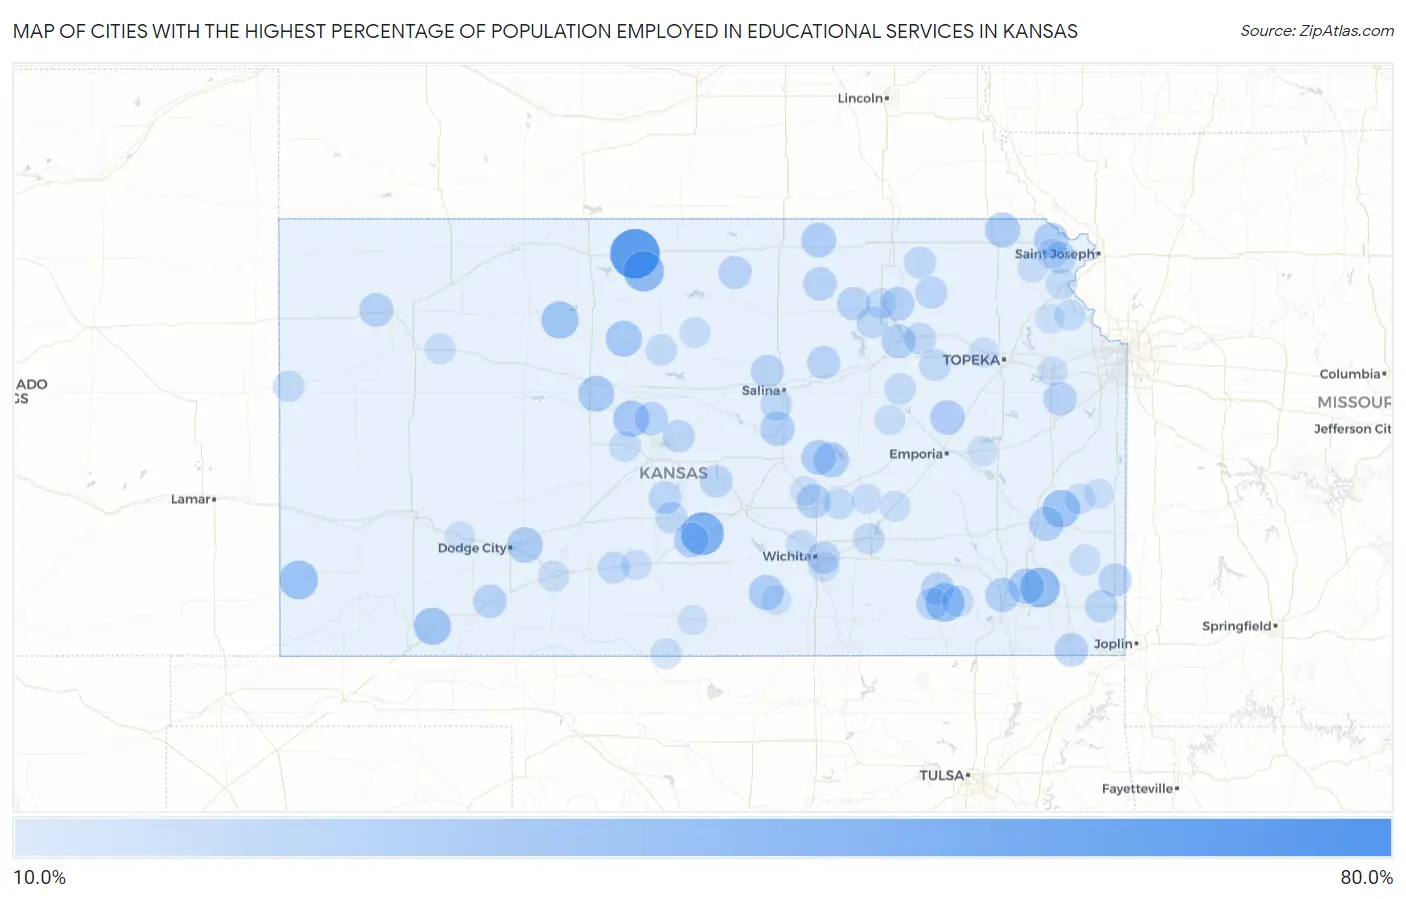
Map of Cities with the Highest Percentage of Population Employed in Educational Services in Kansas
0.0%
80.0%
Cities with the Highest Percentage of Population Employed in Educational Services in Kansas
| City | % Employed | vs State | vs National | |
| 1. | Radley | 66.7% | 10.5%(+56.1)#1 | 9.3%(+57.4)#80 |
| 2. | Athol | 60.0% | 10.5%(+49.5)#2 | 9.3%(+50.7)#115 |
| 3. | Big Bow | 54.5% | 10.5%(+44.0)#3 | 9.3%(+45.2)#165 |
| 4. | Woodruff | 50.0% | 10.5%(+39.5)#4 | 9.3%(+40.7)#218 |
| 5. | Langdon | 45.0% | 10.5%(+34.5)#5 | 9.3%(+35.7)#288 |
| 6. | Gaylord | 40.0% | 10.5%(+29.5)#6 | 9.3%(+30.7)#391 |
| 7. | South Mound | 39.3% | 10.5%(+28.8)#7 | 9.3%(+30.0)#410 |
| 8. | Croweburg | 38.4% | 10.5%(+27.8)#8 | 9.3%(+29.1)#438 |
| 9. | Galesburg | 38.1% | 10.5%(+27.6)#9 | 9.3%(+28.8)#443 |
| 10. | Elk Falls | 35.9% | 10.5%(+25.4)#10 | 9.3%(+26.6)#521 |
| 11. | Manter | 35.7% | 10.5%(+25.2)#11 | 9.3%(+26.4)#526 |
| 12. | Mildred | 33.3% | 10.5%(+22.8)#12 | 9.3%(+24.0)#653 |
| 13. | Damar | 32.9% | 10.5%(+22.4)#13 | 9.3%(+23.6)#666 |
| 14. | Kismet | 32.9% | 10.5%(+22.3)#14 | 9.3%(+23.5)#668 |
| 15. | Galatia | 30.8% | 10.5%(+20.2)#15 | 9.3%(+21.5)#779 |
| 16. | Wabaunsee | 30.4% | 10.5%(+19.9)#16 | 9.3%(+21.1)#801 |
| 17. | Natoma | 30.3% | 10.5%(+19.8)#17 | 9.3%(+21.0)#805 |
| 18. | Munjor | 30.2% | 10.5%(+19.7)#18 | 9.3%(+20.9)#814 |
| 19. | Wright | 29.4% | 10.5%(+18.9)#19 | 9.3%(+20.1)#860 |
| 20. | Thayer | 29.2% | 10.5%(+18.7)#20 | 9.3%(+19.9)#872 |
| 21. | Milton | 28.6% | 10.5%(+18.0)#21 | 9.3%(+19.3)#920 |
| 22. | Morrill | 28.4% | 10.5%(+17.9)#22 | 9.3%(+19.1)#936 |
| 23. | Hillsboro | 28.1% | 10.5%(+17.6)#23 | 9.3%(+18.8)#960 |
| 24. | Haddam | 27.8% | 10.5%(+17.3)#24 | 9.3%(+18.5)#994 |
| 25. | Turon | 27.7% | 10.5%(+17.2)#25 | 9.3%(+18.4)#999 |
| 26. | Lehigh | 27.6% | 10.5%(+17.0)#26 | 9.3%(+18.2)#1,008 |
| 27. | Allen | 27.3% | 10.5%(+16.8)#27 | 9.3%(+18.0)#1,026 |
| 28. | Highland | 27.2% | 10.5%(+16.7)#28 | 9.3%(+17.9)#1,041 |
| 29. | La Harpe | 26.9% | 10.5%(+16.4)#29 | 9.3%(+17.6)#1,066 |
| 30. | Neodesha | 26.7% | 10.5%(+16.2)#30 | 9.3%(+17.4)#1,080 |
| 31. | Lindsborg | 26.6% | 10.5%(+16.0)#31 | 9.3%(+17.3)#1,091 |
| 32. | North Newton | 26.2% | 10.5%(+15.6)#32 | 9.3%(+16.9)#1,129 |
| 33. | Manhattan | 25.8% | 10.5%(+15.3)#33 | 9.3%(+16.5)#1,163 |
| 34. | Levant | 25.8% | 10.5%(+15.3)#34 | 9.3%(+16.5)#1,166 |
| 35. | Olsburg | 25.5% | 10.5%(+14.9)#35 | 9.3%(+16.2)#1,202 |
| 36. | Fowler | 25.2% | 10.5%(+14.7)#36 | 9.3%(+15.9)#1,222 |
| 37. | Chetopa | 25.1% | 10.5%(+14.6)#37 | 9.3%(+15.8)#1,233 |
| 38. | Vining | 25.0% | 10.5%(+14.5)#38 | 9.3%(+15.7)#1,249 |
| 39. | Susank | 25.0% | 10.5%(+14.5)#39 | 9.3%(+15.7)#1,254 |
| 40. | Lafontaine | 25.0% | 10.5%(+14.5)#40 | 9.3%(+15.7)#1,255 |
| 41. | Baldwin City | 24.8% | 10.5%(+14.3)#41 | 9.3%(+15.5)#1,271 |
| 42. | Green | 24.6% | 10.5%(+14.0)#42 | 9.3%(+15.2)#1,298 |
| 43. | Franklin | 24.3% | 10.5%(+13.8)#43 | 9.3%(+15.0)#1,332 |
| 44. | Talmage | 24.1% | 10.5%(+13.6)#44 | 9.3%(+14.8)#1,353 |
| 45. | Randall | 23.8% | 10.5%(+13.3)#45 | 9.3%(+14.5)#1,392 |
| 46. | Culver | 23.8% | 10.5%(+13.3)#46 | 9.3%(+14.5)#1,395 |
| 47. | Burdick | 23.8% | 10.5%(+13.3)#47 | 9.3%(+14.5)#1,399 |
| 48. | Howard | 23.7% | 10.5%(+13.2)#48 | 9.3%(+14.4)#1,409 |
| 49. | Hudson | 23.6% | 10.5%(+13.1)#49 | 9.3%(+14.3)#1,431 |
| 50. | Cherokee | 23.2% | 10.5%(+12.7)#50 | 9.3%(+13.9)#1,491 |
| 51. | Sterling | 23.1% | 10.5%(+12.5)#51 | 9.3%(+13.8)#1,523 |
| 52. | Bendena | 22.8% | 10.5%(+12.3)#52 | 9.3%(+13.5)#1,551 |
| 53. | Eastborough | 22.7% | 10.5%(+12.2)#53 | 9.3%(+13.4)#1,576 |
| 54. | Moline | 22.6% | 10.5%(+12.1)#54 | 9.3%(+13.3)#1,589 |
| 55. | Claflin | 22.5% | 10.5%(+12.0)#55 | 9.3%(+13.2)#1,616 |
| 56. | Wheaton | 22.4% | 10.5%(+11.9)#56 | 9.3%(+13.1)#1,623 |
| 57. | Haviland | 22.0% | 10.5%(+11.5)#57 | 9.3%(+12.7)#1,684 |
| 58. | Frankfort | 21.8% | 10.5%(+11.3)#58 | 9.3%(+12.5)#1,720 |
| 59. | St George | 21.8% | 10.5%(+11.3)#59 | 9.3%(+12.5)#1,724 |
| 60. | Riley | 21.8% | 10.5%(+11.2)#60 | 9.3%(+12.5)#1,731 |
| 61. | Smolan | 21.5% | 10.5%(+11.0)#61 | 9.3%(+12.2)#1,769 |
| 62. | Stafford | 21.4% | 10.5%(+10.9)#62 | 9.3%(+12.1)#1,799 |
| 63. | Alma | 21.3% | 10.5%(+10.8)#63 | 9.3%(+12.0)#1,813 |
| 64. | Longton | 21.1% | 10.5%(+10.5)#64 | 9.3%(+11.7)#1,867 |
| 65. | Peck | 20.9% | 10.5%(+10.4)#65 | 9.3%(+11.6)#1,909 |
| 66. | Stuttgart | 20.8% | 10.5%(+10.3)#66 | 9.3%(+11.5)#1,928 |
| 67. | Dwight | 20.7% | 10.5%(+10.2)#67 | 9.3%(+11.4)#1,950 |
| 68. | Williamstown | 20.6% | 10.5%(+10.1)#68 | 9.3%(+11.3)#1,980 |
| 69. | Weskan | 20.5% | 10.5%(+9.99)#69 | 9.3%(+11.2)#2,001 |
| 70. | El Dorado | 20.5% | 10.5%(+9.98)#70 | 9.3%(+11.2)#2,004 |
| 71. | Luray | 20.5% | 10.5%(+9.96)#71 | 9.3%(+11.2)#2,006 |
| 72. | Albert | 20.4% | 10.5%(+9.88)#72 | 9.3%(+11.1)#2,028 |
| 73. | Elbing | 20.1% | 10.5%(+9.62)#73 | 9.3%(+10.8)#2,078 |
| 74. | Easton | 19.7% | 10.5%(+9.21)#74 | 9.3%(+10.4)#2,196 |
| 75. | Atchison | 19.7% | 10.5%(+9.14)#75 | 9.3%(+10.4)#2,215 |
| 76. | Hepler | 19.6% | 10.5%(+9.04)#76 | 9.3%(+10.2)#2,243 |
| 77. | Blue Mound | 19.5% | 10.5%(+8.99)#77 | 9.3%(+10.2)#2,256 |
| 78. | Hardtner | 19.4% | 10.5%(+8.92)#78 | 9.3%(+10.1)#2,268 |
| 79. | Grinnell | 19.4% | 10.5%(+8.90)#79 | 9.3%(+10.1)#2,274 |
| 80. | Bucklin | 19.3% | 10.5%(+8.81)#80 | 9.3%(+10.0)#2,299 |
| 81. | Maize | 19.3% | 10.5%(+8.80)#81 | 9.3%(+10.0)#2,302 |
| 82. | Randolph | 19.2% | 10.5%(+8.67)#82 | 9.3%(+9.88)#2,339 |
| 83. | Wilsey | 19.0% | 10.5%(+8.52)#83 | 9.3%(+9.73)#2,375 |
| 84. | Hunter | 19.0% | 10.5%(+8.52)#84 | 9.3%(+9.73)#2,377 |
| 85. | Furley | 19.0% | 10.5%(+8.52)#85 | 9.3%(+9.73)#2,381 |
| 86. | Mcconnell Afb | 19.0% | 10.5%(+8.43)#86 | 9.3%(+9.64)#2,400 |
| 87. | Cassoday | 18.9% | 10.5%(+8.36)#87 | 9.3%(+9.57)#2,419 |
| 88. | Cullison | 18.8% | 10.5%(+8.22)#88 | 9.3%(+9.43)#2,477 |
| 89. | Severance | 18.8% | 10.5%(+8.22)#89 | 9.3%(+9.43)#2,479 |
| 90. | Silver Lake | 18.3% | 10.5%(+7.73)#90 | 9.3%(+8.94)#2,663 |
| 91. | Everest | 18.1% | 10.5%(+7.59)#91 | 9.3%(+8.80)#2,712 |
| 92. | Burns | 18.0% | 10.5%(+7.51)#92 | 9.3%(+8.72)#2,739 |
| 93. | Ingalls | 18.0% | 10.5%(+7.46)#93 | 9.3%(+8.67)#2,755 |
| 94. | Hesston | 18.0% | 10.5%(+7.44)#94 | 9.3%(+8.65)#2,761 |
| 95. | Sharon | 17.9% | 10.5%(+7.38)#95 | 9.3%(+8.60)#2,787 |
| 96. | Lebo | 17.9% | 10.5%(+7.35)#96 | 9.3%(+8.56)#2,796 |
| 97. | Winchester | 17.8% | 10.5%(+7.26)#97 | 9.3%(+8.48)#2,822 |
| 98. | Conway Springs | 17.7% | 10.5%(+7.15)#98 | 9.3%(+8.36)#2,867 |
| 99. | Lawrence | 17.7% | 10.5%(+7.13)#99 | 9.3%(+8.34)#2,874 |
| 100. | Mound City | 17.6% | 10.5%(+7.07)#100 | 9.3%(+8.28)#2,912 |
Common Questions
What are the Top 10 Cities with the Highest Percentage of Population Employed in Educational Services in Kansas?
Top 10 Cities with the Highest Percentage of Population Employed in Educational Services in Kansas are:
What city has the Highest Percentage of Population Employed in Educational Services in Kansas?
Athol has the Highest Percentage of Population Employed in Educational Services in Kansas with 60.0%.
What is the Percentage of Population Employed in Educational Services in the State of Kansas?
Percentage of Population Employed in Educational Services in Kansas is 10.5%.
What is the Percentage of Population Employed in Educational Services in the United States?
Percentage of Population Employed in Educational Services in the United States is 9.3%.