Cities with the Highest Percentage of Population Employed in Educational Services in Ohio
RELATED REPORTS & OPTIONS
Educational Services
Ohio
Compare Cities
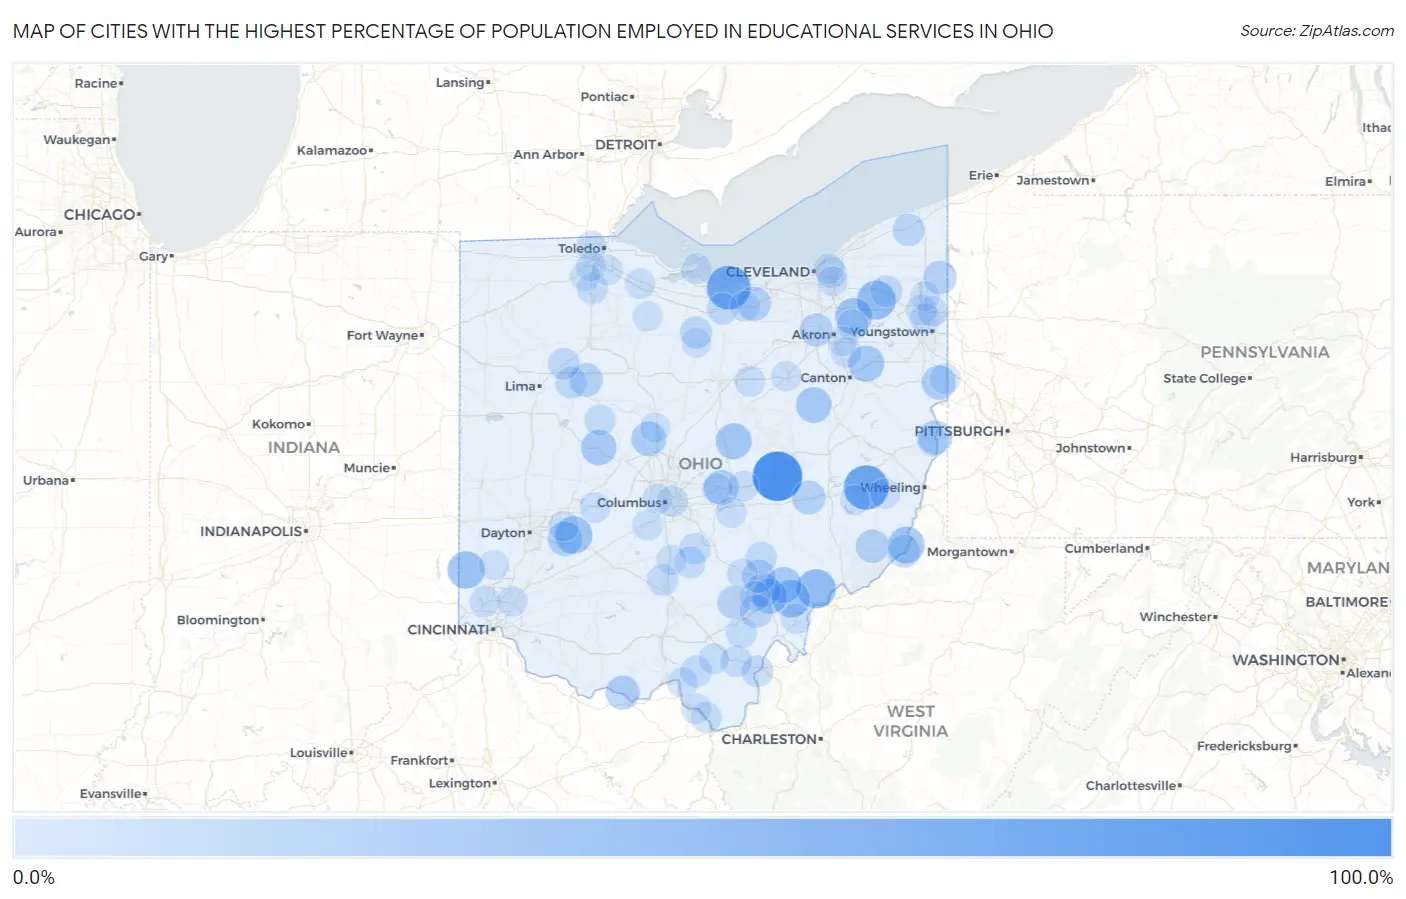
Map of Cities with the Highest Percentage of Population Employed in Educational Services in Ohio
0.0%
100.0%
Cities with the Highest Percentage of Population Employed in Educational Services in Ohio
| City | % Employed | vs State | vs National | |
| 1. | Trinway | 84.8% | 8.4%(+76.4)#1 | 9.3%(+75.5)#45 |
| 2. | Fairview | 66.7% | 8.4%(+58.2)#2 | 9.3%(+57.4)#82 |
| 3. | Beulah Beach | 63.2% | 8.4%(+54.7)#3 | 9.3%(+53.8)#95 |
| 4. | Vincent | 46.5% | 8.4%(+38.1)#4 | 9.3%(+37.2)#260 |
| 5. | Hiram | 45.4% | 8.4%(+36.9)#5 | 9.3%(+36.0)#280 |
| 6. | Stewart | 40.7% | 8.4%(+32.3)#6 | 9.3%(+31.4)#379 |
| 7. | Cedarville | 40.6% | 8.4%(+32.1)#7 | 9.3%(+31.3)#381 |
| 8. | Oxford | 40.4% | 8.4%(+32.0)#8 | 9.3%(+31.1)#384 |
| 9. | Sugar Bush Knolls | 38.4% | 8.4%(+29.9)#9 | 9.3%(+29.0)#439 |
| 10. | Hannibal | 37.7% | 8.4%(+29.3)#10 | 9.3%(+28.4)#458 |
| 11. | Gambier | 35.8% | 8.4%(+27.4)#11 | 9.3%(+26.5)#523 |
| 12. | Amesville | 35.3% | 8.4%(+26.8)#12 | 9.3%(+26.0)#551 |
| 13. | Harrisburg | 35.2% | 8.4%(+26.8)#13 | 9.3%(+25.9)#558 |
| 14. | Winesburg | 34.1% | 8.4%(+25.7)#14 | 9.3%(+24.8)#613 |
| 15. | East Liberty | 33.3% | 8.4%(+24.9)#15 | 9.3%(+24.0)#634 |
| 16. | Athens | 31.9% | 8.4%(+23.4)#16 | 9.3%(+22.6)#710 |
| 17. | Granville | 31.7% | 8.4%(+23.3)#17 | 9.3%(+22.4)#720 |
| 18. | Radnor | 30.8% | 8.4%(+22.3)#18 | 9.3%(+21.5)#777 |
| 19. | Wilberforce | 30.3% | 8.4%(+21.9)#19 | 9.3%(+21.0)#808 |
| 20. | Oberlin | 29.5% | 8.4%(+21.1)#20 | 9.3%(+20.2)#855 |
| 21. | The Plains | 28.9% | 8.4%(+20.5)#21 | 9.3%(+19.6)#890 |
| 22. | Lake Tomahawk | 28.8% | 8.4%(+20.3)#22 | 9.3%(+19.5)#901 |
| 23. | Pottery Addition | 28.6% | 8.4%(+20.1)#23 | 9.3%(+19.3)#923 |
| 24. | Rome Stout | 28.6% | 8.4%(+20.1)#24 | 9.3%(+19.3)#926 |
| 25. | New Concord | 27.8% | 8.4%(+19.4)#25 | 9.3%(+18.5)#987 |
| 26. | Kinsman Center | 26.8% | 8.4%(+18.3)#26 | 9.3%(+17.5)#1,075 |
| 27. | Dola | 26.1% | 8.4%(+17.6)#27 | 9.3%(+16.8)#1,140 |
| 28. | Graysville | 26.1% | 8.4%(+17.6)#28 | 9.3%(+16.8)#1,142 |
| 29. | Pigeon Creek | 25.8% | 8.4%(+17.4)#29 | 9.3%(+16.5)#1,161 |
| 30. | Buchtel | 25.6% | 8.4%(+17.2)#30 | 9.3%(+16.3)#1,183 |
| 31. | Albany | 24.5% | 8.4%(+16.1)#31 | 9.3%(+15.2)#1,301 |
| 32. | Zaleski | 24.4% | 8.4%(+16.0)#32 | 9.3%(+15.1)#1,316 |
| 33. | Sardis | 23.6% | 8.4%(+15.1)#33 | 9.3%(+14.3)#1,440 |
| 34. | Austinburg | 22.8% | 8.4%(+14.4)#34 | 9.3%(+13.5)#1,548 |
| 35. | Holiday Lakes | 21.7% | 8.4%(+13.2)#35 | 9.3%(+12.4)#1,745 |
| 36. | Parkman | 21.2% | 8.4%(+12.8)#36 | 9.3%(+11.9)#1,822 |
| 37. | Ada | 21.0% | 8.4%(+12.6)#37 | 9.3%(+11.7)#1,882 |
| 38. | Saybrook-On-The-Lake | 21.0% | 8.4%(+12.5)#38 | 9.3%(+11.6)#1,892 |
| 39. | Bluffton | 20.7% | 8.4%(+12.3)#39 | 9.3%(+11.4)#1,955 |
| 40. | Gallipolis | 20.6% | 8.4%(+12.1)#40 | 9.3%(+11.3)#1,983 |
| 41. | Collins | 20.4% | 8.4%(+12.0)#41 | 9.3%(+11.1)#2,023 |
| 42. | Jersey | 20.2% | 8.4%(+11.7)#42 | 9.3%(+10.9)#2,071 |
| 43. | Andersonville | 19.9% | 8.4%(+11.4)#43 | 9.3%(+10.6)#2,156 |
| 44. | South Webster | 19.6% | 8.4%(+11.2)#44 | 9.3%(+10.3)#2,222 |
| 45. | Rio Grande | 19.6% | 8.4%(+11.2)#45 | 9.3%(+10.3)#2,229 |
| 46. | Hemlock | 19.6% | 8.4%(+11.1)#46 | 9.3%(+10.2)#2,242 |
| 47. | Tarlton | 19.2% | 8.4%(+10.7)#47 | 9.3%(+9.85)#2,346 |
| 48. | Amanda | 19.1% | 8.4%(+10.6)#48 | 9.3%(+9.77)#2,366 |
| 49. | Miller | 18.8% | 8.4%(+10.3)#49 | 9.3%(+9.43)#2,466 |
| 50. | Coal Grove | 18.6% | 8.4%(+10.1)#50 | 9.3%(+9.25)#2,543 |
| 51. | Ridgeway | 18.5% | 8.4%(+10.1)#51 | 9.3%(+9.23)#2,551 |
| 52. | Wilkesville | 18.4% | 8.4%(+9.97)#52 | 9.3%(+9.11)#2,590 |
| 53. | Bowling Green | 18.4% | 8.4%(+9.95)#53 | 9.3%(+9.08)#2,604 |
| 54. | Bexley | 18.3% | 8.4%(+9.82)#54 | 9.3%(+8.95)#2,661 |
| 55. | New Haven Cdp Hamilton County | 18.1% | 8.4%(+9.64)#55 | 9.3%(+8.77)#2,723 |
| 56. | Kent | 18.0% | 8.4%(+9.60)#56 | 9.3%(+8.73)#2,737 |
| 57. | University Heights | 17.8% | 8.4%(+9.38)#57 | 9.3%(+8.51)#2,811 |
| 58. | Uniontown | 17.8% | 8.4%(+9.36)#58 | 9.3%(+8.49)#2,818 |
| 59. | Negley | 17.6% | 8.4%(+9.15)#59 | 9.3%(+8.28)#2,914 |
| 60. | Pleasant Run | 17.5% | 8.4%(+9.07)#60 | 9.3%(+8.20)#2,934 |
| 61. | Sharon Center | 17.3% | 8.4%(+8.82)#61 | 9.3%(+7.95)#3,053 |
| 62. | Hayesville | 17.3% | 8.4%(+8.81)#62 | 9.3%(+7.94)#3,056 |
| 63. | Marblehead | 17.2% | 8.4%(+8.78)#63 | 9.3%(+7.91)#3,069 |
| 64. | Marne | 17.1% | 8.4%(+8.68)#64 | 9.3%(+7.81)#3,109 |
| 65. | Howland Center | 17.0% | 8.4%(+8.52)#65 | 9.3%(+7.65)#3,186 |
| 66. | Thornville | 16.9% | 8.4%(+8.44)#66 | 9.3%(+7.57)#3,224 |
| 67. | Oak Hill | 16.9% | 8.4%(+8.44)#67 | 9.3%(+7.57)#3,225 |
| 68. | Steubenville | 16.9% | 8.4%(+8.41)#68 | 9.3%(+7.54)#3,239 |
| 69. | Haydenville | 16.8% | 8.4%(+8.38)#69 | 9.3%(+7.51)#3,257 |
| 70. | Orient | 16.7% | 8.4%(+8.22)#70 | 9.3%(+7.35)#3,344 |
| 71. | Yellow Springs | 16.6% | 8.4%(+8.18)#71 | 9.3%(+7.31)#3,389 |
| 72. | Highpoint | 16.5% | 8.4%(+8.04)#72 | 9.3%(+7.17)#3,463 |
| 73. | Mckinley Heights | 16.5% | 8.4%(+8.04)#73 | 9.3%(+7.17)#3,466 |
| 74. | New Marshfield | 16.5% | 8.4%(+8.02)#74 | 9.3%(+7.16)#3,471 |
| 75. | Vienna Center | 16.5% | 8.4%(+8.01)#75 | 9.3%(+7.14)#3,474 |
| 76. | Stony Ridge | 16.3% | 8.4%(+7.87)#76 | 9.3%(+7.00)#3,529 |
| 77. | Kipton | 16.3% | 8.4%(+7.83)#77 | 9.3%(+6.96)#3,551 |
| 78. | Wheelersburg | 16.2% | 8.4%(+7.78)#78 | 9.3%(+6.91)#3,584 |
| 79. | Reno Beach | 16.1% | 8.4%(+7.68)#79 | 9.3%(+6.81)#3,643 |
| 80. | Lindsey | 16.1% | 8.4%(+7.66)#80 | 9.3%(+6.80)#3,656 |
| 81. | Granville South | 16.1% | 8.4%(+7.66)#81 | 9.3%(+6.79)#3,658 |
| 82. | Ottawa Hills | 16.1% | 8.4%(+7.65)#82 | 9.3%(+6.78)#3,667 |
| 83. | Salesville | 16.0% | 8.4%(+7.60)#83 | 9.3%(+6.73)#3,691 |
| 84. | Hanging Rock | 16.0% | 8.4%(+7.55)#84 | 9.3%(+6.68)#3,717 |
| 85. | South Vienna | 15.9% | 8.4%(+7.45)#85 | 9.3%(+6.59)#3,765 |
| 86. | Logan Elm Village | 15.8% | 8.4%(+7.40)#86 | 9.3%(+6.53)#3,797 |
| 87. | Bethesda | 15.8% | 8.4%(+7.38)#87 | 9.3%(+6.51)#3,811 |
| 88. | Tuppers Plains | 15.8% | 8.4%(+7.32)#88 | 9.3%(+6.45)#3,848 |
| 89. | Wooster | 15.6% | 8.4%(+7.13)#89 | 9.3%(+6.26)#3,948 |
| 90. | Cleveland Heights | 15.6% | 8.4%(+7.13)#90 | 9.3%(+6.26)#3,952 |
| 91. | Perrysburg | 15.5% | 8.4%(+7.09)#91 | 9.3%(+6.22)#3,981 |
| 92. | Waldo | 15.5% | 8.4%(+7.02)#92 | 9.3%(+6.15)#4,017 |
| 93. | North Randall | 15.4% | 8.4%(+6.94)#93 | 9.3%(+6.07)#4,066 |
| 94. | Jacksonburg | 15.4% | 8.4%(+6.94)#94 | 9.3%(+6.07)#4,089 |
| 95. | Haskins | 15.4% | 8.4%(+6.91)#95 | 9.3%(+6.05)#4,096 |
| 96. | Celeryville | 15.2% | 8.4%(+6.77)#96 | 9.3%(+5.90)#4,178 |
| 97. | Marble Cliff | 15.2% | 8.4%(+6.73)#97 | 9.3%(+5.86)#4,192 |
| 98. | Sawyerwood | 15.1% | 8.4%(+6.62)#98 | 9.3%(+5.75)#4,255 |
| 99. | Cortland | 15.0% | 8.4%(+6.59)#99 | 9.3%(+5.72)#4,277 |
| 100. | Fort Seneca | 15.0% | 8.4%(+6.55)#100 | 9.3%(+5.68)#4,305 |
Common Questions
What are the Top 10 Cities with the Highest Percentage of Population Employed in Educational Services in Ohio?
Top 10 Cities with the Highest Percentage of Population Employed in Educational Services in Ohio are:
#1
84.8%
#2
66.7%
#3
63.2%
#4
46.5%
#5
45.4%
#6
40.7%
#7
40.6%
#8
40.4%
#9
38.4%
#10
37.7%
What city has the Highest Percentage of Population Employed in Educational Services in Ohio?
Trinway has the Highest Percentage of Population Employed in Educational Services in Ohio with 84.8%.
What is the Percentage of Population Employed in Educational Services in the State of Ohio?
Percentage of Population Employed in Educational Services in Ohio is 8.4%.
What is the Percentage of Population Employed in Educational Services in the United States?
Percentage of Population Employed in Educational Services in the United States is 9.3%.