Santa Cruz, CA Map & Demographics
Santa Cruz Map
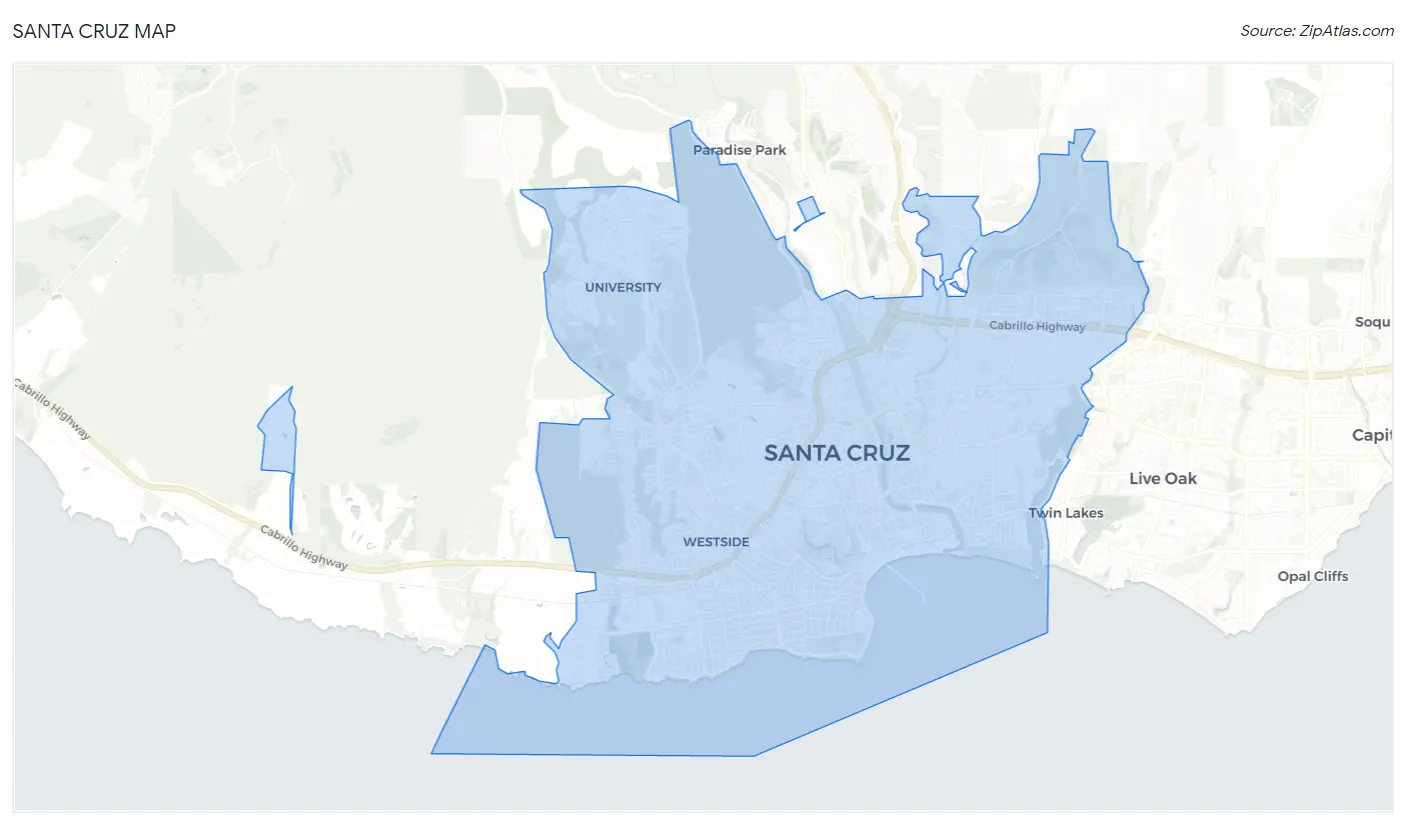
Santa Cruz Overview
$51,956
PER CAPITA INCOME
$165,792
AVG FAMILY INCOME
$105,491
AVG HOUSEHOLD INCOME
39.3%
WAGE / INCOME GAP [ % ]
60.7¢/ $1
WAGE / INCOME GAP [ $ ]
$8,737
FAMILY INCOME DEFICIT
0.51
INEQUALITY / GINI INDEX
61,367
TOTAL POPULATION
30,324
MALE POPULATION
31,043
FEMALE POPULATION
97.68
MALES / 100 FEMALES
102.37
FEMALES / 100 MALES
29.5
MEDIAN AGE
2.9
AVG FAMILY SIZE
2.4
AVG HOUSEHOLD SIZE
33,847
LABOR FORCE [ PEOPLE ]
61.6%
PERCENT IN LABOR FORCE
6.2%
UNEMPLOYMENT RATE
Santa Cruz Area Codes
Income in Santa Cruz
Income Overview in Santa Cruz
Per Capita Income in Santa Cruz is $51,956, while median incomes of families and households are $165,792 and $105,491 respectively.
| Characteristic | Number | Measure |
| Per Capita Income | 61,367 | $51,956 |
| Median Family Income | 10,337 | $165,792 |
| Mean Family Income | 10,337 | $201,337 |
| Median Household Income | 21,594 | $105,491 |
| Mean Household Income | 21,594 | $148,404 |
| Income Deficit | 10,337 | $8,737 |
| Wage / Income Gap (%) | 61,367 | 39.27% |
| Wage / Income Gap ($) | 61,367 | 60.73¢ per $1 |
| Gini / Inequality Index | 61,367 | 0.51 |
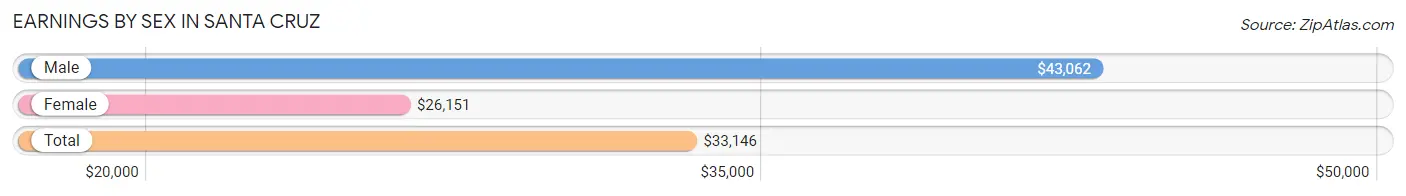
Earnings by Sex in Santa Cruz
Average Earnings in Santa Cruz are $33,146, $43,062 for men and $26,151 for women, a difference of 39.3%.
| Sex | Number | Average Earnings |
| Male | 19,410 (50.2%) | $43,062 |
| Female | 19,278 (49.8%) | $26,151 |
| Total | 38,688 (100.0%) | $33,146 |
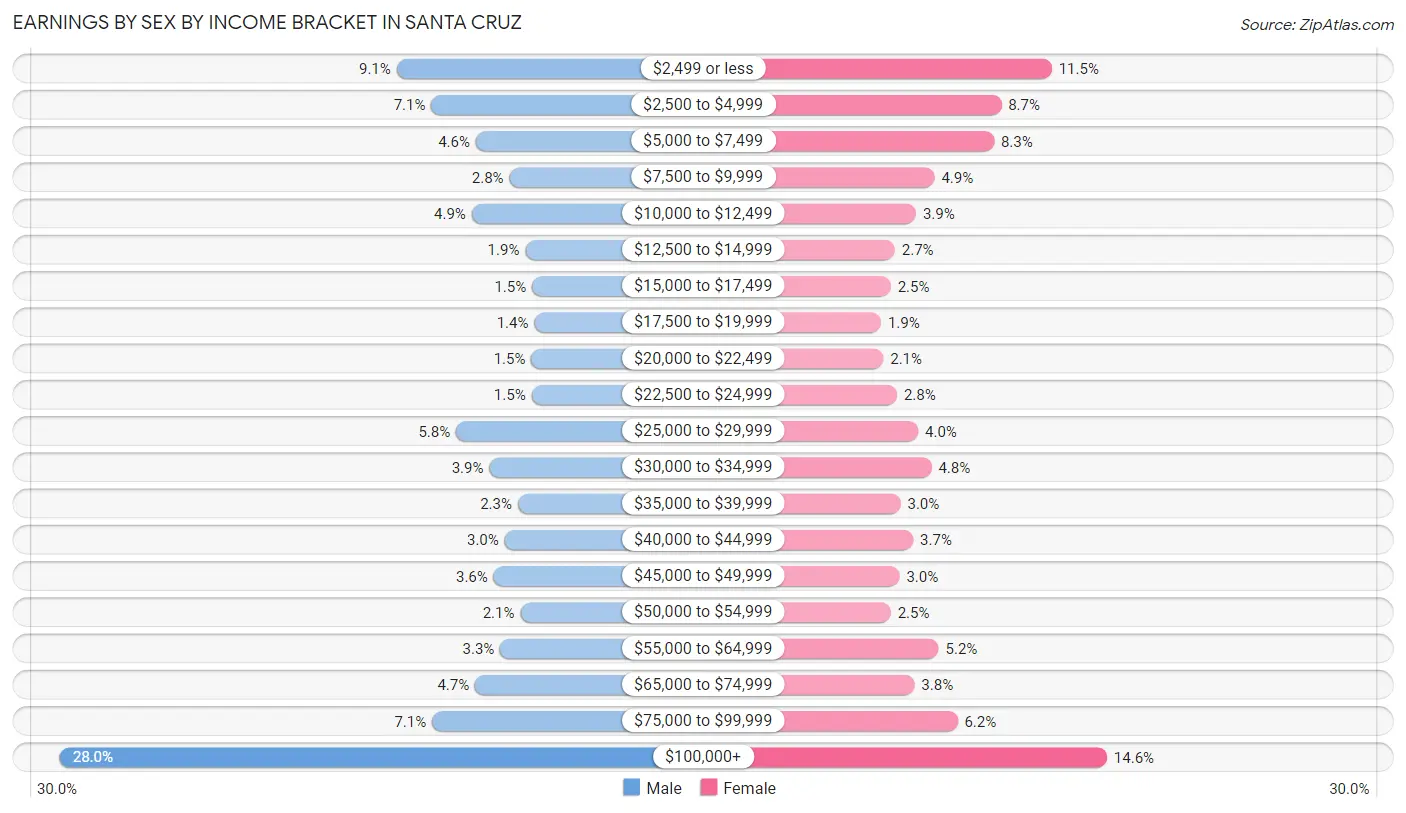
Earnings by Sex by Income Bracket in Santa Cruz
The most common earnings brackets in Santa Cruz are $100,000+ for men (5,438 | 28.0%) and $100,000+ for women (2,819 | 14.6%).
| Income | Male | Female |
| $2,499 or less | 1,764 (9.1%) | 2,221 (11.5%) |
| $2,500 to $4,999 | 1,386 (7.1%) | 1,674 (8.7%) |
| $5,000 to $7,499 | 901 (4.6%) | 1,594 (8.3%) |
| $7,500 to $9,999 | 533 (2.8%) | 951 (4.9%) |
| $10,000 to $12,499 | 946 (4.9%) | 750 (3.9%) |
| $12,500 to $14,999 | 361 (1.9%) | 520 (2.7%) |
| $15,000 to $17,499 | 288 (1.5%) | 476 (2.5%) |
| $17,500 to $19,999 | 262 (1.3%) | 370 (1.9%) |
| $20,000 to $22,499 | 296 (1.5%) | 395 (2.1%) |
| $22,500 to $24,999 | 294 (1.5%) | 543 (2.8%) |
| $25,000 to $29,999 | 1,116 (5.8%) | 773 (4.0%) |
| $30,000 to $34,999 | 753 (3.9%) | 917 (4.8%) |
| $35,000 to $39,999 | 442 (2.3%) | 582 (3.0%) |
| $40,000 to $44,999 | 587 (3.0%) | 720 (3.7%) |
| $45,000 to $49,999 | 706 (3.6%) | 571 (3.0%) |
| $50,000 to $54,999 | 416 (2.1%) | 476 (2.5%) |
| $55,000 to $64,999 | 635 (3.3%) | 994 (5.2%) |
| $65,000 to $74,999 | 908 (4.7%) | 732 (3.8%) |
| $75,000 to $99,999 | 1,378 (7.1%) | 1,200 (6.2%) |
| $100,000+ | 5,438 (28.0%) | 2,819 (14.6%) |
| Total | 19,410 (100.0%) | 19,278 (100.0%) |
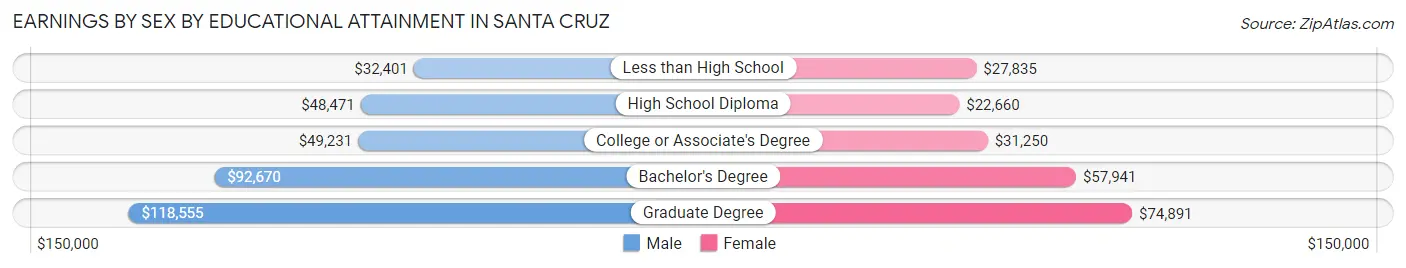
Earnings by Sex by Educational Attainment in Santa Cruz
Average earnings in Santa Cruz are $77,589 for men and $49,966 for women, a difference of 35.6%. Men with an educational attainment of graduate degree enjoy the highest average annual earnings of $118,555, while those with less than high school education earn the least with $32,401. Women with an educational attainment of graduate degree earn the most with the average annual earnings of $74,891, while those with high school diploma education have the smallest earnings of $22,660.
| Educational Attainment | Male Income | Female Income |
| Less than High School | $32,401 | $27,835 |
| High School Diploma | $48,471 | $22,660 |
| College or Associate's Degree | $49,231 | $31,250 |
| Bachelor's Degree | $92,670 | $57,941 |
| Graduate Degree | $118,555 | $74,891 |
| Total | $77,589 | $49,966 |
Family Income in Santa Cruz
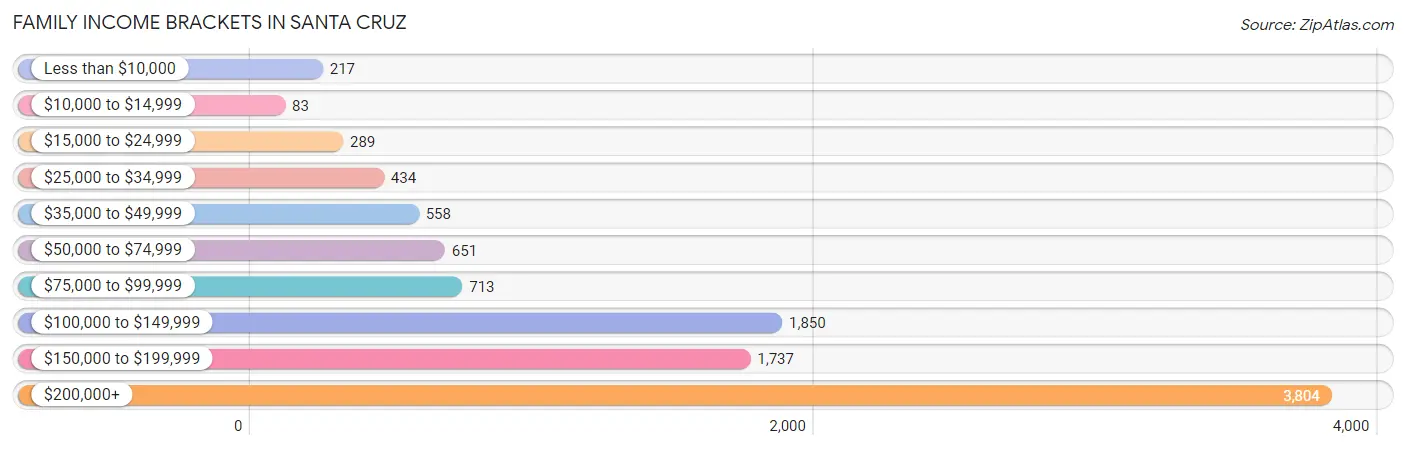
Family Income Brackets in Santa Cruz
According to the Santa Cruz family income data, there are 3,804 families falling into the $200,000+ income range, which is the most common income bracket and makes up 36.8% of all families. Conversely, the $10,000 to $14,999 income bracket is the least frequent group with only 83 families (0.8%) belonging to this category.
| Income Bracket | # Families | % Families |
| Less than $10,000 | 217 | 2.1% |
| $10,000 to $14,999 | 83 | 0.8% |
| $15,000 to $24,999 | 289 | 2.8% |
| $25,000 to $34,999 | 434 | 4.2% |
| $35,000 to $49,999 | 558 | 5.4% |
| $50,000 to $74,999 | 651 | 6.3% |
| $75,000 to $99,999 | 713 | 6.9% |
| $100,000 to $149,999 | 1,850 | 17.9% |
| $150,000 to $199,999 | 1,737 | 16.8% |
| $200,000+ | 3,804 | 36.8% |
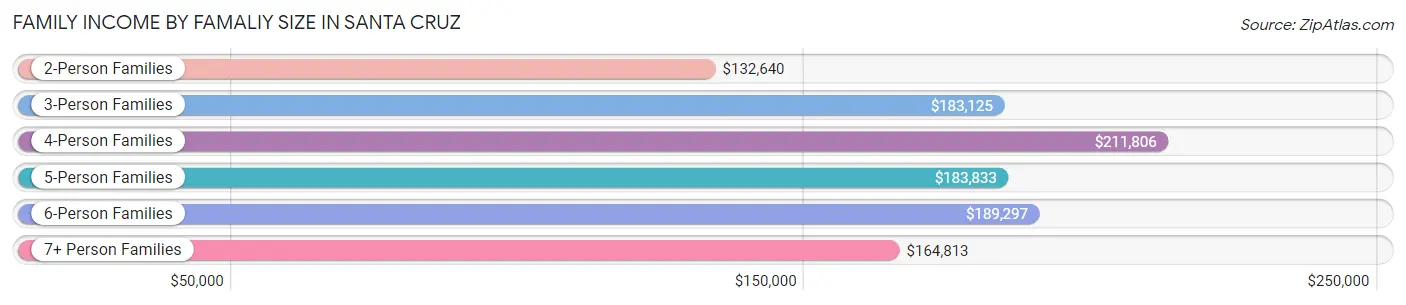
Family Income by Famaliy Size in Santa Cruz
4-person families (2,252 | 21.8%) account for the highest median family income in Santa Cruz with $211,806 per family, while 2-person families (5,320 | 51.5%) have the highest median income of $66,320 per family member.
| Income Bracket | # Families | Median Income |
| 2-Person Families | 5,320 (51.5%) | $132,640 |
| 3-Person Families | 2,137 (20.7%) | $183,125 |
| 4-Person Families | 2,252 (21.8%) | $211,806 |
| 5-Person Families | 480 (4.6%) | $183,833 |
| 6-Person Families | 77 (0.7%) | $189,297 |
| 7+ Person Families | 71 (0.7%) | $164,813 |
| Total | 10,337 (100.0%) | $165,792 |
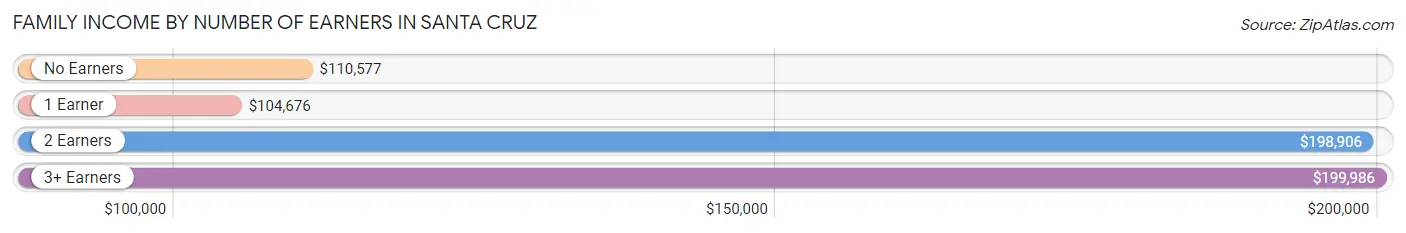
Family Income by Number of Earners in Santa Cruz
The median family income in Santa Cruz is $165,792, with families comprising 3+ earners (1,527) having the highest median family income of $199,986, while families with 1 earner (3,100) have the lowest median family income of $104,676, accounting for 14.8% and 30.0% of families, respectively.
| Number of Earners | # Families | Median Income |
| No Earners | 1,278 (12.4%) | $110,577 |
| 1 Earner | 3,100 (30.0%) | $104,676 |
| 2 Earners | 4,432 (42.9%) | $198,906 |
| 3+ Earners | 1,527 (14.8%) | $199,986 |
| Total | 10,337 (100.0%) | $165,792 |
Household Income in Santa Cruz
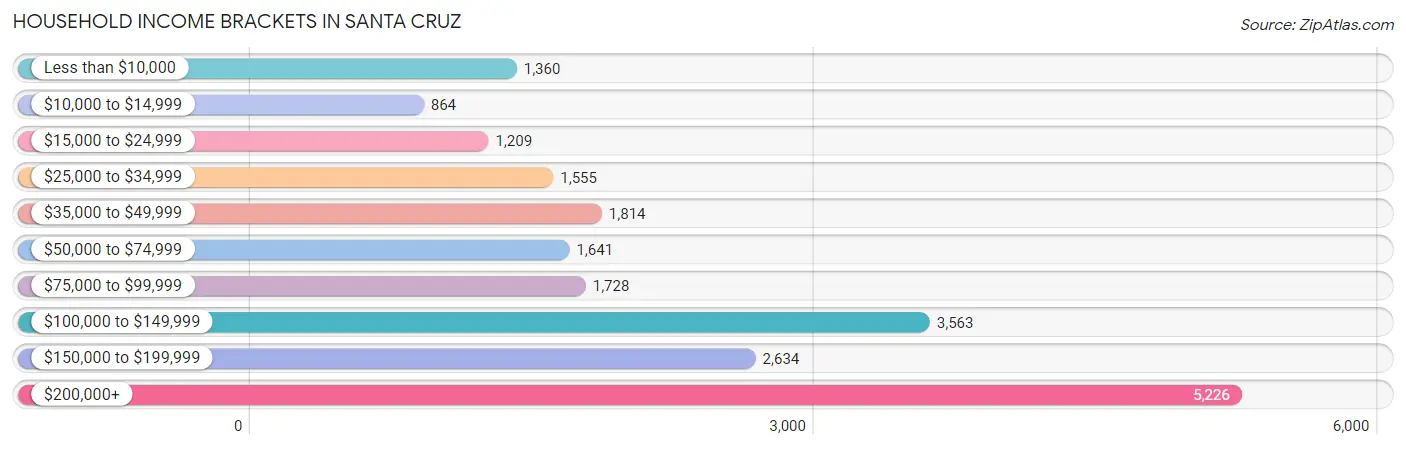
Household Income Brackets in Santa Cruz
With 5,226 households falling in the category, the $200,000+ income range is the most frequent in Santa Cruz, accounting for 24.2% of all households. In contrast, only 864 households (4.0%) fall into the $10,000 to $14,999 income bracket, making it the least populous group.
| Income Bracket | # Households | % Households |
| Less than $10,000 | 1,360 | 6.3% |
| $10,000 to $14,999 | 864 | 4.0% |
| $15,000 to $24,999 | 1,209 | 5.6% |
| $25,000 to $34,999 | 1,555 | 7.2% |
| $35,000 to $49,999 | 1,814 | 8.4% |
| $50,000 to $74,999 | 1,641 | 7.6% |
| $75,000 to $99,999 | 1,728 | 8.0% |
| $100,000 to $149,999 | 3,563 | 16.5% |
| $150,000 to $199,999 | 2,634 | 12.2% |
| $200,000+ | 5,226 | 24.2% |
Household Income by Householder Age in Santa Cruz
The median household income in Santa Cruz is $105,491, with the highest median household income of $147,948 found in the 45 to 64 years age bracket for the primary householder. A total of 7,088 households (32.8%) fall into this category. Meanwhile, the 15 to 24 years age bracket for the primary householder has the lowest median household income of $36,343, with 3,522 households (16.3%) in this group.
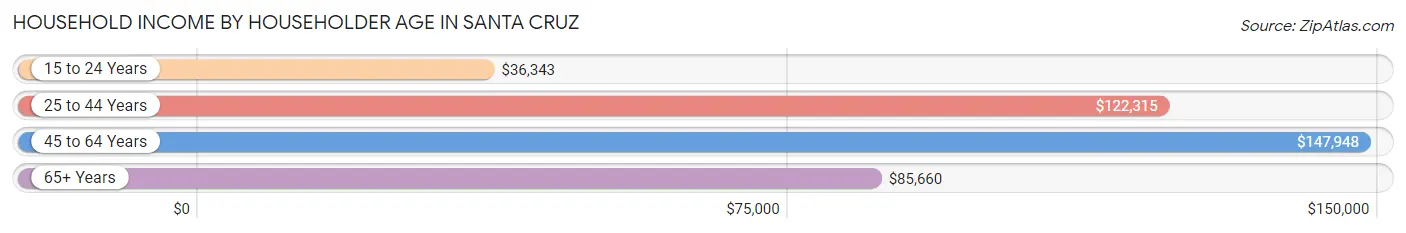
| Income Bracket | # Households | Median Income |
| 15 to 24 Years | 3,522 (16.3%) | $36,343 |
| 25 to 44 Years | 5,902 (27.3%) | $122,315 |
| 45 to 64 Years | 7,088 (32.8%) | $147,948 |
| 65+ Years | 5,082 (23.5%) | $85,660 |
| Total | 21,594 (100.0%) | $105,491 |
Poverty in Santa Cruz
Income Below Poverty by Sex and Age in Santa Cruz
With 16.9% poverty level for males and 20.4% for females among the residents of Santa Cruz, 18 to 24 year old males and 18 to 24 year old females are the most vulnerable to poverty, with 2,427 males (47.1%) and 2,927 females (50.9%) in their respective age groups living below the poverty level.
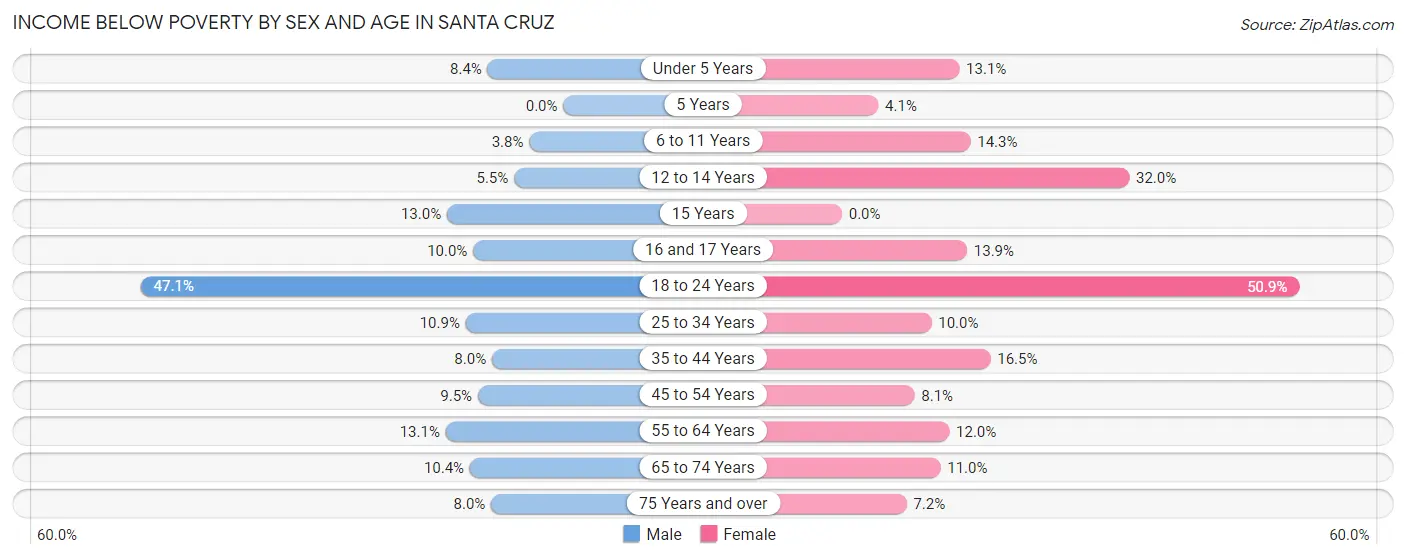
| Age Bracket | Male | Female |
| Under 5 Years | 79 (8.4%) | 112 (13.1%) |
| 5 Years | 0 (0.0%) | 9 (4.1%) |
| 6 to 11 Years | 54 (3.8%) | 141 (14.3%) |
| 12 to 14 Years | 37 (5.5%) | 183 (32.0%) |
| 15 Years | 39 (13.0%) | 0 (0.0%) |
| 16 and 17 Years | 57 (10.0%) | 61 (13.9%) |
| 18 to 24 Years | 2,427 (47.1%) | 2,927 (50.9%) |
| 25 to 34 Years | 440 (10.9%) | 334 (10.0%) |
| 35 to 44 Years | 244 (8.0%) | 540 (16.5%) |
| 45 to 54 Years | 311 (9.5%) | 256 (8.1%) |
| 55 to 64 Years | 387 (13.1%) | 374 (11.9%) |
| 65 to 74 Years | 255 (10.4%) | 282 (11.0%) |
| 75 Years and over | 81 (8.0%) | 127 (7.2%) |
| Total | 4,411 (16.9%) | 5,346 (20.4%) |
Income Above Poverty by Sex and Age in Santa Cruz
According to the poverty statistics in Santa Cruz, males aged 5 years and females aged 15 years are the age groups that are most secure financially, with 100.0% of males and 100.0% of females in these age groups living above the poverty line.
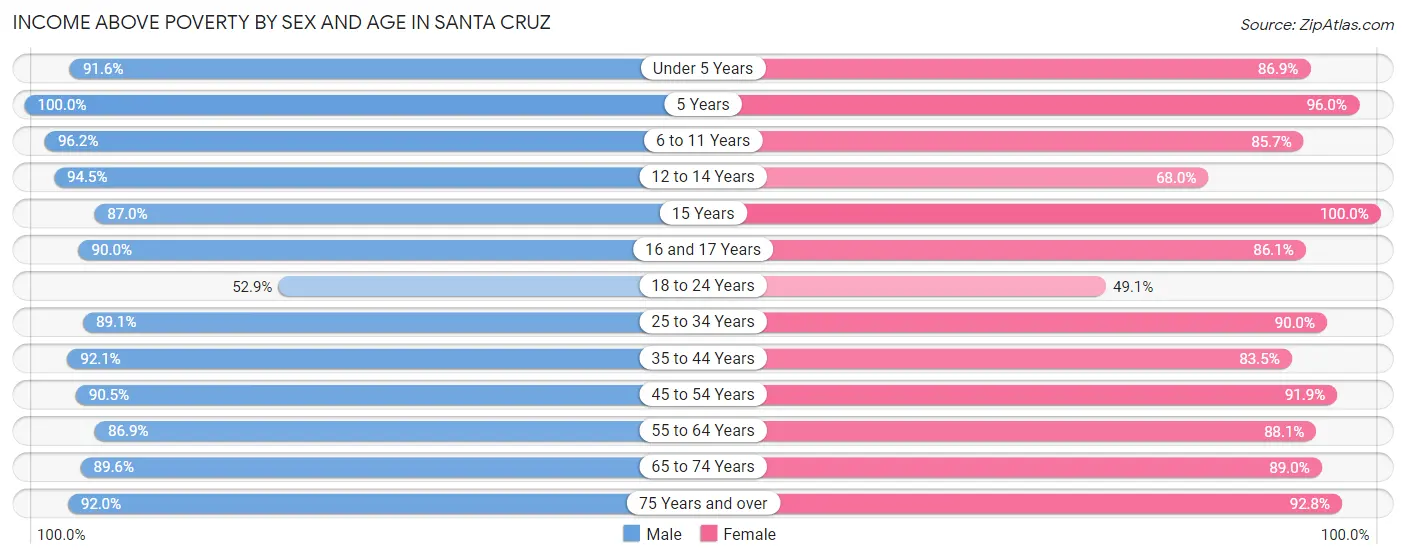
| Age Bracket | Male | Female |
| Under 5 Years | 858 (91.6%) | 745 (86.9%) |
| 5 Years | 196 (100.0%) | 213 (96.0%) |
| 6 to 11 Years | 1,371 (96.2%) | 844 (85.7%) |
| 12 to 14 Years | 638 (94.5%) | 389 (68.0%) |
| 15 Years | 262 (87.0%) | 126 (100.0%) |
| 16 and 17 Years | 511 (90.0%) | 377 (86.1%) |
| 18 to 24 Years | 2,729 (52.9%) | 2,819 (49.1%) |
| 25 to 34 Years | 3,609 (89.1%) | 3,016 (90.0%) |
| 35 to 44 Years | 2,826 (92.0%) | 2,725 (83.5%) |
| 45 to 54 Years | 2,958 (90.5%) | 2,913 (91.9%) |
| 55 to 64 Years | 2,568 (86.9%) | 2,756 (88.0%) |
| 65 to 74 Years | 2,197 (89.6%) | 2,289 (89.0%) |
| 75 Years and over | 926 (92.0%) | 1,638 (92.8%) |
| Total | 21,649 (83.1%) | 20,850 (79.6%) |
Income Below Poverty Among Married-Couple Families in Santa Cruz
The poverty statistics for married-couple families in Santa Cruz show that 2.9% or 237 of the total 8,046 families live below the poverty line. Families with 3 or 4 children have the highest poverty rate of 12.9%, comprising of 38 families. On the other hand, families with 1 or 2 children have the lowest poverty rate of 2.3%, which includes 68 families.
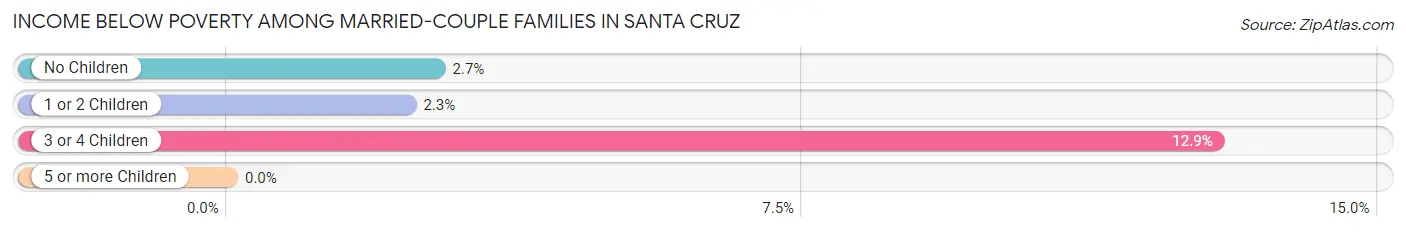
| Children | Above Poverty | Below Poverty |
| No Children | 4,698 (97.3%) | 131 (2.7%) |
| 1 or 2 Children | 2,854 (97.7%) | 68 (2.3%) |
| 3 or 4 Children | 257 (87.1%) | 38 (12.9%) |
| 5 or more Children | 0 (0.0%) | 0 (0.0%) |
| Total | 7,809 (97.1%) | 237 (2.9%) |
Income Below Poverty Among Single-Parent Households in Santa Cruz
According to the poverty data in Santa Cruz, 15.3% or 112 single-father households and 12.6% or 196 single-mother households are living below the poverty line. Among single-father households, those with no children have the highest poverty rate, with 40 households (24.8%) experiencing poverty. Likewise, among single-mother households, those with 3 or 4 children have the highest poverty rate, with 20 households (71.4%) falling below the poverty line.
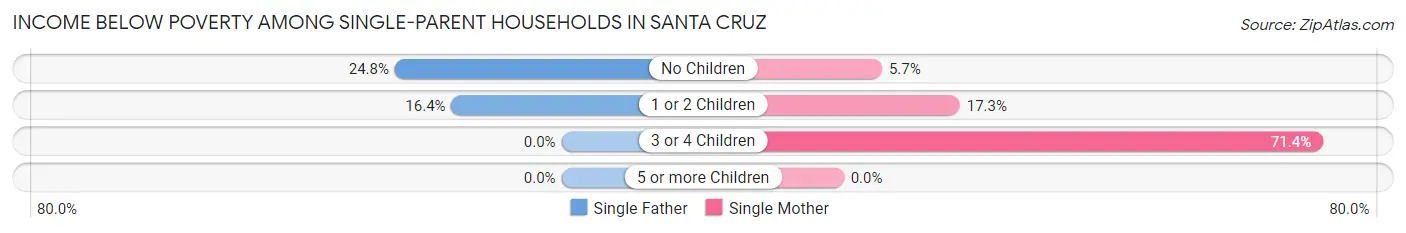
| Children | Single Father | Single Mother |
| No Children | 40 (24.8%) | 44 (5.7%) |
| 1 or 2 Children | 72 (16.4%) | 132 (17.3%) |
| 3 or 4 Children | 0 (0.0%) | 20 (71.4%) |
| 5 or more Children | 0 (0.0%) | 0 (0.0%) |
| Total | 112 (15.3%) | 196 (12.6%) |
Income Below Poverty Among Married-Couple vs Single-Parent Households in Santa Cruz
The poverty data for Santa Cruz shows that 237 of the married-couple family households (2.9%) and 308 of the single-parent households (13.4%) are living below the poverty level. Within the married-couple family households, those with 3 or 4 children have the highest poverty rate, with 38 households (12.9%) falling below the poverty line. Among the single-parent households, those with 1 or 2 children have the highest poverty rate, with 204 household (17.0%) living below poverty.
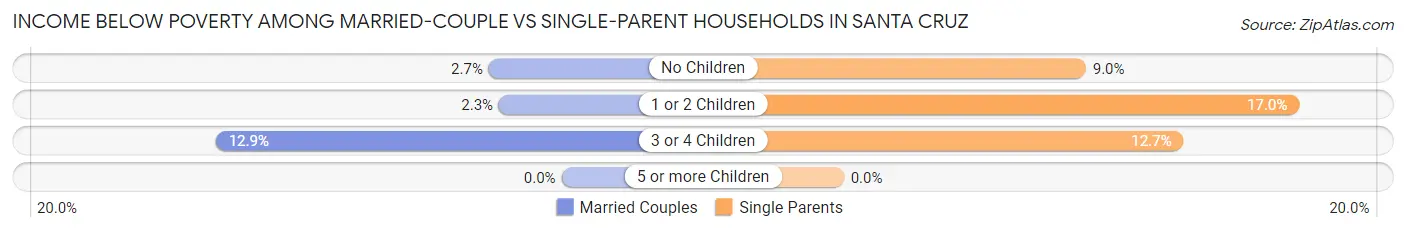
| Children | Married-Couple Families | Single-Parent Households |
| No Children | 131 (2.7%) | 84 (9.0%) |
| 1 or 2 Children | 68 (2.3%) | 204 (17.0%) |
| 3 or 4 Children | 38 (12.9%) | 20 (12.7%) |
| 5 or more Children | 0 (0.0%) | 0 (0.0%) |
| Total | 237 (2.9%) | 308 (13.4%) |
Race in Santa Cruz
The most populous races in Santa Cruz are White / Caucasian (41,533 | 67.7%), Hispanic or Latino (13,002 | 21.2%), and Two or more Races (7,022 | 11.4%).
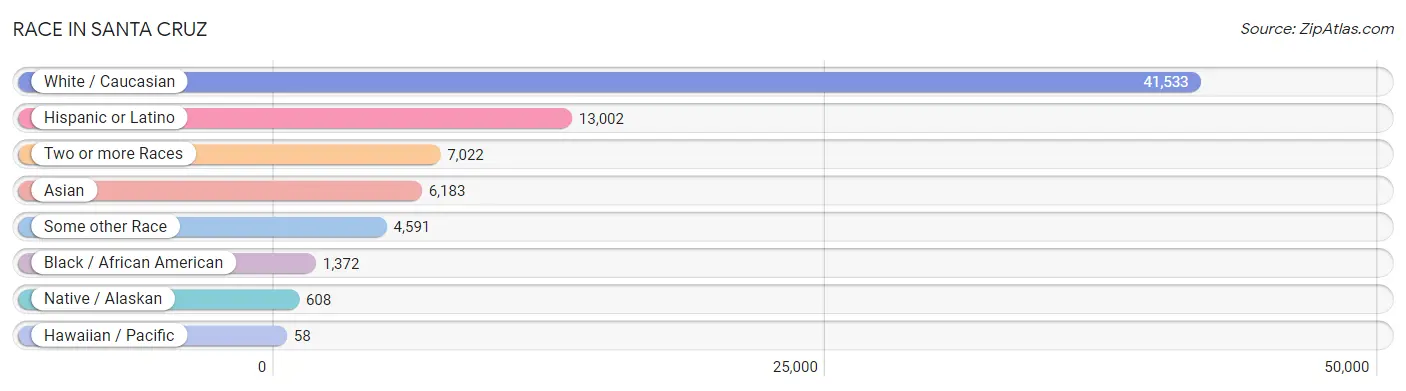
| Race | # Population | % Population |
| Asian | 6,183 | 10.1% |
| Black / African American | 1,372 | 2.2% |
| Hawaiian / Pacific | 58 | 0.1% |
| Hispanic or Latino | 13,002 | 21.2% |
| Native / Alaskan | 608 | 1.0% |
| White / Caucasian | 41,533 | 67.7% |
| Two or more Races | 7,022 | 11.4% |
| Some other Race | 4,591 | 7.5% |
| Total | 61,367 | 100.0% |
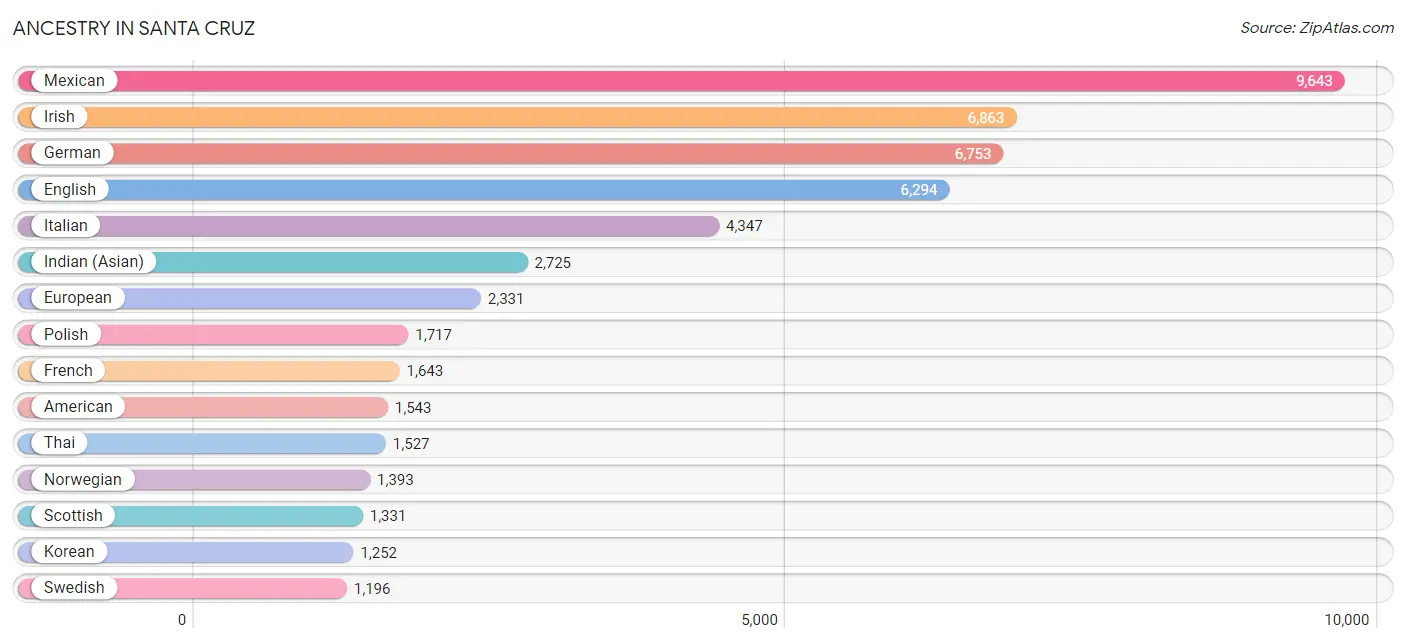
Ancestry in Santa Cruz
The most populous ancestries reported in Santa Cruz are Mexican (9,643 | 15.7%), Irish (6,863 | 11.2%), German (6,753 | 11.0%), English (6,294 | 10.3%), and Italian (4,347 | 7.1%), together accounting for 55.2% of all Santa Cruz residents.
| Ancestry | # Population | % Population |
| Afghan | 109 | 0.2% |
| African | 287 | 0.5% |
| Alsatian | 15 | 0.0% |
| American | 1,543 | 2.5% |
| Apache | 55 | 0.1% |
| Arab | 414 | 0.7% |
| Argentinean | 57 | 0.1% |
| Armenian | 302 | 0.5% |
| Assyrian / Chaldean / Syriac | 59 | 0.1% |
| Australian | 33 | 0.1% |
| Austrian | 258 | 0.4% |
| Basque | 49 | 0.1% |
| Belgian | 150 | 0.2% |
| Belizean | 22 | 0.0% |
| Bhutanese | 1,135 | 1.8% |
| Blackfeet | 12 | 0.0% |
| Bolivian | 16 | 0.0% |
| Brazilian | 244 | 0.4% |
| British | 527 | 0.9% |
| British West Indian | 7 | 0.0% |
| Burmese | 536 | 0.9% |
| Canadian | 122 | 0.2% |
| Celtic | 3 | 0.0% |
| Central American | 913 | 1.5% |
| Central American Indian | 131 | 0.2% |
| Cherokee | 224 | 0.4% |
| Chickasaw | 5 | 0.0% |
| Chilean | 151 | 0.3% |
| Chippewa | 97 | 0.2% |
| Choctaw | 40 | 0.1% |
| Colombian | 55 | 0.1% |
| Comanche | 21 | 0.0% |
| Costa Rican | 33 | 0.1% |
| Croatian | 341 | 0.6% |
| Cuban | 37 | 0.1% |
| Czech | 198 | 0.3% |
| Danish | 388 | 0.6% |
| Dominican | 18 | 0.0% |
| Dutch | 896 | 1.5% |
| Eastern European | 265 | 0.4% |
| Ecuadorian | 3 | 0.0% |
| Egyptian | 77 | 0.1% |
| English | 6,294 | 10.3% |
| Estonian | 12 | 0.0% |
| Ethiopian | 58 | 0.1% |
| European | 2,331 | 3.8% |
| Filipino | 249 | 0.4% |
| Finnish | 136 | 0.2% |
| French | 1,643 | 2.7% |
| French Canadian | 557 | 0.9% |
| German | 6,753 | 11.0% |
| Greek | 201 | 0.3% |
| Guatemalan | 66 | 0.1% |
| Haitian | 8 | 0.0% |
| Honduran | 105 | 0.2% |
| Hungarian | 239 | 0.4% |
| Icelander | 144 | 0.2% |
| Indian (Asian) | 2,725 | 4.4% |
| Indonesian | 3 | 0.0% |
| Iranian | 283 | 0.5% |
| Irish | 6,863 | 11.2% |
| Iroquois | 11 | 0.0% |
| Israeli | 76 | 0.1% |
| Italian | 4,347 | 7.1% |
| Jamaican | 94 | 0.2% |
| Korean | 1,252 | 2.0% |
| Laotian | 43 | 0.1% |
| Latvian | 42 | 0.1% |
| Lebanese | 83 | 0.1% |
| Lithuanian | 88 | 0.1% |
| Lumbee | 3 | 0.0% |
| Macedonian | 45 | 0.1% |
| Malaysian | 24 | 0.0% |
| Menominee | 20 | 0.0% |
| Mexican | 9,643 | 15.7% |
| Mexican American Indian | 570 | 0.9% |
| Mongolian | 15 | 0.0% |
| Moroccan | 15 | 0.0% |
| Native Hawaiian | 93 | 0.2% |
| Navajo | 90 | 0.2% |
| Nicaraguan | 127 | 0.2% |
| Nigerian | 35 | 0.1% |
| Northern European | 235 | 0.4% |
| Norwegian | 1,393 | 2.3% |
| Okinawan | 4 | 0.0% |
| Paiute | 51 | 0.1% |
| Pakistani | 43 | 0.1% |
| Palestinian | 38 | 0.1% |
| Panamanian | 59 | 0.1% |
| Pennsylvania German | 12 | 0.0% |
| Peruvian | 274 | 0.4% |
| Pima | 5 | 0.0% |
| Polish | 1,717 | 2.8% |
| Portuguese | 482 | 0.8% |
| Pueblo | 8 | 0.0% |
| Puerto Rican | 372 | 0.6% |
| Romanian | 93 | 0.2% |
| Russian | 1,147 | 1.9% |
| Salvadoran | 523 | 0.9% |
| Samoan | 80 | 0.1% |
| Scandinavian | 263 | 0.4% |
| Scotch-Irish | 676 | 1.1% |
| Scottish | 1,331 | 2.2% |
| Serbian | 70 | 0.1% |
| Shoshone | 23 | 0.0% |
| Sierra Leonean | 11 | 0.0% |
| Sioux | 54 | 0.1% |
| Slavic | 51 | 0.1% |
| Slovak | 58 | 0.1% |
| Slovene | 98 | 0.2% |
| South African | 12 | 0.0% |
| South American | 689 | 1.1% |
| South American Indian | 23 | 0.0% |
| Spaniard | 214 | 0.4% |
| Spanish | 495 | 0.8% |
| Sri Lankan | 410 | 0.7% |
| Subsaharan African | 455 | 0.7% |
| Swedish | 1,196 | 1.9% |
| Swiss | 188 | 0.3% |
| Syrian | 17 | 0.0% |
| Thai | 1,527 | 2.5% |
| Tlingit-Haida | 43 | 0.1% |
| Tongan | 2 | 0.0% |
| Turkish | 244 | 0.4% |
| Ugandan | 21 | 0.0% |
| Ukrainian | 174 | 0.3% |
| Ute | 16 | 0.0% |
| Venezuelan | 133 | 0.2% |
| Vietnamese | 28 | 0.1% |
| Welsh | 526 | 0.9% |
| West Indian | 102 | 0.2% |
| Yaqui | 24 | 0.0% |
| Yugoslavian | 36 | 0.1% | View All 133 Rows |
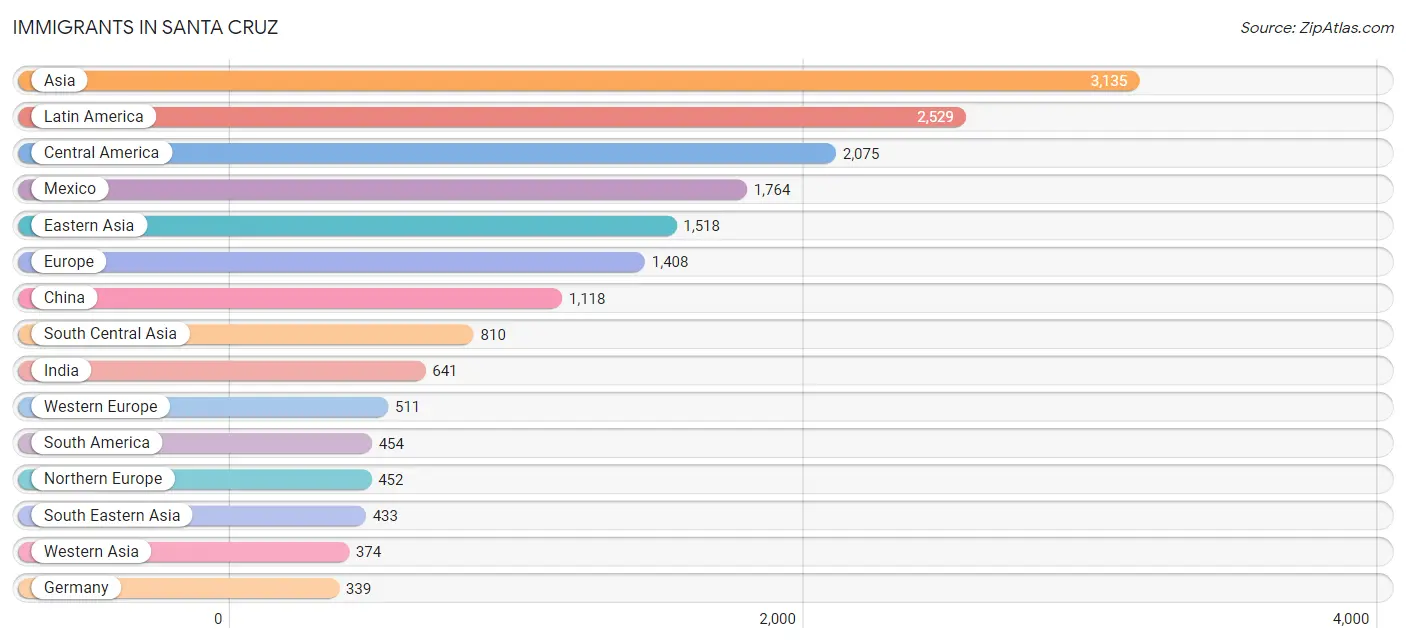
Immigrants in Santa Cruz
The most numerous immigrant groups reported in Santa Cruz came from Asia (3,135 | 5.1%), Latin America (2,529 | 4.1%), Central America (2,075 | 3.4%), Mexico (1,764 | 2.9%), and Eastern Asia (1,518 | 2.5%), together accounting for 17.9% of all Santa Cruz residents.
| Immigration Origin | # Population | % Population |
| Africa | 193 | 0.3% |
| Argentina | 17 | 0.0% |
| Asia | 3,135 | 5.1% |
| Australia | 58 | 0.1% |
| Austria | 28 | 0.1% |
| Bangladesh | 6 | 0.0% |
| Belgium | 10 | 0.0% |
| Bolivia | 18 | 0.0% |
| Brazil | 148 | 0.2% |
| Canada | 321 | 0.5% |
| Central America | 2,075 | 3.4% |
| Chile | 45 | 0.1% |
| China | 1,118 | 1.8% |
| Colombia | 5 | 0.0% |
| Croatia | 50 | 0.1% |
| Czechoslovakia | 56 | 0.1% |
| Denmark | 18 | 0.0% |
| Eastern Africa | 76 | 0.1% |
| Eastern Asia | 1,518 | 2.5% |
| Eastern Europe | 336 | 0.5% |
| Egypt | 38 | 0.1% |
| El Salvador | 176 | 0.3% |
| England | 192 | 0.3% |
| Ethiopia | 21 | 0.0% |
| Europe | 1,408 | 2.3% |
| Fiji | 10 | 0.0% |
| France | 128 | 0.2% |
| Germany | 339 | 0.5% |
| Guatemala | 24 | 0.0% |
| Guyana | 36 | 0.1% |
| Honduras | 65 | 0.1% |
| Hong Kong | 22 | 0.0% |
| Hungary | 14 | 0.0% |
| India | 641 | 1.0% |
| Indonesia | 25 | 0.0% |
| Iran | 122 | 0.2% |
| Iraq | 52 | 0.1% |
| Ireland | 9 | 0.0% |
| Israel | 75 | 0.1% |
| Italy | 80 | 0.1% |
| Japan | 202 | 0.3% |
| Kenya | 40 | 0.1% |
| Korea | 198 | 0.3% |
| Laos | 5 | 0.0% |
| Latin America | 2,529 | 4.1% |
| Latvia | 9 | 0.0% |
| Malaysia | 15 | 0.0% |
| Mexico | 1,764 | 2.9% |
| Moldova | 8 | 0.0% |
| Nepal | 22 | 0.0% |
| Netherlands | 6 | 0.0% |
| Nicaragua | 46 | 0.1% |
| Nigeria | 13 | 0.0% |
| Northern Africa | 62 | 0.1% |
| Northern Europe | 452 | 0.7% |
| Norway | 5 | 0.0% |
| Oceania | 89 | 0.2% |
| Peru | 124 | 0.2% |
| Philippines | 263 | 0.4% |
| Poland | 46 | 0.1% |
| Portugal | 8 | 0.0% |
| Romania | 3 | 0.0% |
| Russia | 107 | 0.2% |
| Scotland | 7 | 0.0% |
| Senegal | 19 | 0.0% |
| Serbia | 17 | 0.0% |
| Sierra Leone | 11 | 0.0% |
| Singapore | 52 | 0.1% |
| South Africa | 12 | 0.0% |
| South America | 454 | 0.7% |
| South Central Asia | 810 | 1.3% |
| South Eastern Asia | 433 | 0.7% |
| Southern Europe | 109 | 0.2% |
| Spain | 21 | 0.0% |
| Sri Lanka | 19 | 0.0% |
| Sudan | 3 | 0.0% |
| Sweden | 54 | 0.1% |
| Syria | 23 | 0.0% |
| Taiwan | 119 | 0.2% |
| Thailand | 33 | 0.1% |
| Turkey | 99 | 0.2% |
| Uganda | 15 | 0.0% |
| Ukraine | 11 | 0.0% |
| Venezuela | 61 | 0.1% |
| Vietnam | 40 | 0.1% |
| Western Africa | 43 | 0.1% |
| Western Asia | 374 | 0.6% |
| Western Europe | 511 | 0.8% |
| Yemen | 70 | 0.1% | View All 89 Rows |
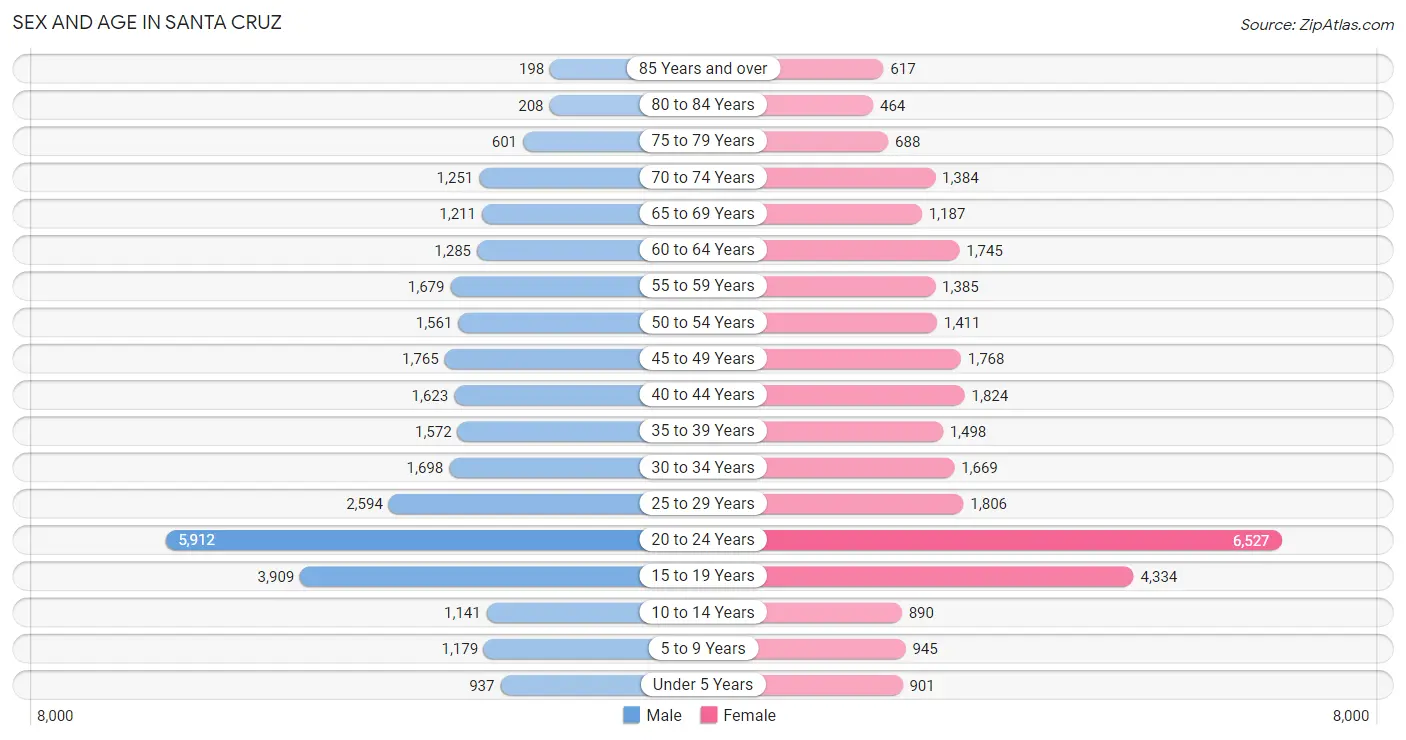
Sex and Age in Santa Cruz
Sex and Age in Santa Cruz
The most populous age groups in Santa Cruz are 20 to 24 Years (5,912 | 19.5%) for men and 20 to 24 Years (6,527 | 21.0%) for women.
| Age Bracket | Male | Female |
| Under 5 Years | 937 (3.1%) | 901 (2.9%) |
| 5 to 9 Years | 1,179 (3.9%) | 945 (3.0%) |
| 10 to 14 Years | 1,141 (3.8%) | 890 (2.9%) |
| 15 to 19 Years | 3,909 (12.9%) | 4,334 (14.0%) |
| 20 to 24 Years | 5,912 (19.5%) | 6,527 (21.0%) |
| 25 to 29 Years | 2,594 (8.6%) | 1,806 (5.8%) |
| 30 to 34 Years | 1,698 (5.6%) | 1,669 (5.4%) |
| 35 to 39 Years | 1,572 (5.2%) | 1,498 (4.8%) |
| 40 to 44 Years | 1,623 (5.3%) | 1,824 (5.9%) |
| 45 to 49 Years | 1,765 (5.8%) | 1,768 (5.7%) |
| 50 to 54 Years | 1,561 (5.1%) | 1,411 (4.5%) |
| 55 to 59 Years | 1,679 (5.5%) | 1,385 (4.5%) |
| 60 to 64 Years | 1,285 (4.2%) | 1,745 (5.6%) |
| 65 to 69 Years | 1,211 (4.0%) | 1,187 (3.8%) |
| 70 to 74 Years | 1,251 (4.1%) | 1,384 (4.5%) |
| 75 to 79 Years | 601 (2.0%) | 688 (2.2%) |
| 80 to 84 Years | 208 (0.7%) | 464 (1.5%) |
| 85 Years and over | 198 (0.6%) | 617 (2.0%) |
| Total | 30,324 (100.0%) | 31,043 (100.0%) |
Families and Households in Santa Cruz
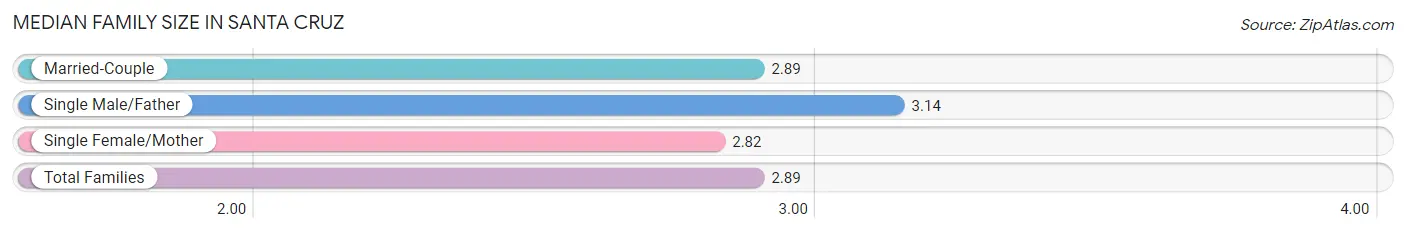
Median Family Size in Santa Cruz
The median family size in Santa Cruz is 2.89 persons per family, with single male/father families (730 | 7.1%) accounting for the largest median family size of 3.14 persons per family. On the other hand, single female/mother families (1,561 | 15.1%) represent the smallest median family size with 2.82 persons per family.
| Family Type | # Families | Family Size |
| Married-Couple | 8,046 (77.8%) | 2.89 |
| Single Male/Father | 730 (7.1%) | 3.14 |
| Single Female/Mother | 1,561 (15.1%) | 2.82 |
| Total Families | 10,337 (100.0%) | 2.89 |
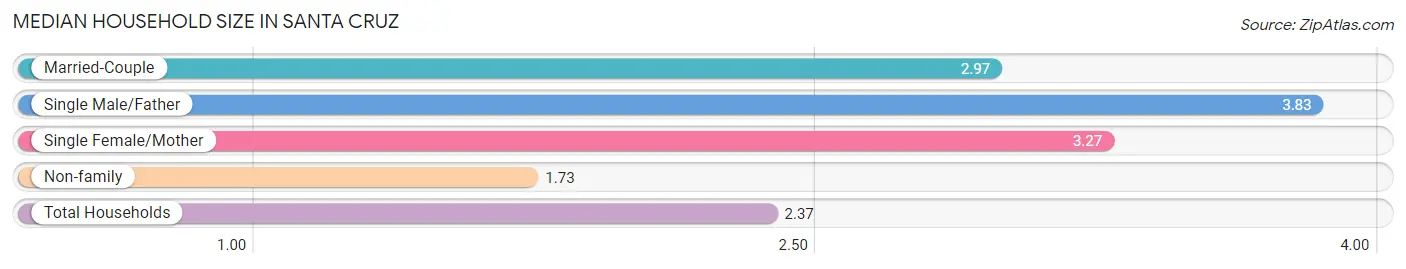
Median Household Size in Santa Cruz
The median household size in Santa Cruz is 2.37 persons per household, with single male/father households (730 | 3.4%) accounting for the largest median household size of 3.83 persons per household. non-family households (11,257 | 52.1%) represent the smallest median household size with 1.73 persons per household.
| Household Type | # Households | Household Size |
| Married-Couple | 8,046 (37.3%) | 2.97 |
| Single Male/Father | 730 (3.4%) | 3.83 |
| Single Female/Mother | 1,561 (7.2%) | 3.27 |
| Non-family | 11,257 (52.1%) | 1.73 |
| Total Households | 21,594 (100.0%) | 2.37 |
Household Size by Marriage Status in Santa Cruz
Out of a total of 21,594 households in Santa Cruz, 10,337 (47.9%) are family households, while 11,257 (52.1%) are nonfamily households. The most numerous type of family households are 2-person households, comprising 4,669, and the most common type of nonfamily households are 1-person households, comprising 6,202.
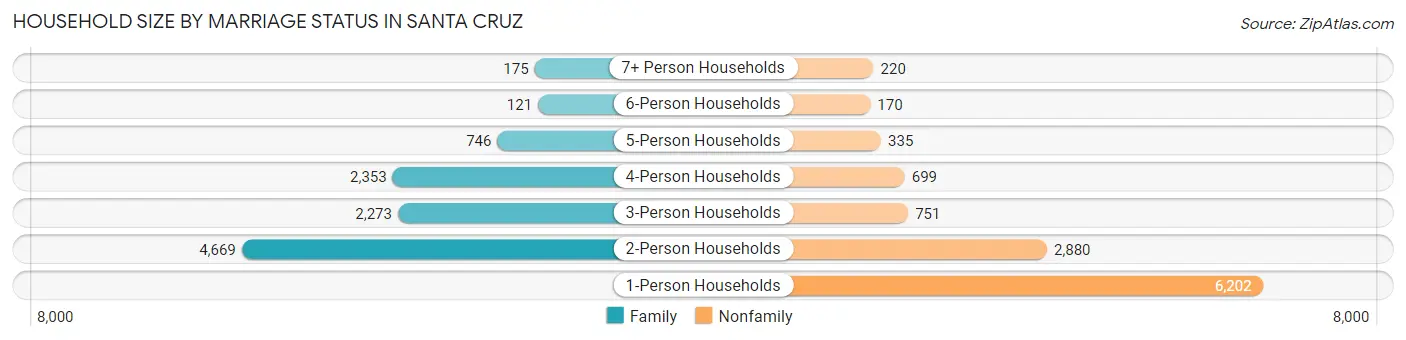
| Household Size | Family Households | Nonfamily Households |
| 1-Person Households | - | 6,202 (28.7%) |
| 2-Person Households | 4,669 (21.6%) | 2,880 (13.3%) |
| 3-Person Households | 2,273 (10.5%) | 751 (3.5%) |
| 4-Person Households | 2,353 (10.9%) | 699 (3.2%) |
| 5-Person Households | 746 (3.5%) | 335 (1.5%) |
| 6-Person Households | 121 (0.6%) | 170 (0.8%) |
| 7+ Person Households | 175 (0.8%) | 220 (1.0%) |
| Total | 10,337 (47.9%) | 11,257 (52.1%) |
Female Fertility in Santa Cruz
Fertility by Age in Santa Cruz
Average fertility rate in Santa Cruz is 22.0 births per 1,000 women. Women in the age bracket of 35 to 50 years have the highest fertility rate with 30.0 births per 1,000 women. Women in the age bracket of 20 to 34 years acount for 63.2% of all women with births.
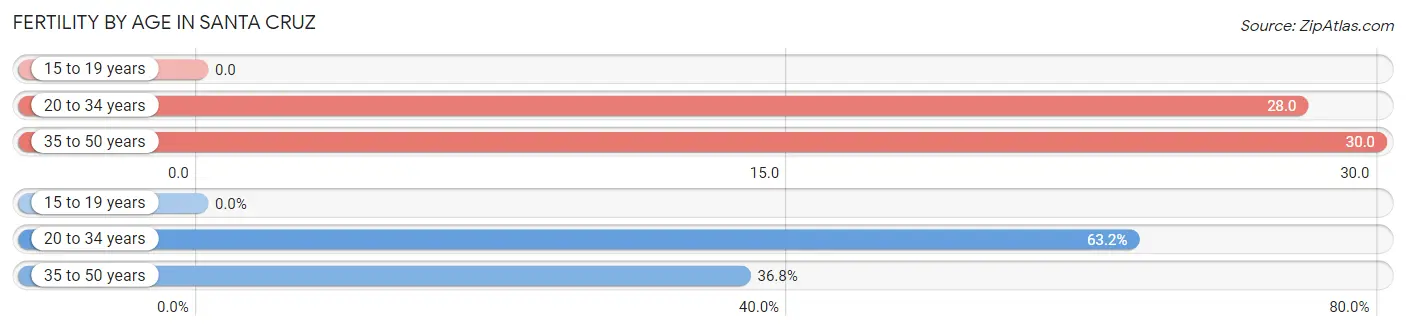
| Age Bracket | Women with Births | Births / 1,000 Women |
| 15 to 19 years | 0 (0.0%) | 0.0 |
| 20 to 34 years | 278 (63.2%) | 28.0 |
| 35 to 50 years | 162 (36.8%) | 30.0 |
| Total | 440 (100.0%) | 22.0 |
Fertility by Age by Marriage Status in Santa Cruz
55.7% of women with births (440) in Santa Cruz are married. The highest percentage of unmarried women with births falls into 35 to 50 years age bracket with 57.4% of them unmarried at the time of birth, while the lowest percentage of unmarried women with births belong to 20 to 34 years age bracket with 36.7% of them unmarried.
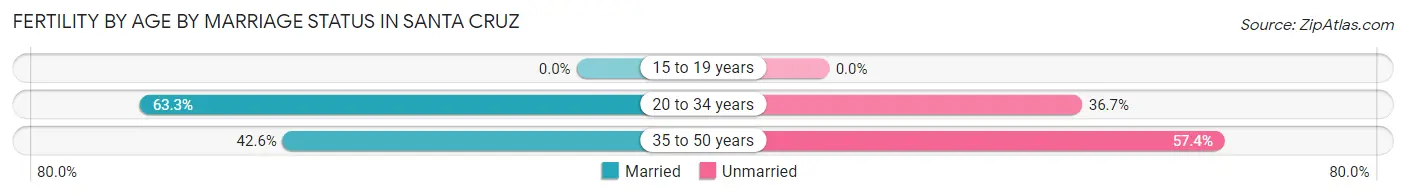
| Age Bracket | Married | Unmarried |
| 15 to 19 years | 0 (0.0%) | 0 (0.0%) |
| 20 to 34 years | 176 (63.3%) | 102 (36.7%) |
| 35 to 50 years | 69 (42.6%) | 93 (57.4%) |
| Total | 245 (55.7%) | 195 (44.3%) |
Fertility by Education in Santa Cruz
Average fertility rate in Santa Cruz is 22.0 births per 1,000 women. Women with the education attainment of bachelor's degree have the highest fertility rate of 48.0 births per 1,000 women, while women with the education attainment of college or associate's degree have the lowest fertility at 8.0 births per 1,000 women. Women with the education attainment of bachelor's degree represent 53.6% of all women with births.
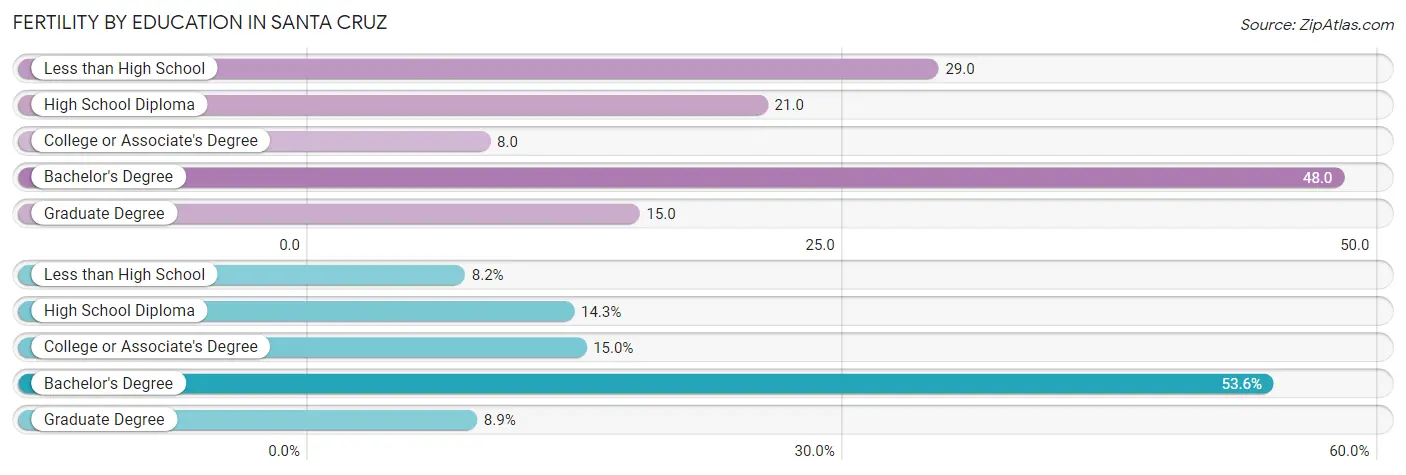
| Educational Attainment | Women with Births | Births / 1,000 Women |
| Less than High School | 36 (8.2%) | 29.0 |
| High School Diploma | 63 (14.3%) | 21.0 |
| College or Associate's Degree | 66 (15.0%) | 8.0 |
| Bachelor's Degree | 236 (53.6%) | 48.0 |
| Graduate Degree | 39 (8.9%) | 15.0 |
| Total | 440 (100.0%) | 22.0 |
Fertility by Education by Marriage Status in Santa Cruz
44.3% of women with births in Santa Cruz are unmarried. Women with the educational attainment of bachelor's degree are most likely to be married with 64.4% of them married at childbirth, while women with the educational attainment of less than high school are least likely to be married with 100.0% of them unmarried at childbirth.
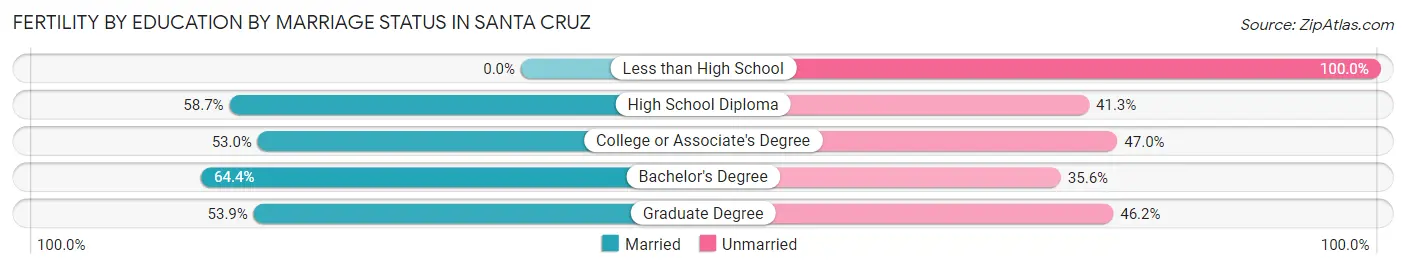
| Educational Attainment | Married | Unmarried |
| Less than High School | 0 (0.0%) | 36 (100.0%) |
| High School Diploma | 37 (58.7%) | 26 (41.3%) |
| College or Associate's Degree | 35 (53.0%) | 31 (47.0%) |
| Bachelor's Degree | 152 (64.4%) | 84 (35.6%) |
| Graduate Degree | 21 (53.8%) | 18 (46.2%) |
| Total | 245 (55.7%) | 195 (44.3%) |
Employment Characteristics in Santa Cruz
Employment by Class of Employer in Santa Cruz
Among the 30,358 employed individuals in Santa Cruz, private company employees (17,519 | 57.7%), not-for-profit organizations (3,378 | 11.1%), and state government employees (3,356 | 11.1%) make up the most common classes of employment.
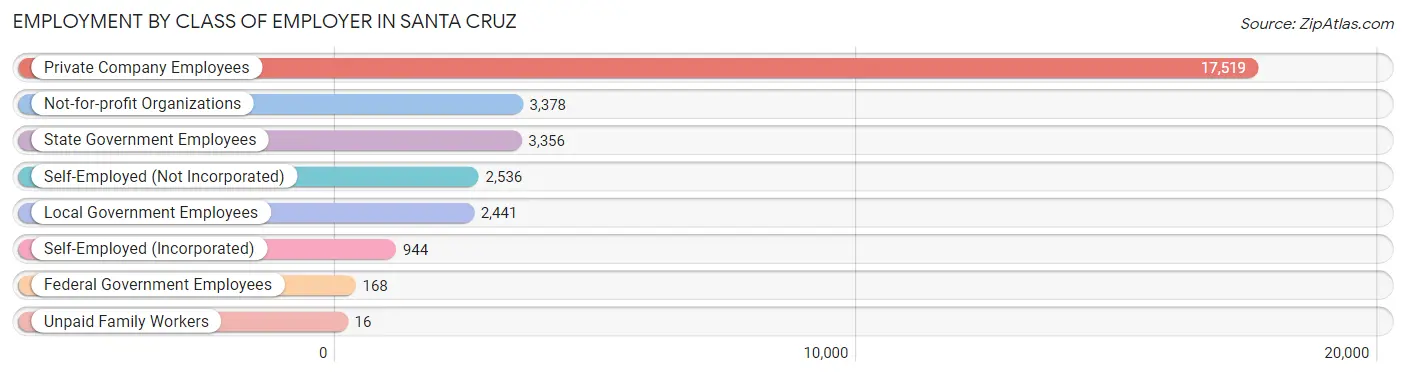
| Employer Class | # Employees | % Employees |
| Private Company Employees | 17,519 | 57.7% |
| Self-Employed (Incorporated) | 944 | 3.1% |
| Self-Employed (Not Incorporated) | 2,536 | 8.4% |
| Not-for-profit Organizations | 3,378 | 11.1% |
| Local Government Employees | 2,441 | 8.0% |
| State Government Employees | 3,356 | 11.1% |
| Federal Government Employees | 168 | 0.5% |
| Unpaid Family Workers | 16 | 0.1% |
| Total | 30,358 | 100.0% |
Employment Status by Age in Santa Cruz
According to the labor force statistics for Santa Cruz, out of the total population over 16 years of age (54,946), 61.6% or 33,847 individuals are in the labor force, with 6.2% or 2,099 of them unemployed. The age group with the highest labor force participation rate is 35 to 44 years, with 84.9% or 5,533 individuals in the labor force. Within the labor force, the 16 to 19 years age range has the highest percentage of unemployed individuals, with 16.6% or 454 of them being unemployed.
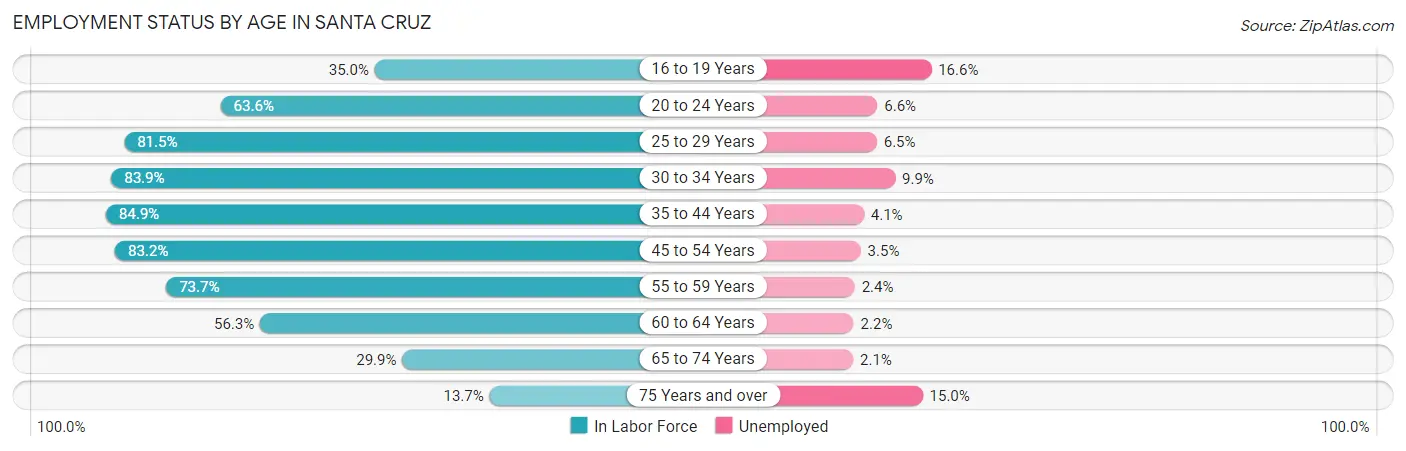
| Age Bracket | In Labor Force | Unemployed |
| 16 to 19 Years | 2,735 (35.0%) | 454 (16.6%) |
| 20 to 24 Years | 7,911 (63.6%) | 522 (6.6%) |
| 25 to 29 Years | 3,586 (81.5%) | 233 (6.5%) |
| 30 to 34 Years | 2,825 (83.9%) | 280 (9.9%) |
| 35 to 44 Years | 5,533 (84.9%) | 227 (4.1%) |
| 45 to 54 Years | 5,412 (83.2%) | 189 (3.5%) |
| 55 to 59 Years | 2,258 (73.7%) | 54 (2.4%) |
| 60 to 64 Years | 1,706 (56.3%) | 38 (2.2%) |
| 65 to 74 Years | 1,505 (29.9%) | 32 (2.1%) |
| 75 Years and over | 380 (13.7%) | 57 (15.0%) |
| Total | 33,847 (61.6%) | 2,099 (6.2%) |
Employment Status by Educational Attainment in Santa Cruz
According to labor force statistics for Santa Cruz, 79.3% of individuals (21,318) out of the total population between 25 and 64 years of age (26,883) are in the labor force, with 4.8% or 1,023 of them being unemployed. The group with the highest labor force participation rate are those with the educational attainment of bachelor's degree or higher, with 86.0% or 13,644 individuals in the labor force. Within the labor force, individuals with college / associate degree education have the highest percentage of unemployment, with 7.1% or 371 of them being unemployed.
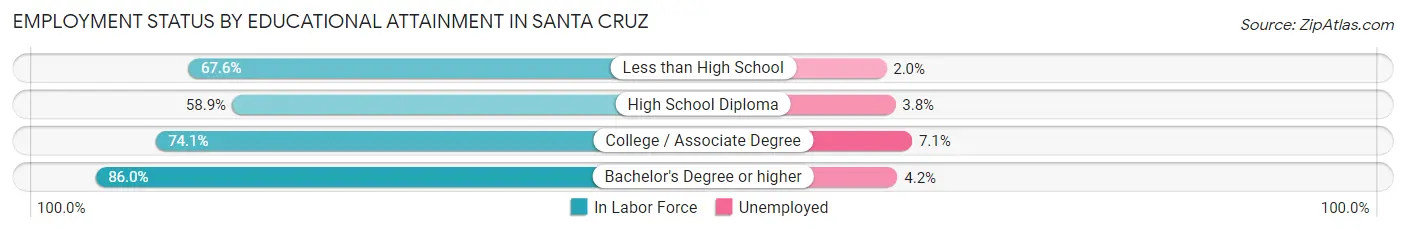
| Educational Attainment | In Labor Force | Unemployed |
| Less than High School | 879 (67.6%) | 26 (2.0%) |
| High School Diploma | 1,574 (58.9%) | 102 (3.8%) |
| College / Associate Degree | 5,221 (74.1%) | 500 (7.1%) |
| Bachelor's Degree or higher | 13,644 (86.0%) | 666 (4.2%) |
| Total | 21,318 (79.3%) | 1,290 (4.8%) |
Employment Occupations by Sex in Santa Cruz
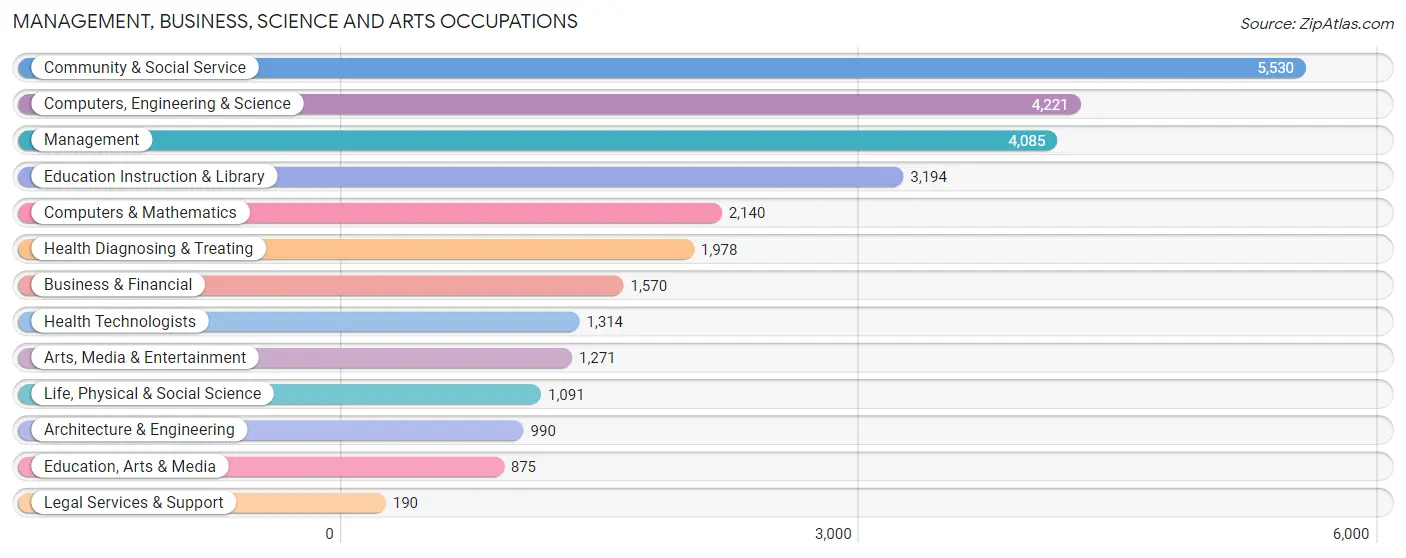
Management, Business, Science and Arts Occupations
The most common Management, Business, Science and Arts occupations in Santa Cruz are Community & Social Service (5,530 | 17.4%), Computers, Engineering & Science (4,221 | 13.3%), Management (4,085 | 12.9%), Education Instruction & Library (3,194 | 10.1%), and Computers & Mathematics (2,140 | 6.7%).
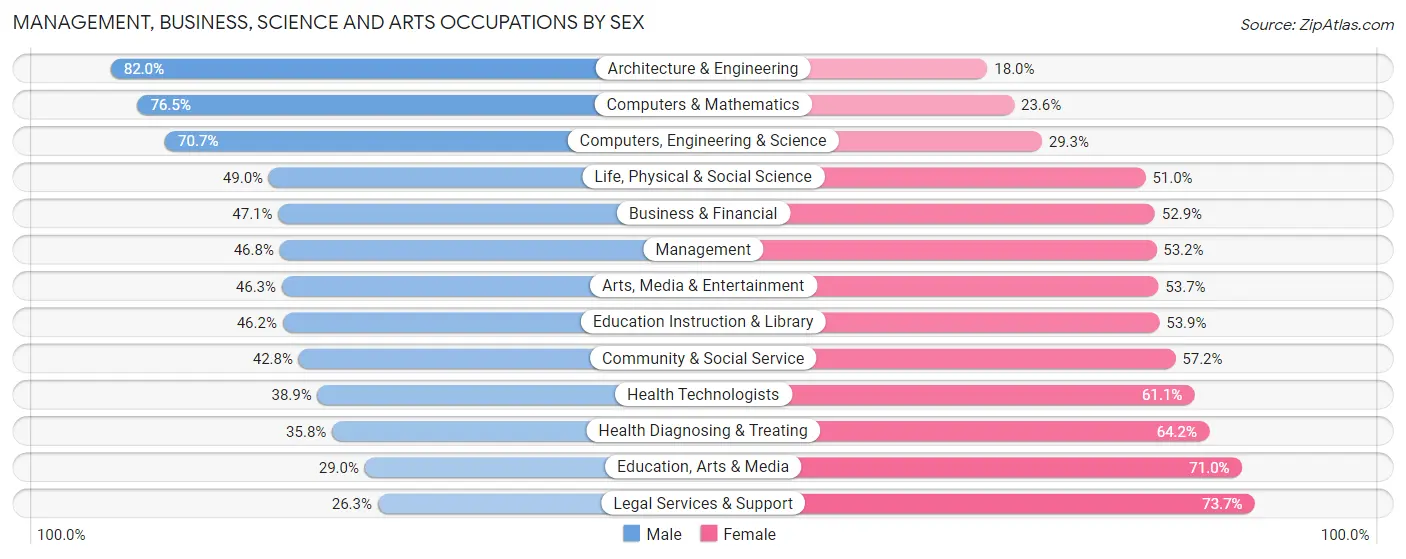
Management, Business, Science and Arts Occupations by Sex
Within the Management, Business, Science and Arts occupations in Santa Cruz, the most male-oriented occupations are Architecture & Engineering (82.0%), Computers & Mathematics (76.4%), and Computers, Engineering & Science (70.7%), while the most female-oriented occupations are Legal Services & Support (73.7%), Education, Arts & Media (71.0%), and Health Diagnosing & Treating (64.2%).
| Occupation | Male | Female |
| Management | 1,911 (46.8%) | 2,174 (53.2%) |
| Business & Financial | 739 (47.1%) | 831 (52.9%) |
| Computers, Engineering & Science | 2,983 (70.7%) | 1,238 (29.3%) |
| Computers & Mathematics | 1,636 (76.4%) | 504 (23.5%) |
| Architecture & Engineering | 812 (82.0%) | 178 (18.0%) |
| Life, Physical & Social Science | 535 (49.0%) | 556 (51.0%) |
| Community & Social Service | 2,367 (42.8%) | 3,163 (57.2%) |
| Education, Arts & Media | 254 (29.0%) | 621 (71.0%) |
| Legal Services & Support | 50 (26.3%) | 140 (73.7%) |
| Education Instruction & Library | 1,474 (46.2%) | 1,720 (53.8%) |
| Arts, Media & Entertainment | 589 (46.3%) | 682 (53.7%) |
| Health Diagnosing & Treating | 709 (35.8%) | 1,269 (64.2%) |
| Health Technologists | 511 (38.9%) | 803 (61.1%) |
| Total (Category) | 8,709 (50.1%) | 8,675 (49.9%) |
| Total (Overall) | 15,902 (50.1%) | 15,860 (49.9%) |
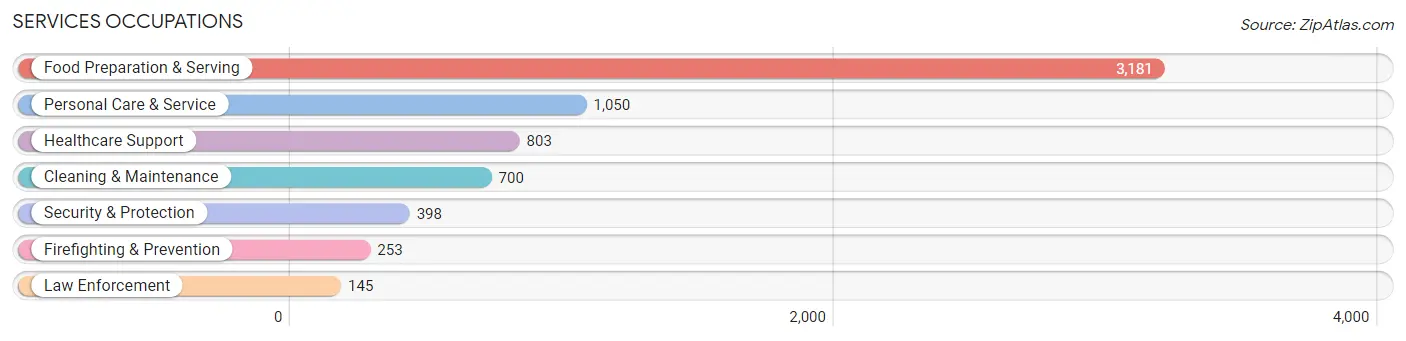
Services Occupations
The most common Services occupations in Santa Cruz are Food Preparation & Serving (3,181 | 10.0%), Personal Care & Service (1,050 | 3.3%), Healthcare Support (803 | 2.5%), Cleaning & Maintenance (700 | 2.2%), and Security & Protection (398 | 1.3%).
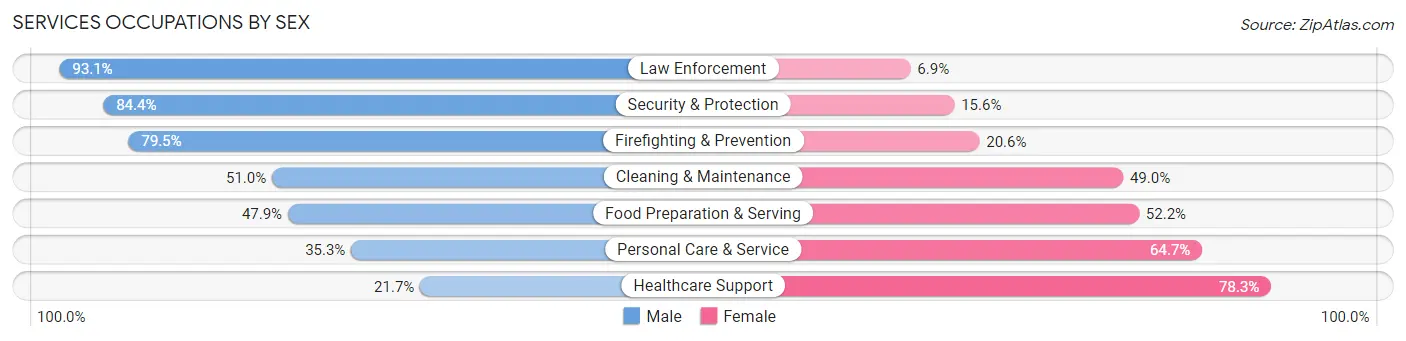
Services Occupations by Sex
Within the Services occupations in Santa Cruz, the most male-oriented occupations are Law Enforcement (93.1%), Security & Protection (84.4%), and Firefighting & Prevention (79.4%), while the most female-oriented occupations are Healthcare Support (78.3%), Personal Care & Service (64.7%), and Food Preparation & Serving (52.1%).
| Occupation | Male | Female |
| Healthcare Support | 174 (21.7%) | 629 (78.3%) |
| Security & Protection | 336 (84.4%) | 62 (15.6%) |
| Firefighting & Prevention | 201 (79.4%) | 52 (20.5%) |
| Law Enforcement | 135 (93.1%) | 10 (6.9%) |
| Food Preparation & Serving | 1,522 (47.8%) | 1,659 (52.1%) |
| Cleaning & Maintenance | 357 (51.0%) | 343 (49.0%) |
| Personal Care & Service | 371 (35.3%) | 679 (64.7%) |
| Total (Category) | 2,760 (45.0%) | 3,372 (55.0%) |
| Total (Overall) | 15,902 (50.1%) | 15,860 (49.9%) |
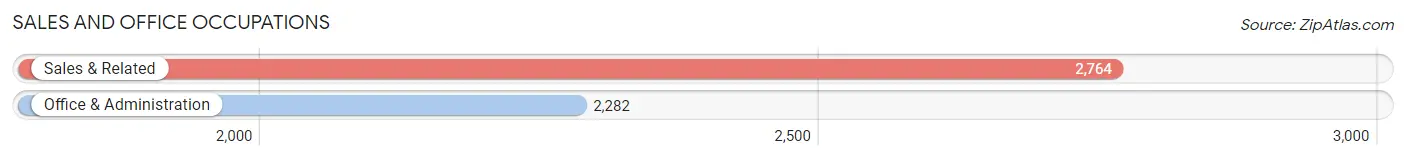
Sales and Office Occupations
The most common Sales and Office occupations in Santa Cruz are Sales & Related (2,764 | 8.7%), and Office & Administration (2,282 | 7.2%).
Sales and Office Occupations by Sex
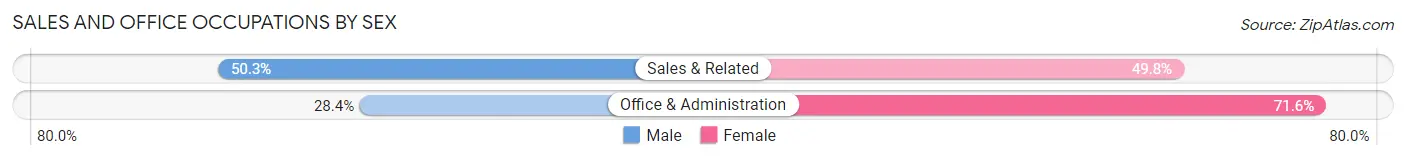
| Occupation | Male | Female |
| Sales & Related | 1,389 (50.2%) | 1,375 (49.7%) |
| Office & Administration | 648 (28.4%) | 1,634 (71.6%) |
| Total (Category) | 2,037 (40.4%) | 3,009 (59.6%) |
| Total (Overall) | 15,902 (50.1%) | 15,860 (49.9%) |
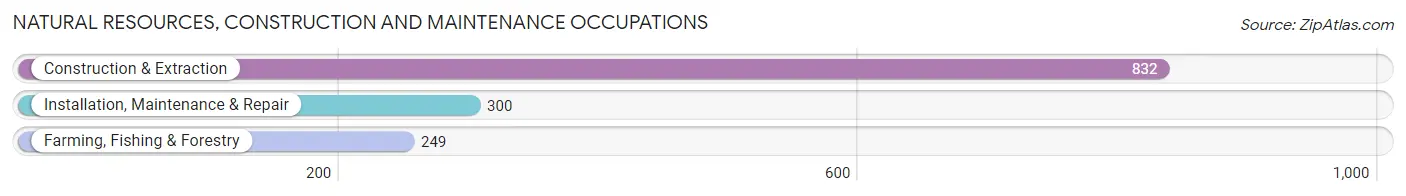
Natural Resources, Construction and Maintenance Occupations
The most common Natural Resources, Construction and Maintenance occupations in Santa Cruz are Construction & Extraction (832 | 2.6%), Installation, Maintenance & Repair (300 | 0.9%), and Farming, Fishing & Forestry (249 | 0.8%).
Natural Resources, Construction and Maintenance Occupations by Sex
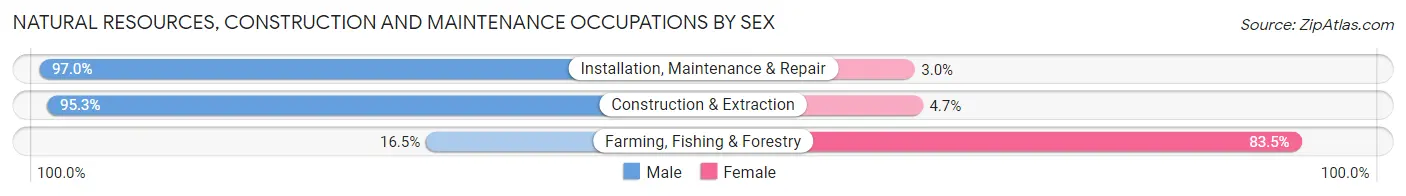
| Occupation | Male | Female |
| Farming, Fishing & Forestry | 41 (16.5%) | 208 (83.5%) |
| Construction & Extraction | 793 (95.3%) | 39 (4.7%) |
| Installation, Maintenance & Repair | 291 (97.0%) | 9 (3.0%) |
| Total (Category) | 1,125 (81.5%) | 256 (18.5%) |
| Total (Overall) | 15,902 (50.1%) | 15,860 (49.9%) |
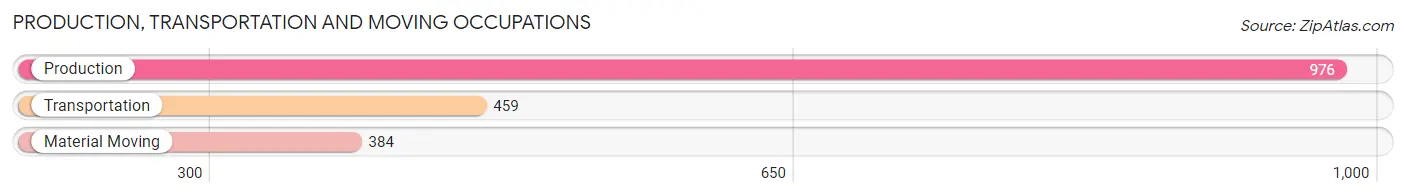
Production, Transportation and Moving Occupations
The most common Production, Transportation and Moving occupations in Santa Cruz are Production (976 | 3.1%), Transportation (459 | 1.5%), and Material Moving (384 | 1.2%).
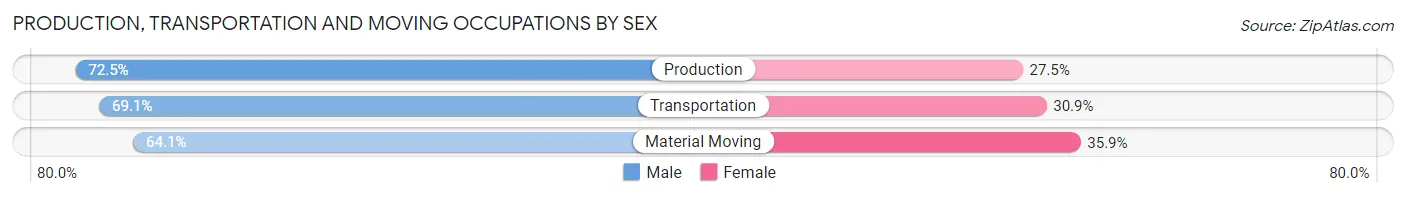
Production, Transportation and Moving Occupations by Sex
| Occupation | Male | Female |
| Production | 708 (72.5%) | 268 (27.5%) |
| Transportation | 317 (69.1%) | 142 (30.9%) |
| Material Moving | 246 (64.1%) | 138 (35.9%) |
| Total (Category) | 1,271 (69.9%) | 548 (30.1%) |
| Total (Overall) | 15,902 (50.1%) | 15,860 (49.9%) |
Employment Industries by Sex in Santa Cruz
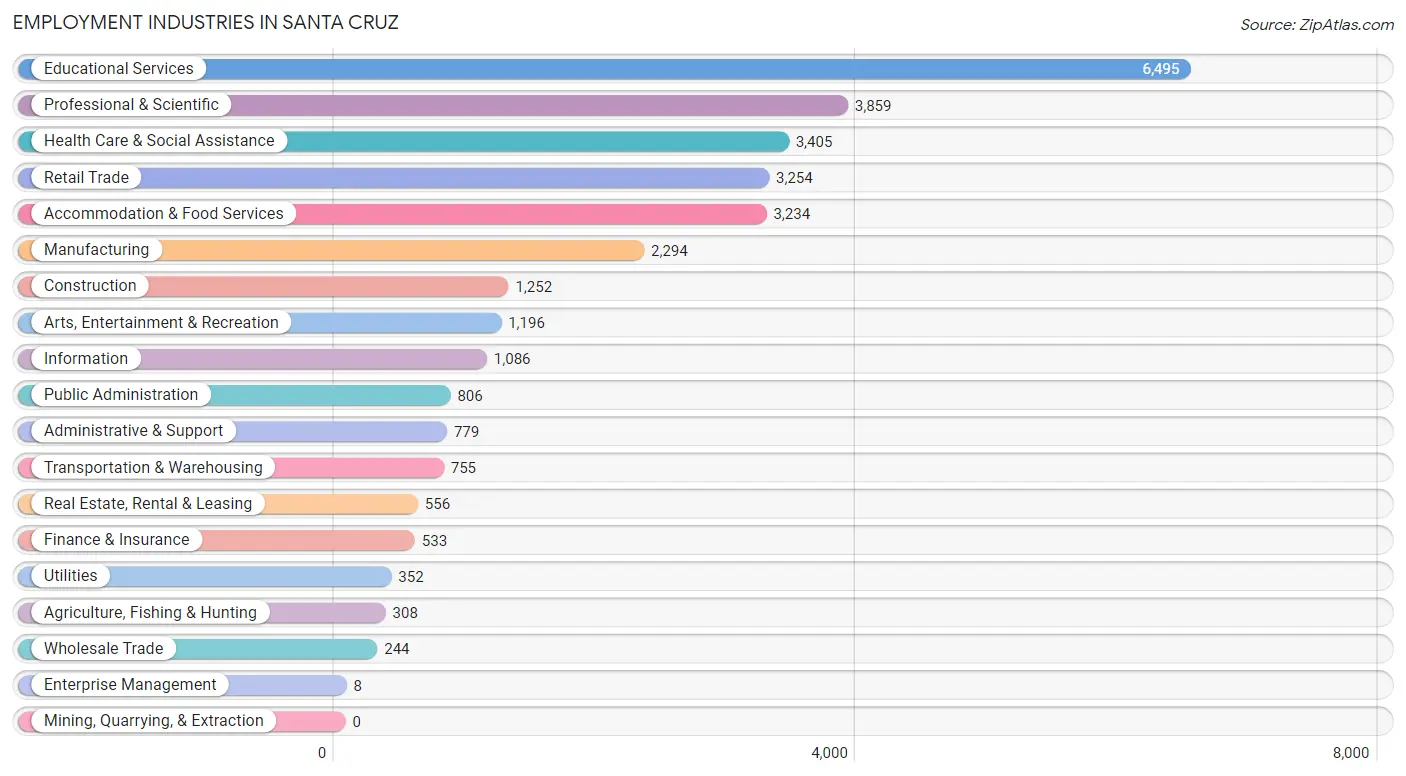
Employment Industries in Santa Cruz
The major employment industries in Santa Cruz include Educational Services (6,495 | 20.4%), Professional & Scientific (3,859 | 12.1%), Health Care & Social Assistance (3,405 | 10.7%), Retail Trade (3,254 | 10.2%), and Accommodation & Food Services (3,234 | 10.2%).
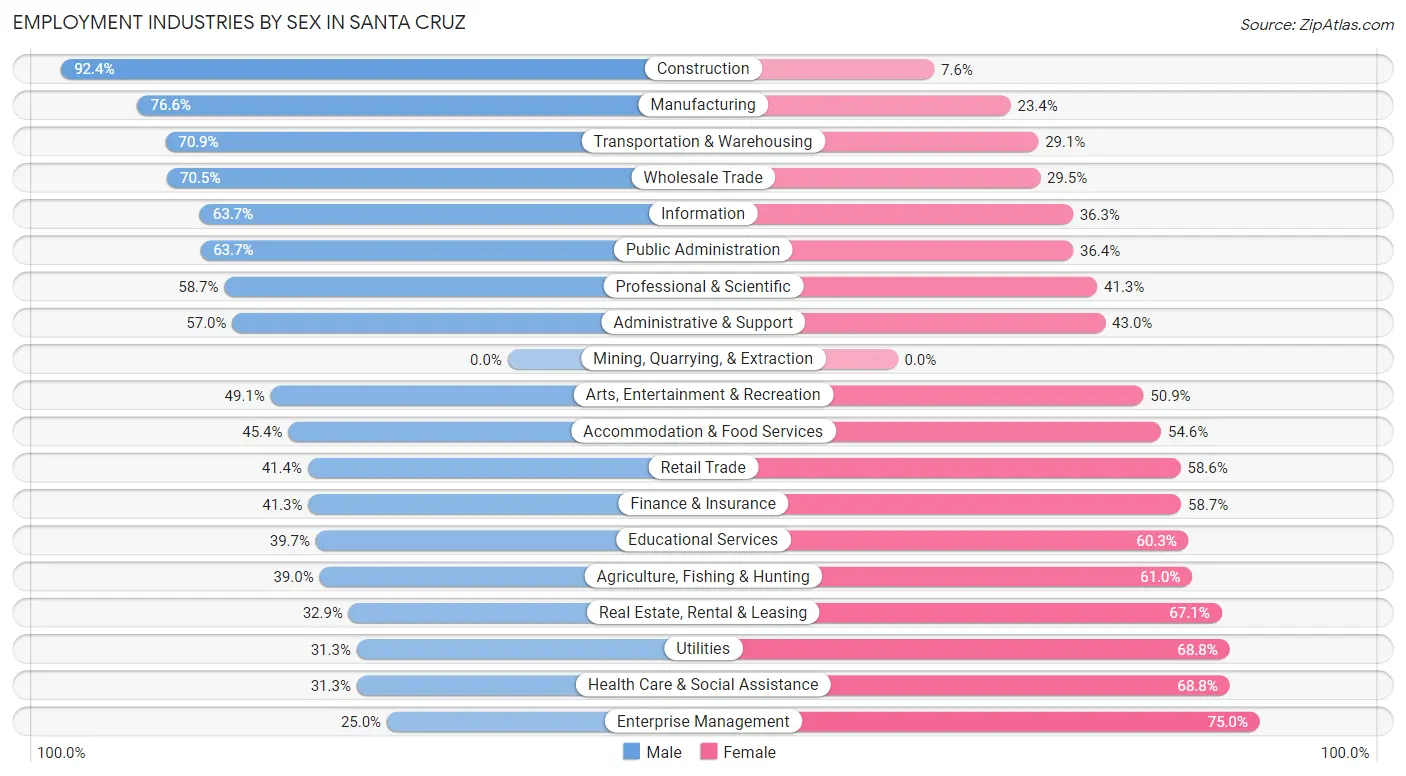
Employment Industries by Sex in Santa Cruz
The Santa Cruz industries that see more men than women are Construction (92.4%), Manufacturing (76.6%), and Transportation & Warehousing (70.9%), whereas the industries that tend to have a higher number of women are Enterprise Management (75.0%), Utilities (68.8%), and Health Care & Social Assistance (68.8%).
| Industry | Male | Female |
| Agriculture, Fishing & Hunting | 120 (39.0%) | 188 (61.0%) |
| Mining, Quarrying, & Extraction | 0 (0.0%) | 0 (0.0%) |
| Construction | 1,157 (92.4%) | 95 (7.6%) |
| Manufacturing | 1,757 (76.6%) | 537 (23.4%) |
| Wholesale Trade | 172 (70.5%) | 72 (29.5%) |
| Retail Trade | 1,347 (41.4%) | 1,907 (58.6%) |
| Transportation & Warehousing | 535 (70.9%) | 220 (29.1%) |
| Utilities | 110 (31.2%) | 242 (68.8%) |
| Information | 692 (63.7%) | 394 (36.3%) |
| Finance & Insurance | 220 (41.3%) | 313 (58.7%) |
| Real Estate, Rental & Leasing | 183 (32.9%) | 373 (67.1%) |
| Professional & Scientific | 2,264 (58.7%) | 1,595 (41.3%) |
| Enterprise Management | 2 (25.0%) | 6 (75.0%) |
| Administrative & Support | 444 (57.0%) | 335 (43.0%) |
| Educational Services | 2,580 (39.7%) | 3,915 (60.3%) |
| Health Care & Social Assistance | 1,064 (31.2%) | 2,341 (68.8%) |
| Arts, Entertainment & Recreation | 587 (49.1%) | 609 (50.9%) |
| Accommodation & Food Services | 1,469 (45.4%) | 1,765 (54.6%) |
| Public Administration | 513 (63.6%) | 293 (36.3%) |
| Total | 15,902 (50.1%) | 15,860 (49.9%) |
Education in Santa Cruz
School Enrollment in Santa Cruz
The most common levels of schooling among the 24,748 students in Santa Cruz are college / undergraduate (16,502 | 66.7%), graduate / professional (2,357 | 9.5%), and high school (1,902 | 7.7%).
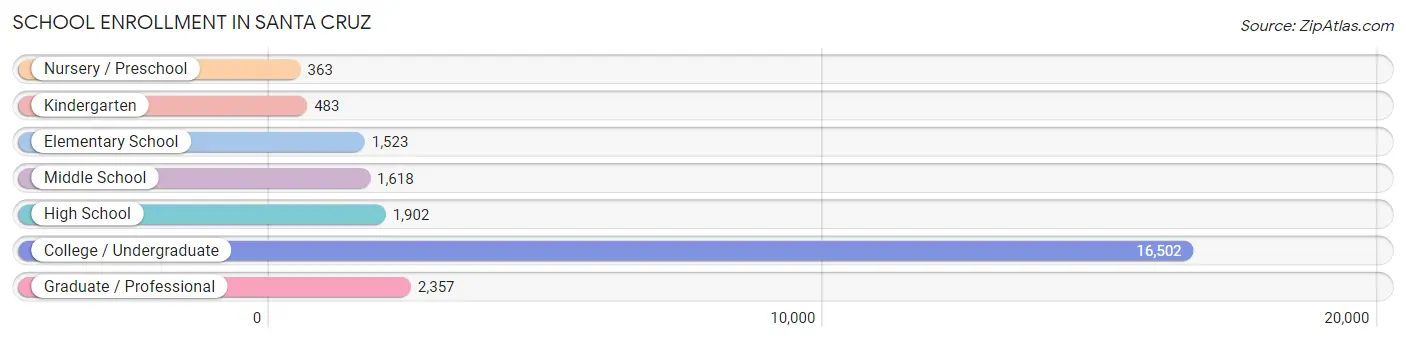
| School Level | # Students | % Students |
| Nursery / Preschool | 363 | 1.5% |
| Kindergarten | 483 | 1.9% |
| Elementary School | 1,523 | 6.1% |
| Middle School | 1,618 | 6.5% |
| High School | 1,902 | 7.7% |
| College / Undergraduate | 16,502 | 66.7% |
| Graduate / Professional | 2,357 | 9.5% |
| Total | 24,748 | 100.0% |
School Enrollment by Age by Funding Source in Santa Cruz
Out of a total of 24,748 students who are enrolled in schools in Santa Cruz, 3,316 (13.4%) attend a private institution, while the remaining 21,432 (86.6%) are enrolled in public schools. The age group of 3 to 4 year olds has the highest likelihood of being enrolled in private schools, with 137 (59.1% in the age bracket) enrolled. Conversely, the age group of 18 to 19 year olds has the lowest likelihood of being enrolled in a private school, with 5,747 (89.7% in the age bracket) attending a public institution.
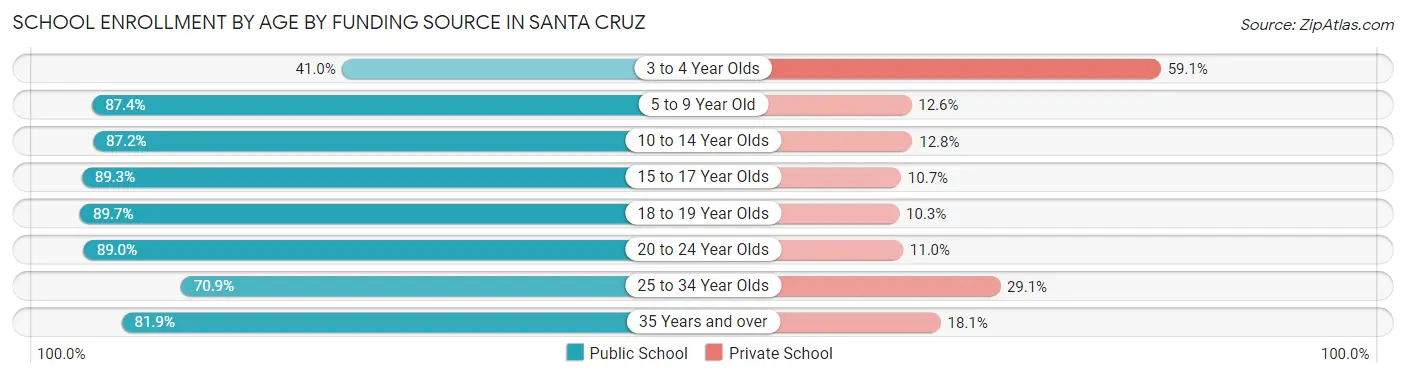
| Age Bracket | Public School | Private School |
| 3 to 4 Year Olds | 95 (40.9%) | 137 (59.1%) |
| 5 to 9 Year Old | 1,803 (87.4%) | 260 (12.6%) |
| 10 to 14 Year Olds | 1,699 (87.2%) | 249 (12.8%) |
| 15 to 17 Year Olds | 1,400 (89.3%) | 167 (10.7%) |
| 18 to 19 Year Olds | 5,747 (89.7%) | 662 (10.3%) |
| 20 to 24 Year Olds | 8,382 (89.0%) | 1,039 (11.0%) |
| 25 to 34 Year Olds | 1,473 (70.9%) | 605 (29.1%) |
| 35 Years and over | 844 (81.9%) | 186 (18.1%) |
| Total | 21,432 (86.6%) | 3,316 (13.4%) |
Educational Attainment by Field of Study in Santa Cruz
Social sciences (3,423 | 15.6%), bio, nature & agricultural (2,342 | 10.7%), business (1,867 | 8.5%), computers & mathematics (1,846 | 8.4%), and literature & languages (1,715 | 7.8%) are the most common fields of study among 21,905 individuals in Santa Cruz who have obtained a bachelor's degree or higher.
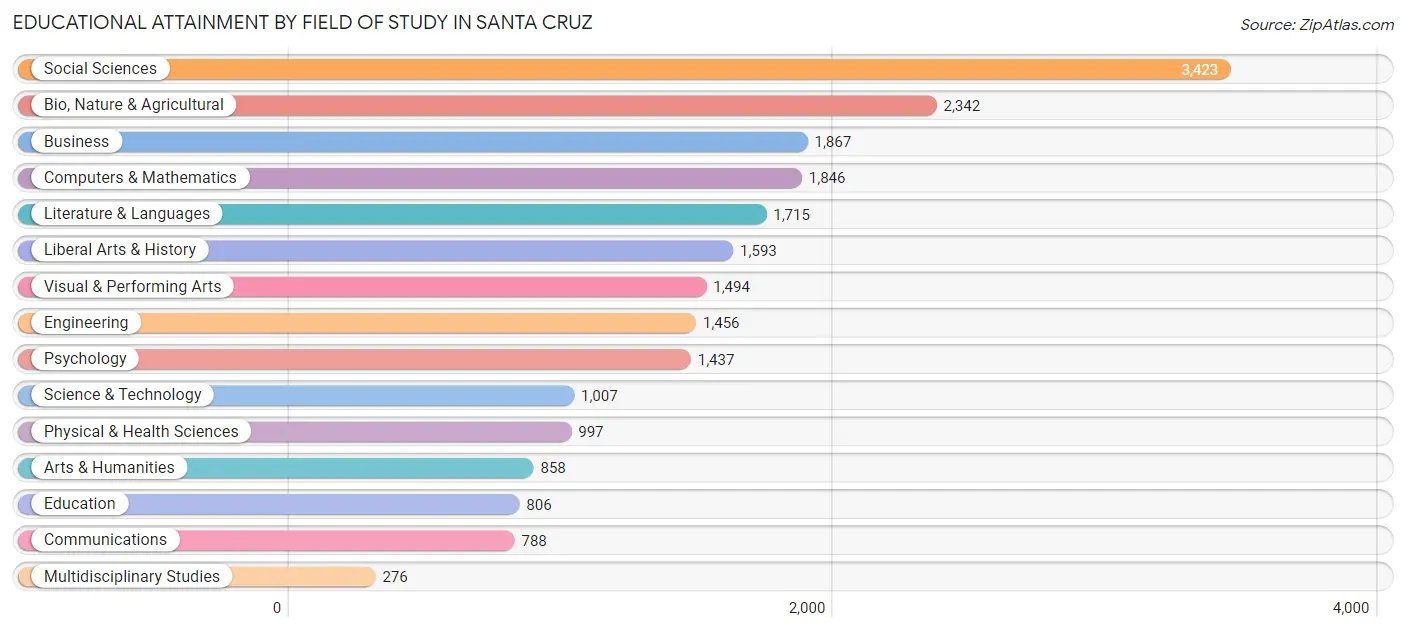
| Field of Study | # Graduates | % Graduates |
| Computers & Mathematics | 1,846 | 8.4% |
| Bio, Nature & Agricultural | 2,342 | 10.7% |
| Physical & Health Sciences | 997 | 4.5% |
| Psychology | 1,437 | 6.6% |
| Social Sciences | 3,423 | 15.6% |
| Engineering | 1,456 | 6.7% |
| Multidisciplinary Studies | 276 | 1.3% |
| Science & Technology | 1,007 | 4.6% |
| Business | 1,867 | 8.5% |
| Education | 806 | 3.7% |
| Literature & Languages | 1,715 | 7.8% |
| Liberal Arts & History | 1,593 | 7.3% |
| Visual & Performing Arts | 1,494 | 6.8% |
| Communications | 788 | 3.6% |
| Arts & Humanities | 858 | 3.9% |
| Total | 21,905 | 100.0% |
Transportation & Commute in Santa Cruz
Vehicle Availability by Sex in Santa Cruz
The most prevalent vehicle ownership categories in Santa Cruz are males with 2 vehicles (5,537, accounting for 38.9%) and females with 2 vehicles (5,314, making up 41.9%).
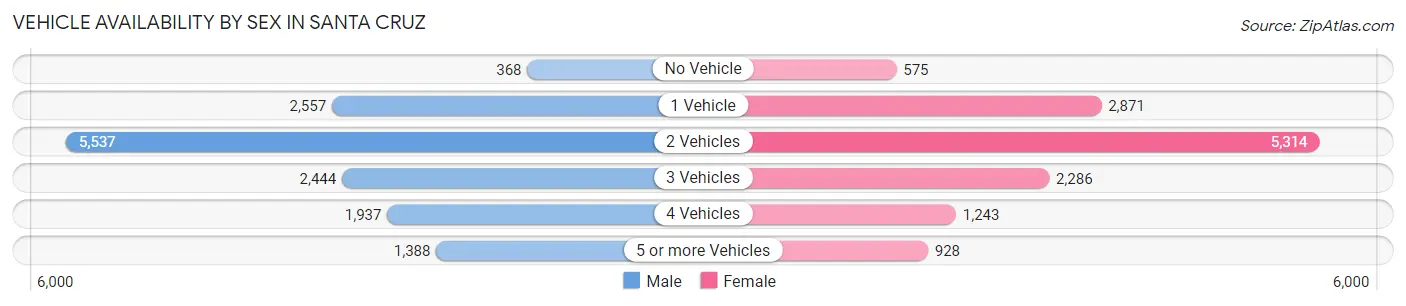
| Vehicles Available | Male | Female |
| No Vehicle | 368 (2.6%) | 575 (4.3%) |
| 1 Vehicle | 2,557 (18.0%) | 2,871 (21.7%) |
| 2 Vehicles | 5,537 (38.9%) | 5,314 (40.2%) |
| 3 Vehicles | 2,444 (17.2%) | 2,286 (17.3%) |
| 4 Vehicles | 1,937 (13.6%) | 1,243 (9.4%) |
| 5 or more Vehicles | 1,388 (9.8%) | 928 (7.0%) |
| Total | 14,231 (100.0%) | 13,217 (100.0%) |
Commute Time in Santa Cruz
The most frequently occuring commute durations in Santa Cruz are 10 to 14 minutes (6,115 commuters, 24.6%), 15 to 19 minutes (4,155 commuters, 16.7%), and 5 to 9 minutes (3,937 commuters, 15.8%).
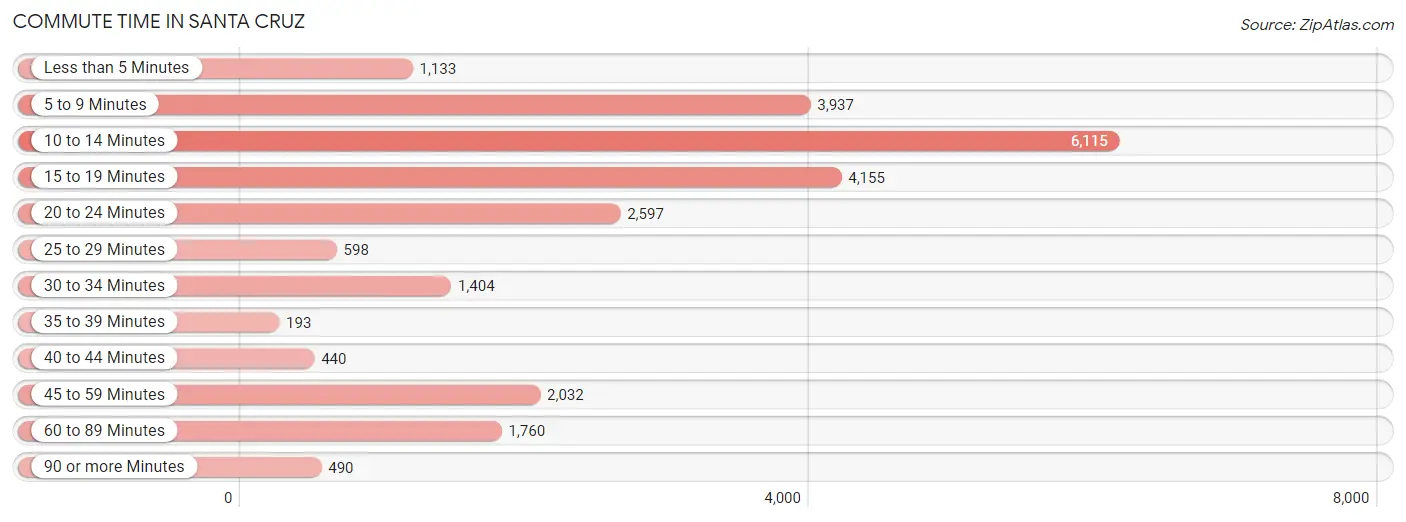
| Commute Time | # Commuters | % Commuters |
| Less than 5 Minutes | 1,133 | 4.6% |
| 5 to 9 Minutes | 3,937 | 15.8% |
| 10 to 14 Minutes | 6,115 | 24.6% |
| 15 to 19 Minutes | 4,155 | 16.7% |
| 20 to 24 Minutes | 2,597 | 10.4% |
| 25 to 29 Minutes | 598 | 2.4% |
| 30 to 34 Minutes | 1,404 | 5.7% |
| 35 to 39 Minutes | 193 | 0.8% |
| 40 to 44 Minutes | 440 | 1.8% |
| 45 to 59 Minutes | 2,032 | 8.2% |
| 60 to 89 Minutes | 1,760 | 7.1% |
| 90 or more Minutes | 490 | 2.0% |
Commute Time by Sex in Santa Cruz
The most common commute times in Santa Cruz are 10 to 14 minutes (3,162 commuters, 25.4%) for males and 10 to 14 minutes (2,953 commuters, 23.8%) for females.
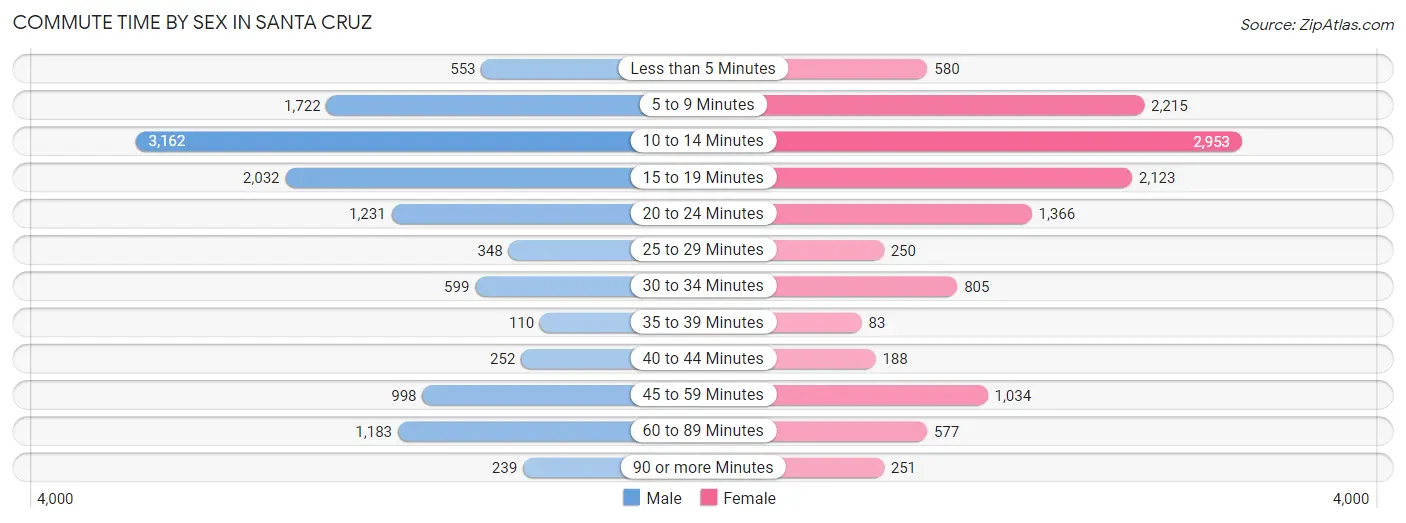
| Commute Time | Male | Female |
| Less than 5 Minutes | 553 (4.4%) | 580 (4.7%) |
| 5 to 9 Minutes | 1,722 (13.9%) | 2,215 (17.8%) |
| 10 to 14 Minutes | 3,162 (25.4%) | 2,953 (23.8%) |
| 15 to 19 Minutes | 2,032 (16.4%) | 2,123 (17.1%) |
| 20 to 24 Minutes | 1,231 (9.9%) | 1,366 (11.0%) |
| 25 to 29 Minutes | 348 (2.8%) | 250 (2.0%) |
| 30 to 34 Minutes | 599 (4.8%) | 805 (6.5%) |
| 35 to 39 Minutes | 110 (0.9%) | 83 (0.7%) |
| 40 to 44 Minutes | 252 (2.0%) | 188 (1.5%) |
| 45 to 59 Minutes | 998 (8.0%) | 1,034 (8.3%) |
| 60 to 89 Minutes | 1,183 (9.5%) | 577 (4.6%) |
| 90 or more Minutes | 239 (1.9%) | 251 (2.0%) |
Time of Departure to Work by Sex in Santa Cruz
The most frequent times of departure to work in Santa Cruz are 8:00 AM to 8:29 AM (1,888, 15.2%) for males and 8:00 AM to 8:29 AM (2,084, 16.8%) for females.
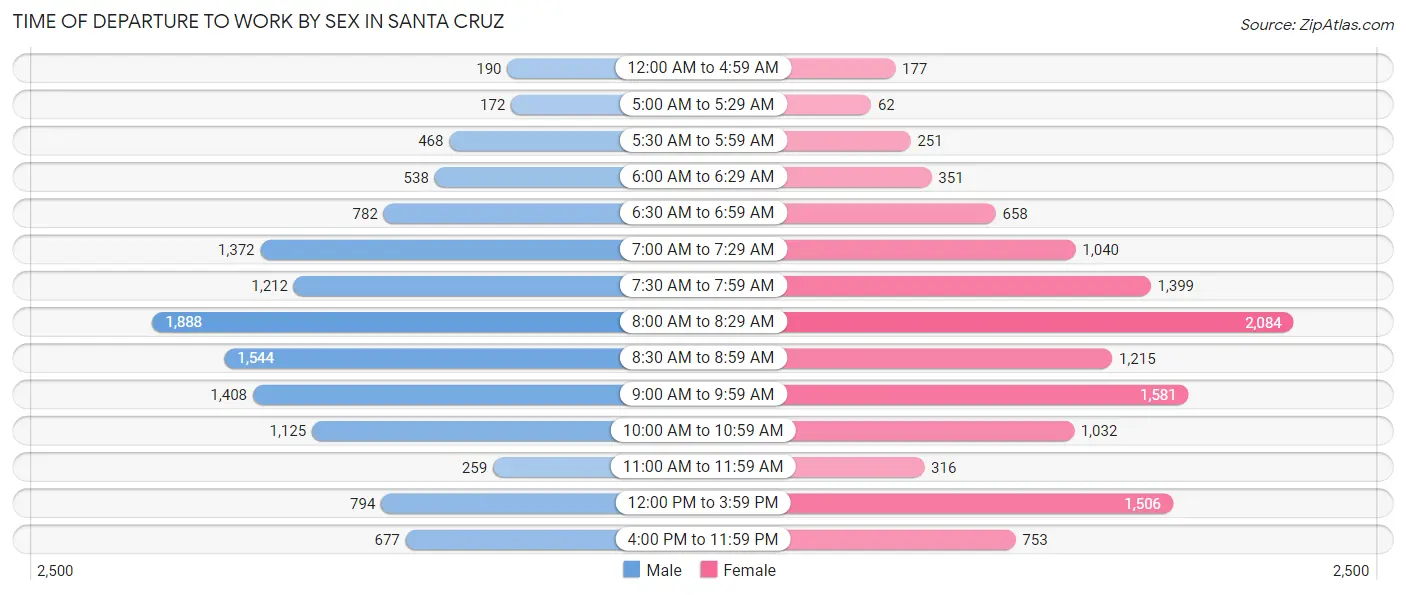
| Time of Departure | Male | Female |
| 12:00 AM to 4:59 AM | 190 (1.5%) | 177 (1.4%) |
| 5:00 AM to 5:29 AM | 172 (1.4%) | 62 (0.5%) |
| 5:30 AM to 5:59 AM | 468 (3.8%) | 251 (2.0%) |
| 6:00 AM to 6:29 AM | 538 (4.3%) | 351 (2.8%) |
| 6:30 AM to 6:59 AM | 782 (6.3%) | 658 (5.3%) |
| 7:00 AM to 7:29 AM | 1,372 (11.0%) | 1,040 (8.4%) |
| 7:30 AM to 7:59 AM | 1,212 (9.8%) | 1,399 (11.3%) |
| 8:00 AM to 8:29 AM | 1,888 (15.2%) | 2,084 (16.8%) |
| 8:30 AM to 8:59 AM | 1,544 (12.4%) | 1,215 (9.8%) |
| 9:00 AM to 9:59 AM | 1,408 (11.3%) | 1,581 (12.7%) |
| 10:00 AM to 10:59 AM | 1,125 (9.0%) | 1,032 (8.3%) |
| 11:00 AM to 11:59 AM | 259 (2.1%) | 316 (2.5%) |
| 12:00 PM to 3:59 PM | 794 (6.4%) | 1,506 (12.1%) |
| 4:00 PM to 11:59 PM | 677 (5.4%) | 753 (6.1%) |
| Total | 12,429 (100.0%) | 12,425 (100.0%) |
Housing Occupancy in Santa Cruz
Occupancy by Ownership in Santa Cruz
Of the total 21,594 dwellings in Santa Cruz, owner-occupied units account for 10,157 (47.0%), while renter-occupied units make up 11,437 (53.0%).
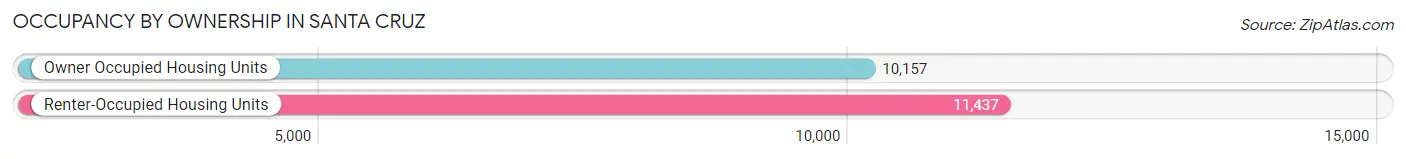
| Occupancy | # Housing Units | % Housing Units |
| Owner Occupied Housing Units | 10,157 | 47.0% |
| Renter-Occupied Housing Units | 11,437 | 53.0% |
| Total Occupied Housing Units | 21,594 | 100.0% |
Occupancy by Household Size in Santa Cruz
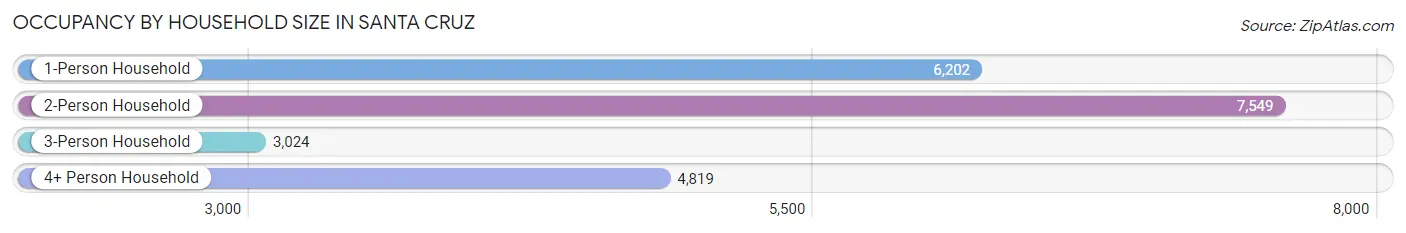
| Household Size | # Housing Units | % Housing Units |
| 1-Person Household | 6,202 | 28.7% |
| 2-Person Household | 7,549 | 35.0% |
| 3-Person Household | 3,024 | 14.0% |
| 4+ Person Household | 4,819 | 22.3% |
| Total Housing Units | 21,594 | 100.0% |
Occupancy by Ownership by Household Size in Santa Cruz
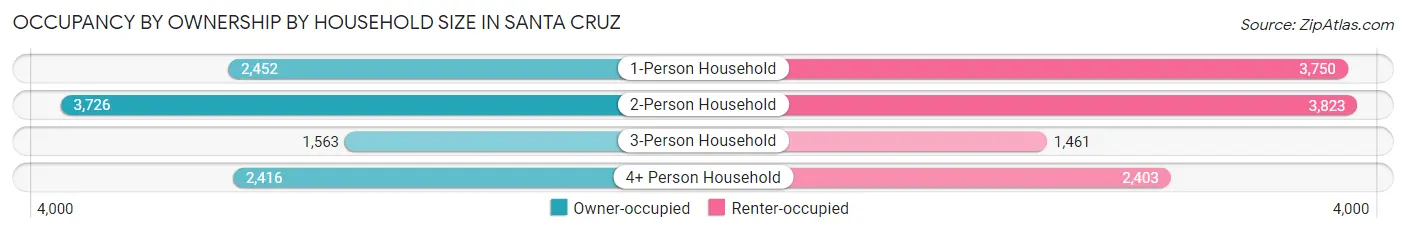
| Household Size | Owner-occupied | Renter-occupied |
| 1-Person Household | 2,452 (39.5%) | 3,750 (60.5%) |
| 2-Person Household | 3,726 (49.4%) | 3,823 (50.6%) |
| 3-Person Household | 1,563 (51.7%) | 1,461 (48.3%) |
| 4+ Person Household | 2,416 (50.1%) | 2,403 (49.9%) |
| Total Housing Units | 10,157 (47.0%) | 11,437 (53.0%) |
Occupancy by Educational Attainment in Santa Cruz
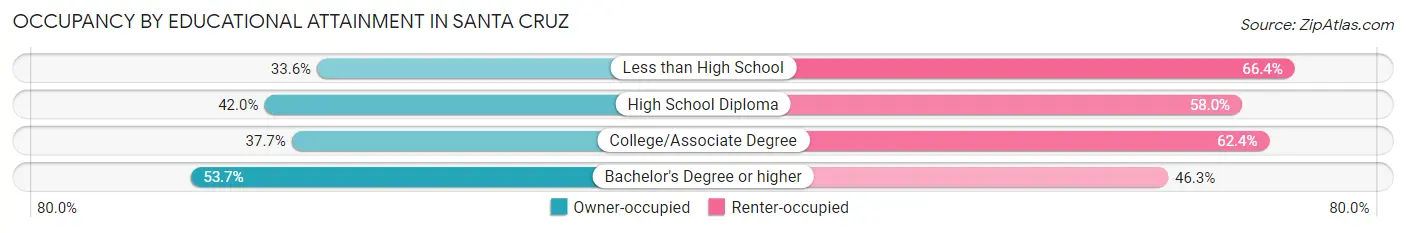
| Household Size | Owner-occupied | Renter-occupied |
| Less than High School | 216 (33.6%) | 426 (66.4%) |
| High School Diploma | 757 (42.0%) | 1,046 (58.0%) |
| College/Associate Degree | 2,581 (37.7%) | 4,274 (62.4%) |
| Bachelor's Degree or higher | 6,603 (53.7%) | 5,691 (46.3%) |
Occupancy by Age of Householder in Santa Cruz
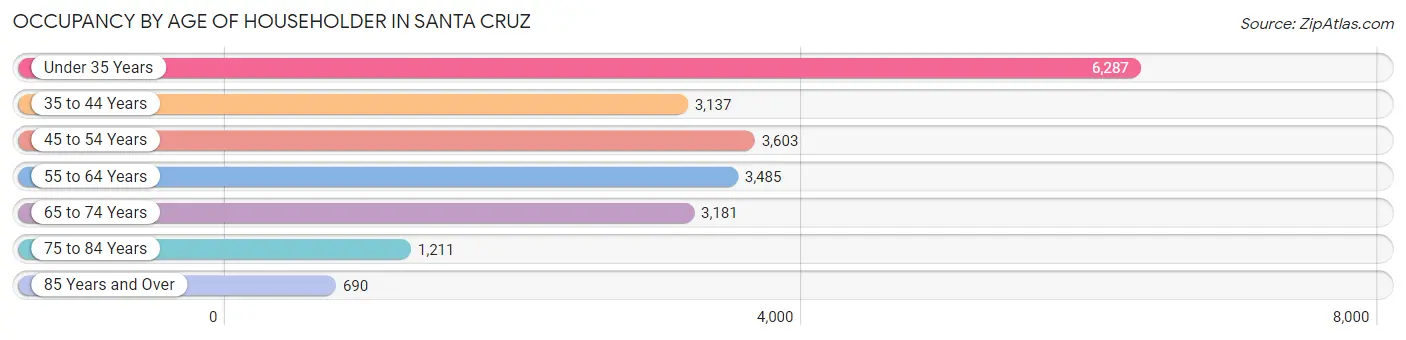
| Age Bracket | # Households | % Households |
| Under 35 Years | 6,287 | 29.1% |
| 35 to 44 Years | 3,137 | 14.5% |
| 45 to 54 Years | 3,603 | 16.7% |
| 55 to 64 Years | 3,485 | 16.1% |
| 65 to 74 Years | 3,181 | 14.7% |
| 75 to 84 Years | 1,211 | 5.6% |
| 85 Years and Over | 690 | 3.2% |
| Total | 21,594 | 100.0% |
Housing Finances in Santa Cruz
Median Income by Occupancy in Santa Cruz
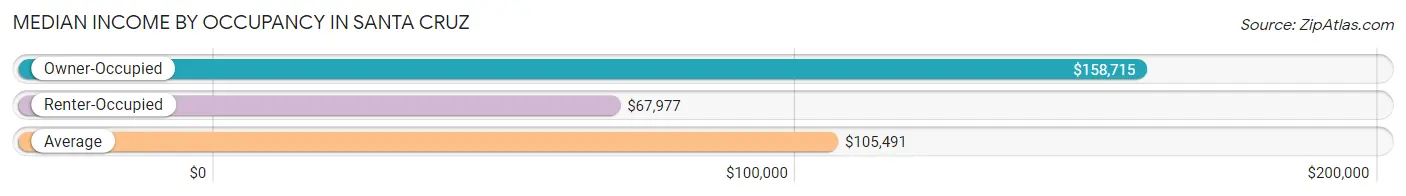
| Occupancy Type | # Households | Median Income |
| Owner-Occupied | 10,157 (47.0%) | $158,715 |
| Renter-Occupied | 11,437 (53.0%) | $67,977 |
| Average | 21,594 (100.0%) | $105,491 |
Occupancy by Householder Income Bracket in Santa Cruz
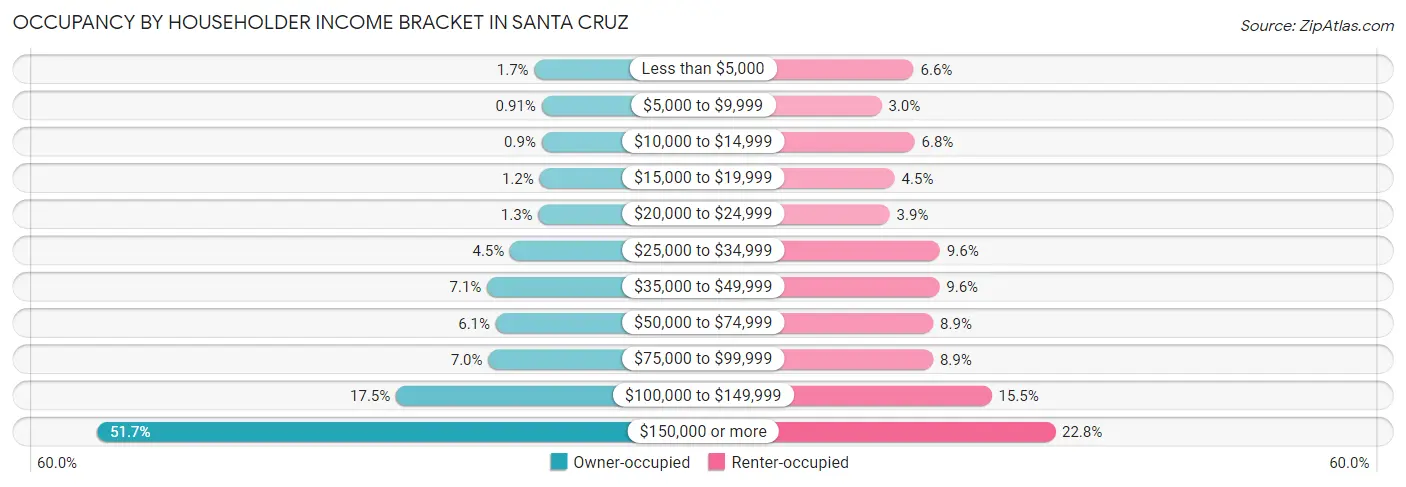
| Income Bracket | Owner-occupied | Renter-occupied |
| Less than $5,000 | 176 (1.7%) | 758 (6.6%) |
| $5,000 to $9,999 | 92 (0.9%) | 339 (3.0%) |
| $10,000 to $14,999 | 91 (0.9%) | 772 (6.8%) |
| $15,000 to $19,999 | 117 (1.1%) | 511 (4.5%) |
| $20,000 to $24,999 | 130 (1.3%) | 446 (3.9%) |
| $25,000 to $34,999 | 458 (4.5%) | 1,103 (9.6%) |
| $35,000 to $49,999 | 724 (7.1%) | 1,096 (9.6%) |
| $50,000 to $74,999 | 624 (6.1%) | 1,015 (8.9%) |
| $75,000 to $99,999 | 711 (7.0%) | 1,012 (8.8%) |
| $100,000 to $149,999 | 1,782 (17.5%) | 1,777 (15.5%) |
| $150,000 or more | 5,252 (51.7%) | 2,608 (22.8%) |
| Total | 10,157 (100.0%) | 11,437 (100.0%) |
Monthly Housing Cost Tiers in Santa Cruz
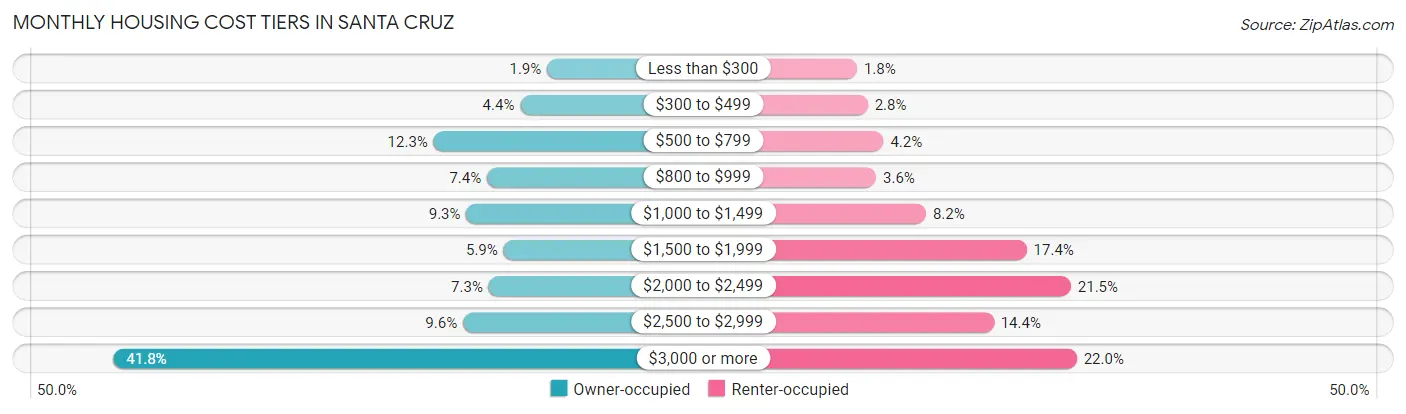
| Monthly Cost | Owner-occupied | Renter-occupied |
| Less than $300 | 193 (1.9%) | 206 (1.8%) |
| $300 to $499 | 444 (4.4%) | 319 (2.8%) |
| $500 to $799 | 1,253 (12.3%) | 485 (4.2%) |
| $800 to $999 | 755 (7.4%) | 407 (3.6%) |
| $1,000 to $1,499 | 948 (9.3%) | 932 (8.2%) |
| $1,500 to $1,999 | 599 (5.9%) | 1,992 (17.4%) |
| $2,000 to $2,499 | 738 (7.3%) | 2,458 (21.5%) |
| $2,500 to $2,999 | 979 (9.6%) | 1,646 (14.4%) |
| $3,000 or more | 4,248 (41.8%) | 2,519 (22.0%) |
| Total | 10,157 (100.0%) | 11,437 (100.0%) |
Physical Housing Characteristics in Santa Cruz
Housing Structures in Santa Cruz
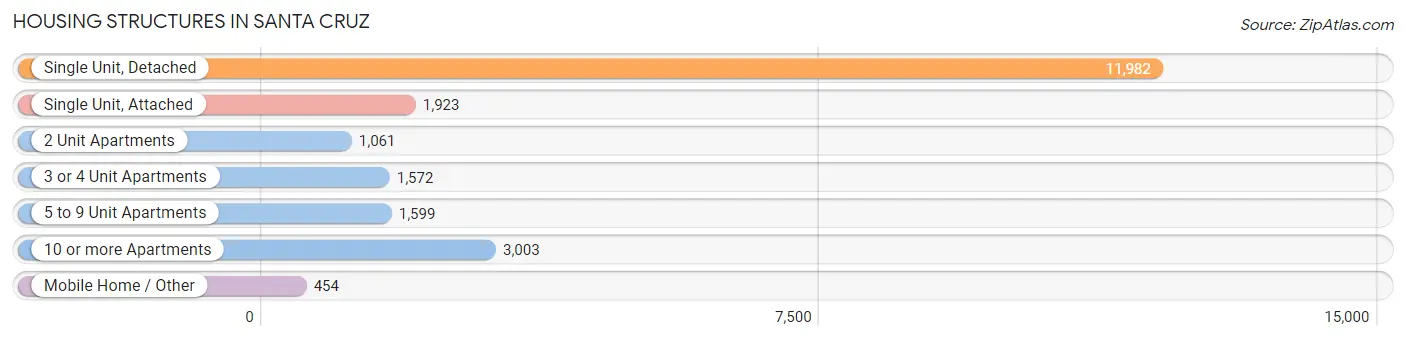
| Structure Type | # Housing Units | % Housing Units |
| Single Unit, Detached | 11,982 | 55.5% |
| Single Unit, Attached | 1,923 | 8.9% |
| 2 Unit Apartments | 1,061 | 4.9% |
| 3 or 4 Unit Apartments | 1,572 | 7.3% |
| 5 to 9 Unit Apartments | 1,599 | 7.4% |
| 10 or more Apartments | 3,003 | 13.9% |
| Mobile Home / Other | 454 | 2.1% |
| Total | 21,594 | 100.0% |
Housing Structures by Occupancy in Santa Cruz
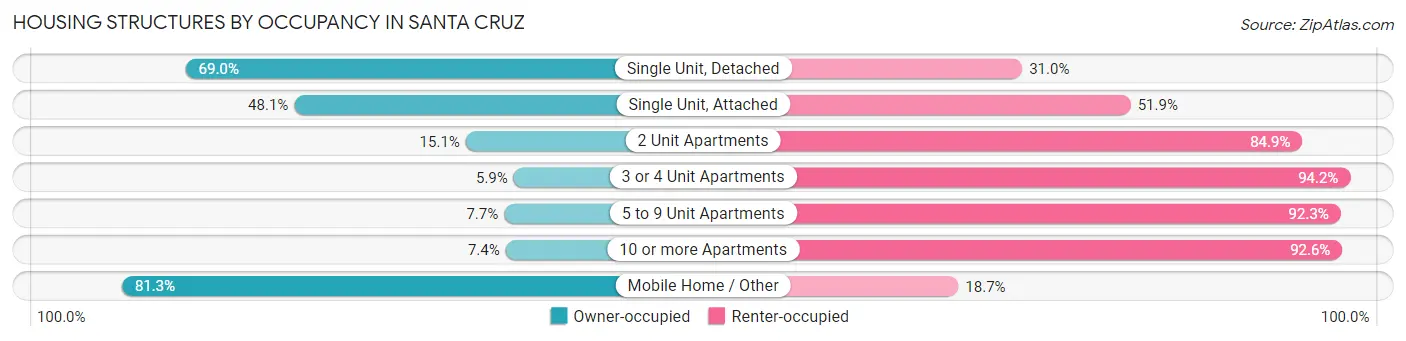
| Structure Type | Owner-occupied | Renter-occupied |
| Single Unit, Detached | 8,266 (69.0%) | 3,716 (31.0%) |
| Single Unit, Attached | 925 (48.1%) | 998 (51.9%) |
| 2 Unit Apartments | 160 (15.1%) | 901 (84.9%) |
| 3 or 4 Unit Apartments | 92 (5.9%) | 1,480 (94.2%) |
| 5 to 9 Unit Apartments | 123 (7.7%) | 1,476 (92.3%) |
| 10 or more Apartments | 222 (7.4%) | 2,781 (92.6%) |
| Mobile Home / Other | 369 (81.3%) | 85 (18.7%) |
| Total | 10,157 (47.0%) | 11,437 (53.0%) |
Housing Structures by Number of Rooms in Santa Cruz
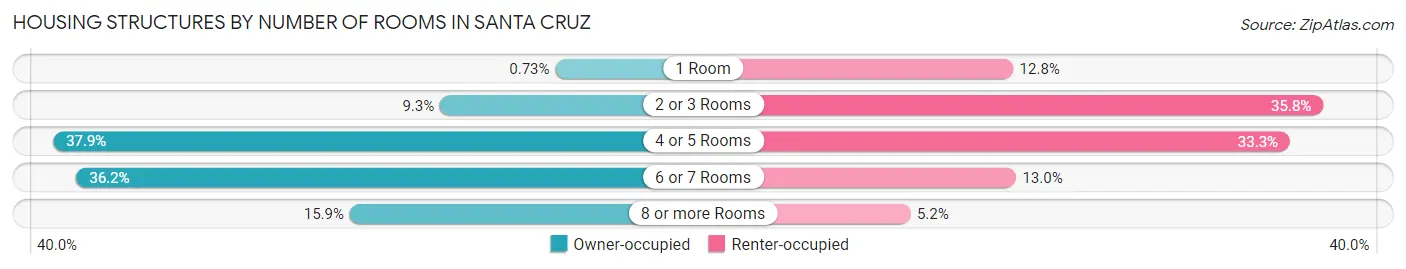
| Number of Rooms | Owner-occupied | Renter-occupied |
| 1 Room | 74 (0.7%) | 1,462 (12.8%) |
| 2 or 3 Rooms | 941 (9.3%) | 4,089 (35.7%) |
| 4 or 5 Rooms | 3,849 (37.9%) | 3,807 (33.3%) |
| 6 or 7 Rooms | 3,674 (36.2%) | 1,486 (13.0%) |
| 8 or more Rooms | 1,619 (15.9%) | 593 (5.2%) |
| Total | 10,157 (100.0%) | 11,437 (100.0%) |
Housing Structure by Heating Type in Santa Cruz
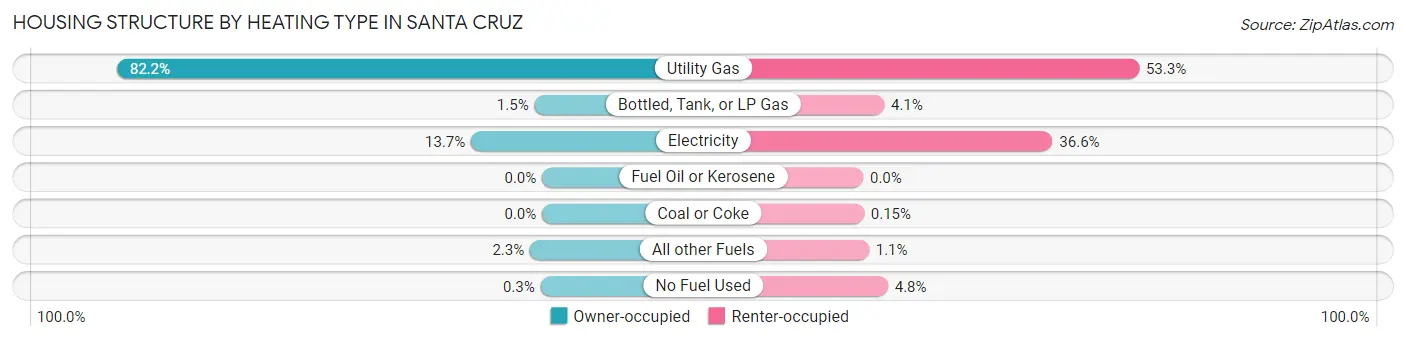
| Heating Type | Owner-occupied | Renter-occupied |
| Utility Gas | 8,347 (82.2%) | 6,098 (53.3%) |
| Bottled, Tank, or LP Gas | 149 (1.5%) | 463 (4.1%) |
| Electricity | 1,394 (13.7%) | 4,185 (36.6%) |
| Fuel Oil or Kerosene | 0 (0.0%) | 0 (0.0%) |
| Coal or Coke | 0 (0.0%) | 17 (0.2%) |
| All other Fuels | 237 (2.3%) | 127 (1.1%) |
| No Fuel Used | 30 (0.3%) | 547 (4.8%) |
| Total | 10,157 (100.0%) | 11,437 (100.0%) |
Household Vehicle Usage in Santa Cruz
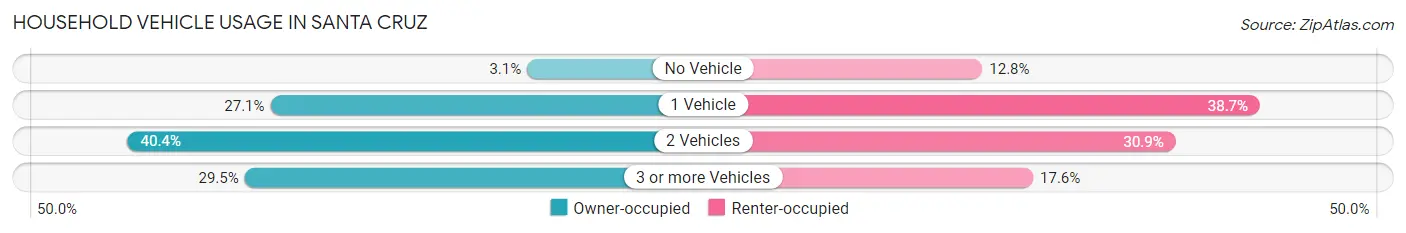
| Vehicles per Household | Owner-occupied | Renter-occupied |
| No Vehicle | 315 (3.1%) | 1,467 (12.8%) |
| 1 Vehicle | 2,748 (27.1%) | 4,430 (38.7%) |
| 2 Vehicles | 4,101 (40.4%) | 3,530 (30.9%) |
| 3 or more Vehicles | 2,993 (29.5%) | 2,010 (17.6%) |
| Total | 10,157 (100.0%) | 11,437 (100.0%) |
Real Estate & Mortgages in Santa Cruz
Real Estate and Mortgage Overview in Santa Cruz
| Characteristic | Without Mortgage | With Mortgage |
| Housing Units | 3,621 | 6,536 |
| Median Property Value | $1,076,900 | $1,135,600 |
| Median Household Income | $95,536 | $4,278 |
| Monthly Housing Costs | $792 | $4,219 |
| Real Estate Taxes | $3,699 | $55 |
Property Value by Mortgage Status in Santa Cruz
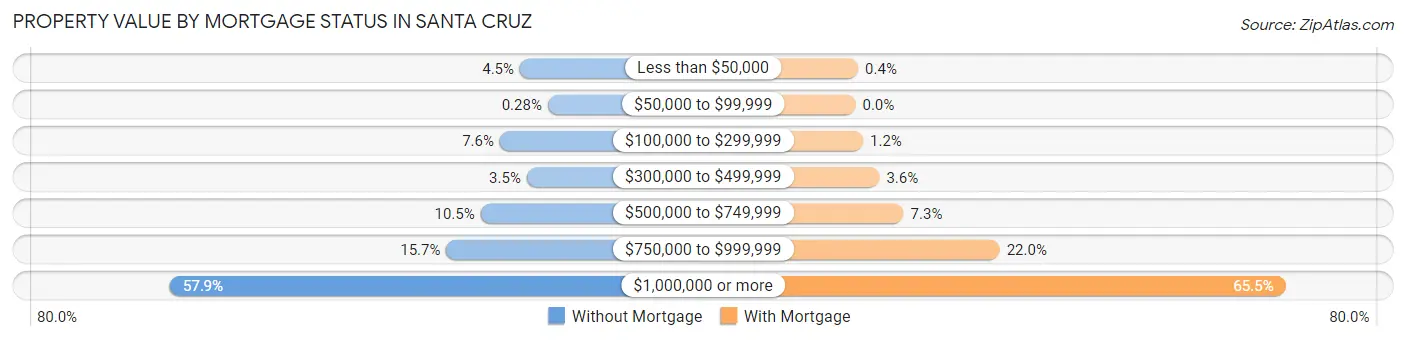
| Property Value | Without Mortgage | With Mortgage |
| Less than $50,000 | 164 (4.5%) | 26 (0.4%) |
| $50,000 to $99,999 | 10 (0.3%) | 0 (0.0%) |
| $100,000 to $299,999 | 275 (7.6%) | 75 (1.1%) |
| $300,000 to $499,999 | 126 (3.5%) | 238 (3.6%) |
| $500,000 to $749,999 | 381 (10.5%) | 479 (7.3%) |
| $750,000 to $999,999 | 570 (15.7%) | 1,436 (22.0%) |
| $1,000,000 or more | 2,095 (57.9%) | 4,282 (65.5%) |
| Total | 3,621 (100.0%) | 6,536 (100.0%) |
Household Income by Mortgage Status in Santa Cruz
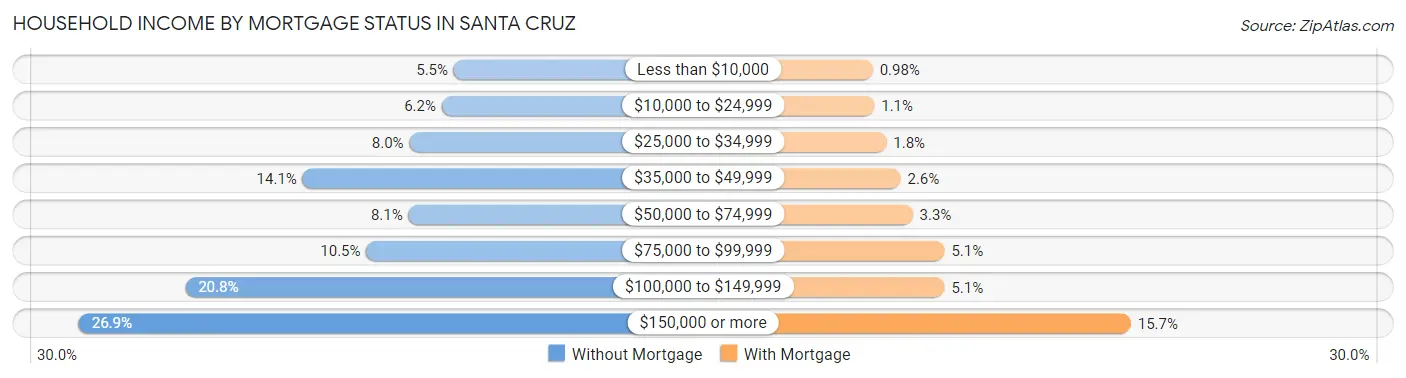
| Household Income | Without Mortgage | With Mortgage |
| Less than $10,000 | 198 (5.5%) | 64 (1.0%) |
| $10,000 to $24,999 | 223 (6.2%) | 70 (1.1%) |
| $25,000 to $34,999 | 290 (8.0%) | 115 (1.8%) |
| $35,000 to $49,999 | 511 (14.1%) | 168 (2.6%) |
| $50,000 to $74,999 | 292 (8.1%) | 213 (3.3%) |
| $75,000 to $99,999 | 379 (10.5%) | 332 (5.1%) |
| $100,000 to $149,999 | 754 (20.8%) | 332 (5.1%) |
| $150,000 or more | 974 (26.9%) | 1,028 (15.7%) |
| Total | 3,621 (100.0%) | 6,536 (100.0%) |
Property Value to Household Income Ratio in Santa Cruz
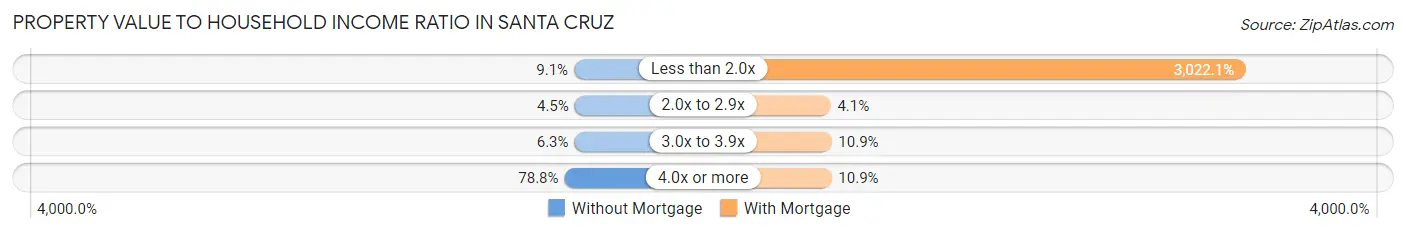
| Value-to-Income Ratio | Without Mortgage | With Mortgage |
| Less than 2.0x | 330 (9.1%) | 197,525 (3,022.1%) |
| 2.0x to 2.9x | 162 (4.5%) | 267 (4.1%) |
| 3.0x to 3.9x | 228 (6.3%) | 713 (10.9%) |
| 4.0x or more | 2,852 (78.8%) | 712 (10.9%) |
| Total | 3,621 (100.0%) | 6,536 (100.0%) |
Real Estate Taxes by Mortgage Status in Santa Cruz
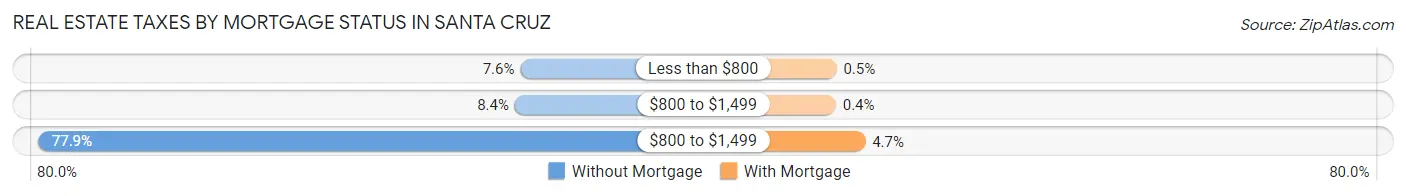
| Property Taxes | Without Mortgage | With Mortgage |
| Less than $800 | 274 (7.6%) | 33 (0.5%) |
| $800 to $1,499 | 303 (8.4%) | 26 (0.4%) |
| $800 to $1,499 | 2,821 (77.9%) | 307 (4.7%) |
| Total | 3,621 (100.0%) | 6,536 (100.0%) |
Health & Disability in Santa Cruz
Health Insurance Coverage by Age in Santa Cruz
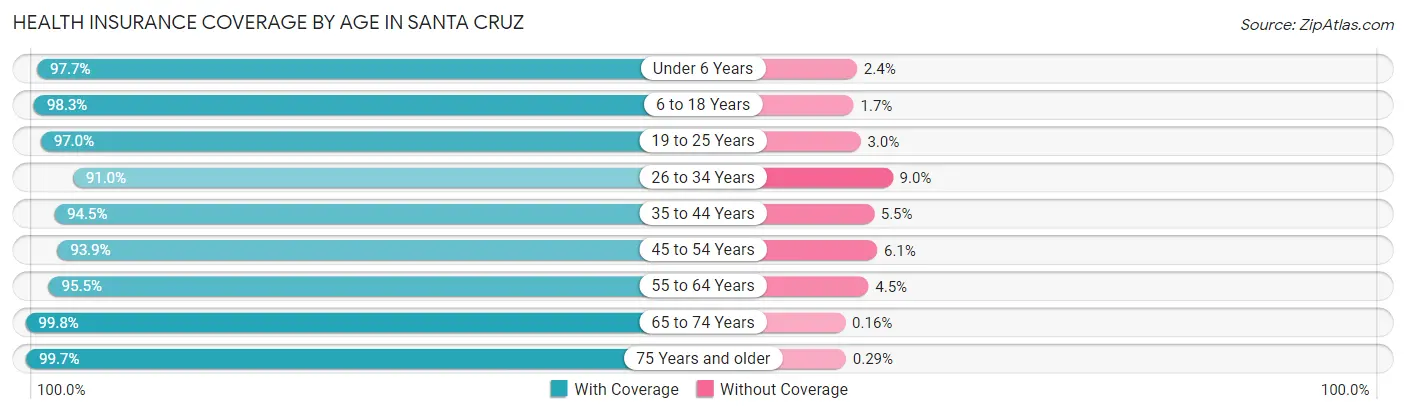
| Age Bracket | With Coverage | Without Coverage |
| Under 6 Years | 2,203 (97.7%) | 53 (2.4%) |
| 6 to 18 Years | 8,430 (98.3%) | 149 (1.7%) |
| 19 to 25 Years | 16,389 (97.0%) | 510 (3.0%) |
| 26 to 34 Years | 5,991 (91.0%) | 593 (9.0%) |
| 35 to 44 Years | 6,084 (94.5%) | 354 (5.5%) |
| 45 to 54 Years | 6,054 (93.9%) | 394 (6.1%) |
| 55 to 64 Years | 5,812 (95.5%) | 273 (4.5%) |
| 65 to 74 Years | 5,015 (99.8%) | 8 (0.2%) |
| 75 Years and older | 2,764 (99.7%) | 8 (0.3%) |
| Total | 58,742 (96.2%) | 2,342 (3.8%) |
Health Insurance Coverage by Citizenship Status in Santa Cruz
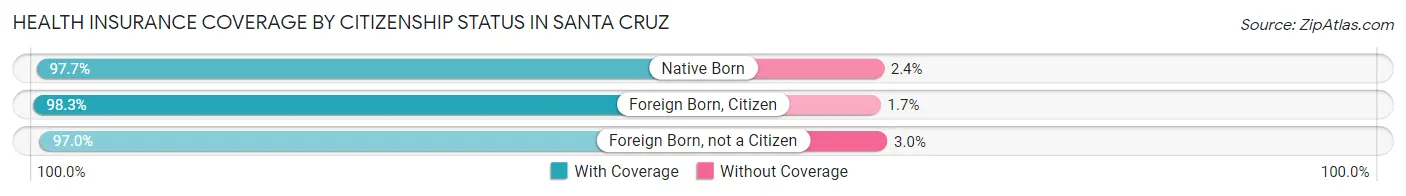
| Citizenship Status | With Coverage | Without Coverage |
| Native Born | 2,203 (97.7%) | 53 (2.4%) |
| Foreign Born, Citizen | 8,430 (98.3%) | 149 (1.7%) |
| Foreign Born, not a Citizen | 16,389 (97.0%) | 510 (3.0%) |
Health Insurance Coverage by Household Income in Santa Cruz
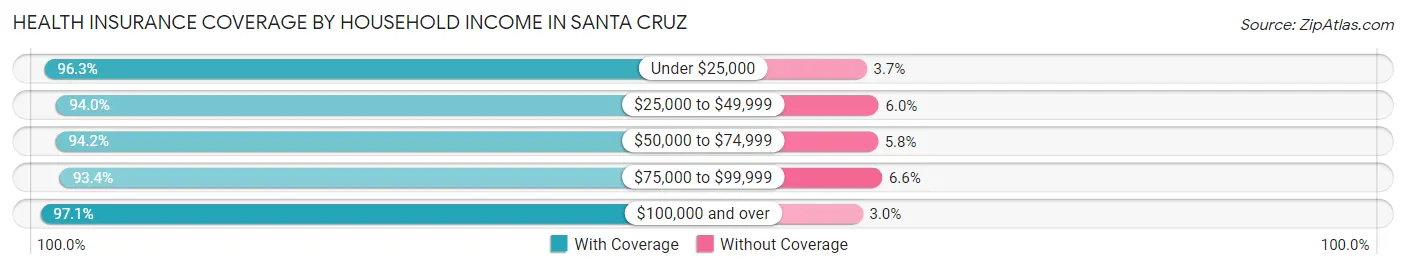
| Household Income | With Coverage | Without Coverage |
| Under $25,000 | 5,673 (96.3%) | 218 (3.7%) |
| $25,000 to $49,999 | 6,102 (94.0%) | 387 (6.0%) |
| $50,000 to $74,999 | 3,123 (94.2%) | 192 (5.8%) |
| $75,000 to $99,999 | 3,528 (93.4%) | 249 (6.6%) |
| $100,000 and over | 30,827 (97.1%) | 938 (2.9%) |
Public vs Private Health Insurance Coverage by Age in Santa Cruz
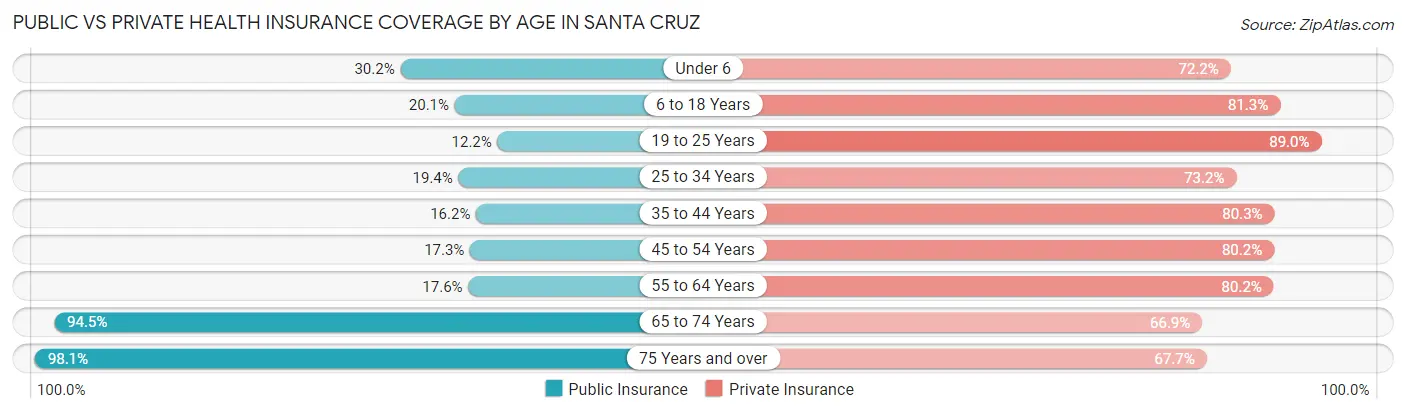
| Age Bracket | Public Insurance | Private Insurance |
| Under 6 | 682 (30.2%) | 1,628 (72.2%) |
| 6 to 18 Years | 1,728 (20.1%) | 6,978 (81.3%) |
| 19 to 25 Years | 2,061 (12.2%) | 15,040 (89.0%) |
| 25 to 34 Years | 1,280 (19.4%) | 4,820 (73.2%) |
| 35 to 44 Years | 1,041 (16.2%) | 5,169 (80.3%) |
| 45 to 54 Years | 1,115 (17.3%) | 5,172 (80.2%) |
| 55 to 64 Years | 1,072 (17.6%) | 4,877 (80.1%) |
| 65 to 74 Years | 4,748 (94.5%) | 3,359 (66.9%) |
| 75 Years and over | 2,719 (98.1%) | 1,877 (67.7%) |
| Total | 16,446 (26.9%) | 48,920 (80.1%) |
Disability Status by Sex by Age in Santa Cruz
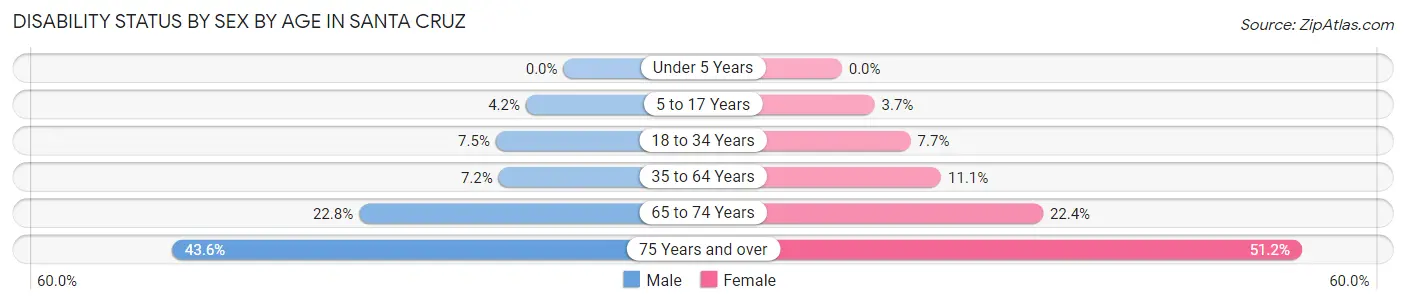
| Age Bracket | Male | Female |
| Under 5 Years | 0 (0.0%) | 0 (0.0%) |
| 5 to 17 Years | 136 (4.2%) | 91 (3.6%) |
| 18 to 34 Years | 986 (7.5%) | 1,047 (7.7%) |
| 35 to 64 Years | 675 (7.2%) | 1,064 (11.1%) |
| 65 to 74 Years | 558 (22.8%) | 576 (22.4%) |
| 75 Years and over | 439 (43.6%) | 904 (51.2%) |
Disability Class by Sex by Age in Santa Cruz
Disability Class: Hearing Difficulty
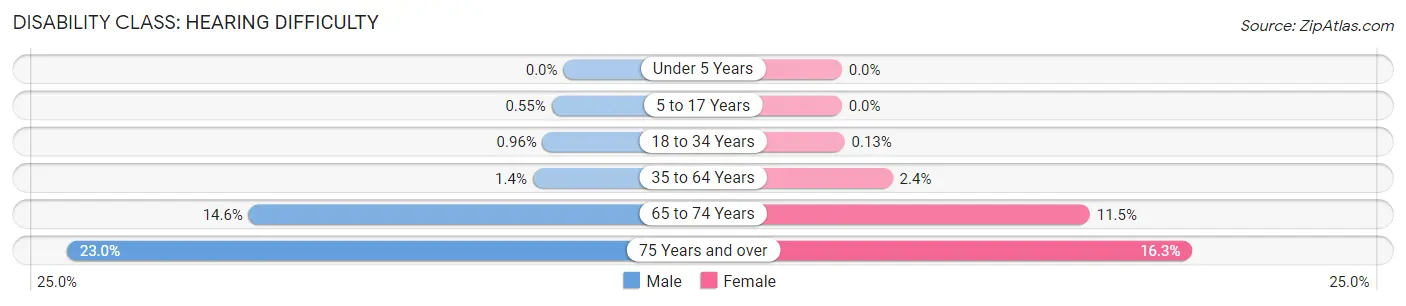
| Age Bracket | Male | Female |
| Under 5 Years | 0 (0.0%) | 0 (0.0%) |
| 5 to 17 Years | 18 (0.5%) | 0 (0.0%) |
| 18 to 34 Years | 126 (1.0%) | 18 (0.1%) |
| 35 to 64 Years | 133 (1.4%) | 227 (2.4%) |
| 65 to 74 Years | 358 (14.6%) | 296 (11.5%) |
| 75 Years and over | 232 (23.0%) | 287 (16.3%) |
Disability Class: Vision Difficulty
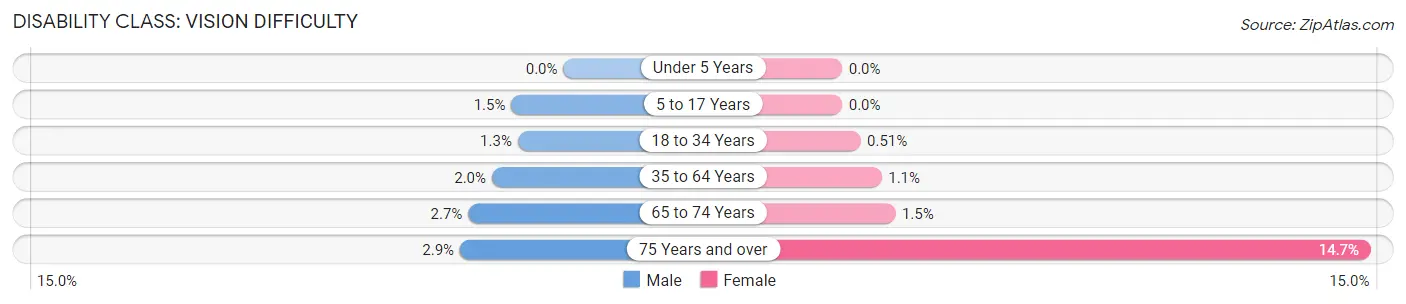
| Age Bracket | Male | Female |
| Under 5 Years | 0 (0.0%) | 0 (0.0%) |
| 5 to 17 Years | 47 (1.5%) | 0 (0.0%) |
| 18 to 34 Years | 166 (1.3%) | 70 (0.5%) |
| 35 to 64 Years | 186 (2.0%) | 106 (1.1%) |
| 65 to 74 Years | 65 (2.6%) | 38 (1.5%) |
| 75 Years and over | 29 (2.9%) | 260 (14.7%) |
Disability Class: Cognitive Difficulty
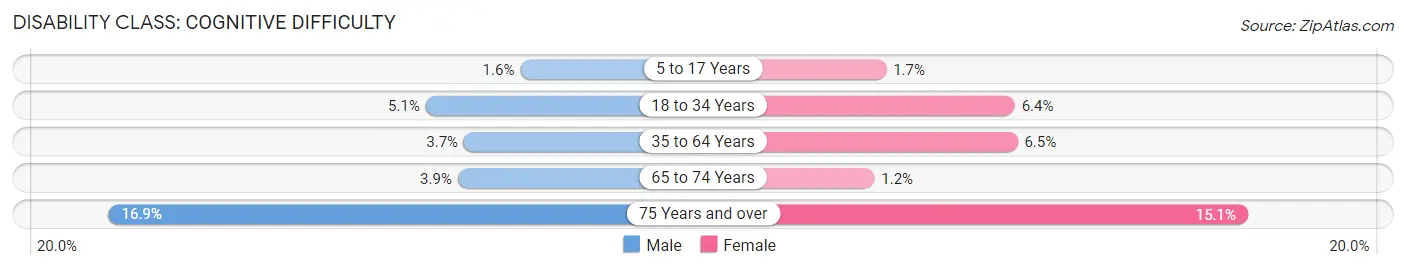
| Age Bracket | Male | Female |
| 5 to 17 Years | 52 (1.6%) | 41 (1.7%) |
| 18 to 34 Years | 669 (5.1%) | 877 (6.4%) |
| 35 to 64 Years | 345 (3.7%) | 627 (6.5%) |
| 65 to 74 Years | 96 (3.9%) | 31 (1.2%) |
| 75 Years and over | 170 (16.9%) | 266 (15.1%) |
Disability Class: Ambulatory Difficulty
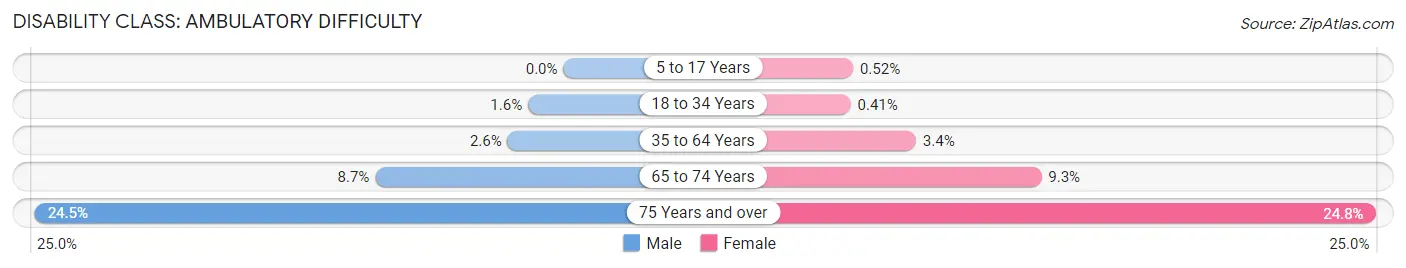
| Age Bracket | Male | Female |
| 5 to 17 Years | 0 (0.0%) | 13 (0.5%) |
| 18 to 34 Years | 215 (1.6%) | 56 (0.4%) |
| 35 to 64 Years | 242 (2.6%) | 331 (3.4%) |
| 65 to 74 Years | 214 (8.7%) | 238 (9.3%) |
| 75 Years and over | 247 (24.5%) | 437 (24.8%) |
Disability Class: Self-Care Difficulty
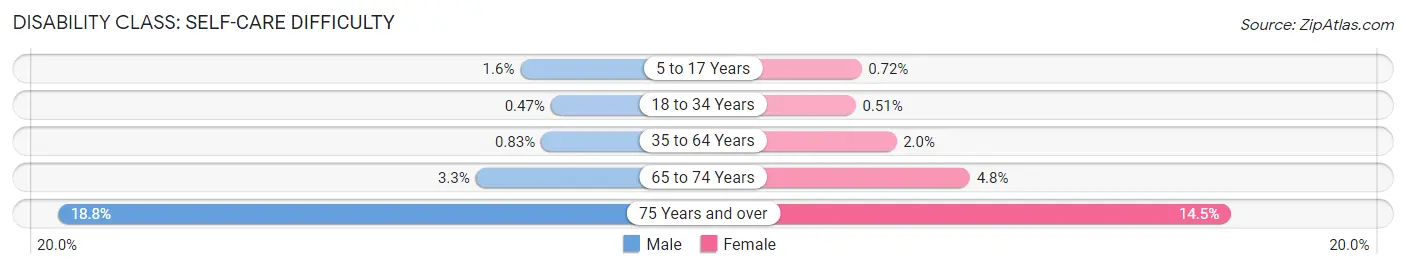
| Age Bracket | Male | Female |
| 5 to 17 Years | 52 (1.6%) | 18 (0.7%) |
| 18 to 34 Years | 62 (0.5%) | 70 (0.5%) |
| 35 to 64 Years | 78 (0.8%) | 194 (2.0%) |
| 65 to 74 Years | 80 (3.3%) | 122 (4.8%) |
| 75 Years and over | 189 (18.8%) | 255 (14.4%) |
Technology Access in Santa Cruz
Computing Device Access in Santa Cruz
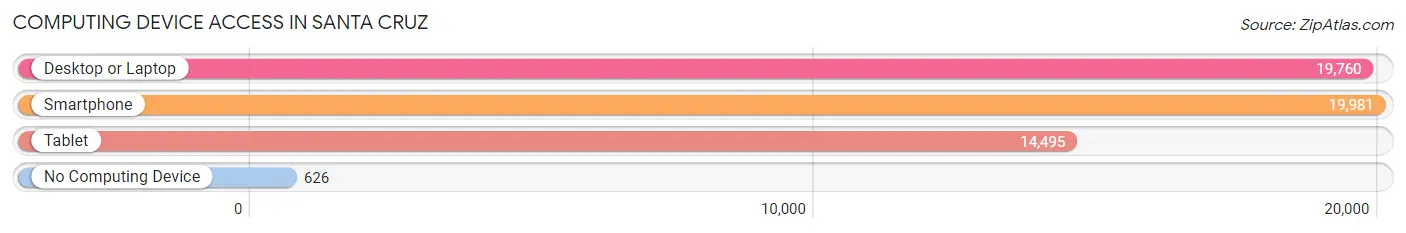
| Device Type | # Households | % Households |
| Desktop or Laptop | 19,760 | 91.5% |
| Smartphone | 19,981 | 92.5% |
| Tablet | 14,495 | 67.1% |
| No Computing Device | 626 | 2.9% |
| Total | 21,594 | 100.0% |
Internet Access in Santa Cruz
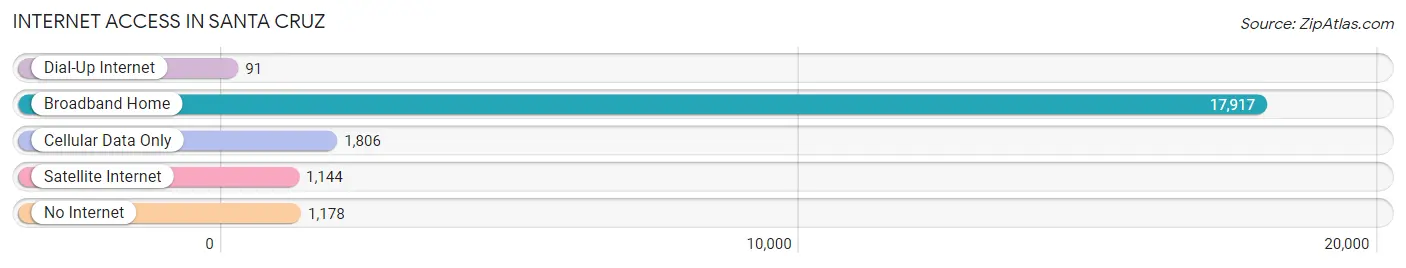
| Internet Type | # Households | % Households |
| Dial-Up Internet | 91 | 0.4% |
| Broadband Home | 17,917 | 83.0% |
| Cellular Data Only | 1,806 | 8.4% |
| Satellite Internet | 1,144 | 5.3% |
| No Internet | 1,178 | 5.5% |
| Total | 21,594 | 100.0% |
Santa Cruz Summary
Santa Cruz, California is a coastal city located in Santa Cruz County, California, United States. It is situated on the northern edge of Monterey Bay, about 72 miles south of San Francisco. Santa Cruz is known for its moderate climate, natural beauty, and relaxed atmosphere. The city has a population of 63,000 people, making it the second-largest city in the county.
History
The area now known as Santa Cruz was first inhabited by the Ohlone people, who lived in the area for thousands of years before the arrival of Europeans. The first European to explore the area was Spanish explorer Gaspar de Portolà, who arrived in 1769. The area was later colonized by the Spanish, who established the Mission Santa Cruz in 1791. The mission was the 12th of the 21 missions established by the Spanish in California.
In 1834, the Mexican government granted the land to the Castro family, who established a rancho in the area. The rancho was later sold to John Burns, who established the town of Santa Cruz in 1848. The town quickly grew, and by the late 19th century, it had become a popular tourist destination.
Geography
Santa Cruz is located on the northern edge of Monterey Bay, about 72 miles south of San Francisco. The city is situated on a coastal plain, with the Santa Cruz Mountains to the east and the Pacific Ocean to the west. The city has a total area of 24.2 square miles, of which 22.2 square miles is land and 2.0 square miles is water.
The climate in Santa Cruz is mild and temperate, with warm summers and mild winters. The average annual temperature is 57°F, and the average annual precipitation is 24.5 inches.
Economy
Santa Cruz has a diverse economy, with a mix of industries including tourism, education, technology, and agriculture. The city is home to several major employers, including the University of California, Santa Cruz, the Santa Cruz Beach Boardwalk, and the Santa Cruz County government.
Tourism is a major industry in Santa Cruz, with the city attracting millions of visitors each year. The city is home to several popular attractions, including the Santa Cruz Beach Boardwalk, the Santa Cruz Wharf, and the Mystery Spot.
Demographics
As of the 2010 census, Santa Cruz had a population of 59,946 people. The racial makeup of the city was 75.3% White, 4.2% African American, 0.7% Native American, 8.2% Asian, 0.2% Pacific Islander, 8.2% from other races, and 3.2% from two or more races. Hispanic or Latino of any race were 18.3% of the population.
The median household income in Santa Cruz was $60,845, and the median family income was $76,945. The per capita income in the city was $31,945. About 11.3% of the population was below the poverty line.
Common Questions
What is Per Capita Income in Santa Cruz?
Per Capita income in Santa Cruz is $51,956.
What is the Median Family Income in Santa Cruz?
Median Family Income in Santa Cruz is $165,792.
What is the Median Household income in Santa Cruz?
Median Household Income in Santa Cruz is $105,491.
What is Income or Wage Gap in Santa Cruz?
Income or Wage Gap in Santa Cruz is 39.3%.
Women in Santa Cruz earn 60.7 cents for every dollar earned by a man.
What is Family Income Deficit in Santa Cruz?
Family Income Deficit in Santa Cruz is $8,737.
Families that are below poverty line in Santa Cruz earn $8,737 less on average than the poverty threshold level.
What is Inequality or Gini Index in Santa Cruz?
Inequality or Gini Index in Santa Cruz is 0.51.
What is the Total Population of Santa Cruz?
Total Population of Santa Cruz is 61,367.
What is the Total Male Population of Santa Cruz?
Total Male Population of Santa Cruz is 30,324.
What is the Total Female Population of Santa Cruz?
Total Female Population of Santa Cruz is 31,043.
What is the Ratio of Males per 100 Females in Santa Cruz?
There are 97.68 Males per 100 Females in Santa Cruz.
What is the Ratio of Females per 100 Males in Santa Cruz?
There are 102.37 Females per 100 Males in Santa Cruz.
What is the Median Population Age in Santa Cruz?
Median Population Age in Santa Cruz is 29.5 Years.
What is the Average Family Size in Santa Cruz
Average Family Size in Santa Cruz is 2.9 People.
What is the Average Household Size in Santa Cruz
Average Household Size in Santa Cruz is 2.4 People.
How Large is the Labor Force in Santa Cruz?
There are 33,847 People in the Labor Forcein in Santa Cruz.
What is the Percentage of People in the Labor Force in Santa Cruz?
61.6% of People are in the Labor Force in Santa Cruz.
What is the Unemployment Rate in Santa Cruz?
Unemployment Rate in Santa Cruz is 6.2%.