Cities with the Highest Percentage of Population Employed in Educational Services in New York
RELATED REPORTS & OPTIONS
Educational Services
New York
Compare Cities
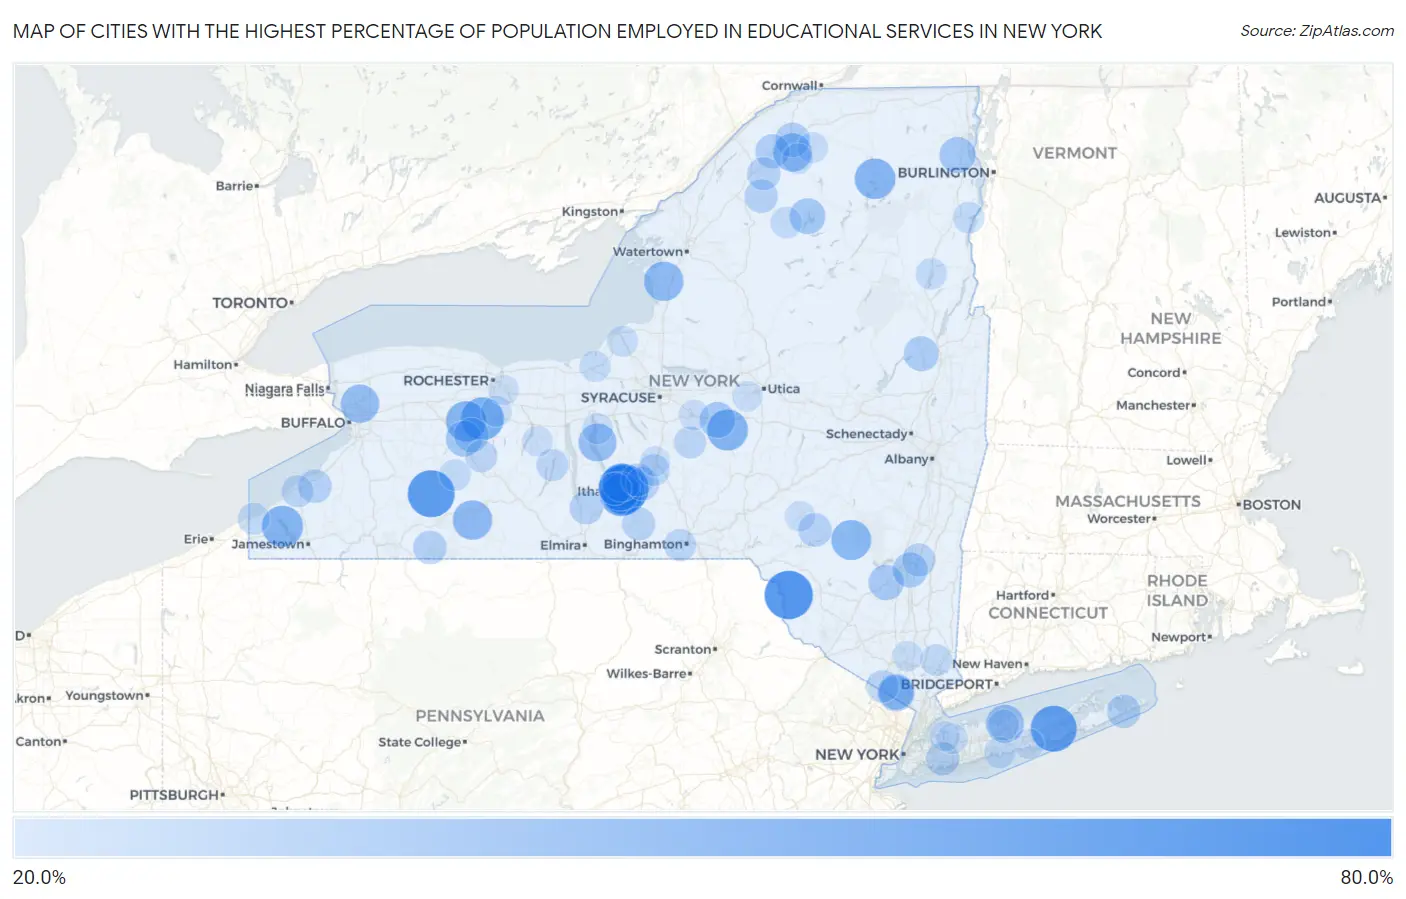
Map of Cities with the Highest Percentage of Population Employed in Educational Services in New York
0.0%
80.0%
Cities with the Highest Percentage of Population Employed in Educational Services in New York
| City | % Employed | vs State | vs National | |
| 1. | Forest Home | 67.1% | 11.5%(+55.5)#1 | 9.3%(+57.7)#78 |
| 2. | Hortonville | 64.3% | 11.5%(+52.8)#2 | 9.3%(+55.0)#93 |
| 3. | Vassar College | 63.1% | 11.5%(+51.6)#3 | 9.3%(+53.8)#96 |
| 4. | Houghton | 61.1% | 11.5%(+49.6)#4 | 9.3%(+51.8)#108 |
| 5. | Northampton | 58.9% | 11.5%(+47.4)#5 | 9.3%(+49.6)#125 |
| 6. | Slaterville Springs | 58.7% | 11.5%(+47.2)#6 | 9.3%(+49.4)#126 |
| 7. | Cayuga Heights | 57.6% | 11.5%(+46.1)#7 | 9.3%(+48.3)#133 |
| 8. | Brooktondale | 55.7% | 11.5%(+44.2)#8 | 9.3%(+46.4)#150 |
| 9. | Nazareth College | 54.9% | 11.5%(+43.4)#9 | 9.3%(+45.6)#160 |
| 10. | East Avon | 51.6% | 11.5%(+40.1)#10 | 9.3%(+42.3)#186 |
| 11. | Northeast Ithaca | 51.6% | 11.5%(+40.1)#11 | 9.3%(+42.2)#188 |
| 12. | East Ithaca | 51.4% | 11.5%(+39.9)#12 | 9.3%(+42.1)#191 |
| 13. | South Hill | 50.9% | 11.5%(+39.4)#13 | 9.3%(+41.6)#196 |
| 14. | Fallsburg | 50.4% | 11.5%(+38.9)#14 | 9.3%(+41.1)#200 |
| 15. | Chautauqua | 48.1% | 11.5%(+36.6)#15 | 9.3%(+38.8)#238 |
| 16. | St. John Fisher College | 47.9% | 11.5%(+36.4)#16 | 9.3%(+38.5)#243 |
| 17. | Varna | 47.8% | 11.5%(+36.3)#17 | 9.3%(+38.5)#244 |
| 18. | Hamilton | 47.4% | 11.5%(+35.9)#18 | 9.3%(+38.1)#246 |
| 19. | Paul Smiths | 46.7% | 11.5%(+35.2)#19 | 9.3%(+37.4)#255 |
| 20. | Fowlerville | 46.7% | 11.5%(+35.2)#20 | 9.3%(+37.4)#256 |
| 21. | Pine Hill | 45.4% | 11.5%(+33.9)#21 | 9.3%(+36.1)#279 |
| 22. | Alfred | 44.3% | 11.5%(+32.8)#22 | 9.3%(+34.9)#297 |
| 23. | Belleville | 44.2% | 11.5%(+32.7)#23 | 9.3%(+34.9)#298 |
| 24. | Hamilton College | 43.8% | 11.5%(+32.3)#24 | 9.3%(+34.5)#310 |
| 25. | Ithaca | 43.8% | 11.5%(+32.2)#25 | 9.3%(+34.4)#311 |
| 26. | Bard College | 43.2% | 11.5%(+31.7)#26 | 9.3%(+33.9)#315 |
| 27. | Hannawa Falls | 42.4% | 11.5%(+30.9)#27 | 9.3%(+33.0)#342 |
| 28. | Lansing | 42.0% | 11.5%(+30.5)#28 | 9.3%(+32.7)#353 |
| 29. | University At Buffalo | 41.9% | 11.5%(+30.4)#29 | 9.3%(+32.5)#356 |
| 30. | Stony Brook University | 41.1% | 11.5%(+29.6)#30 | 9.3%(+31.8)#367 |
| 31. | Aurora | 41.0% | 11.5%(+29.5)#31 | 9.3%(+31.7)#369 |
| 32. | Kaser | 39.5% | 11.5%(+28.0)#32 | 9.3%(+30.1)#405 |
| 33. | Niagara University | 39.3% | 11.5%(+27.8)#33 | 9.3%(+30.0)#409 |
| 34. | West Kill | 38.7% | 11.5%(+27.2)#34 | 9.3%(+29.4)#429 |
| 35. | Rochester Institute Of Technology | 37.4% | 11.5%(+25.9)#35 | 9.3%(+28.1)#469 |
| 36. | Peru | 36.7% | 11.5%(+25.2)#36 | 9.3%(+27.4)#489 |
| 37. | Morrisville | 36.5% | 11.5%(+25.0)#37 | 9.3%(+27.2)#502 |
| 38. | Cranberry Lake | 36.4% | 11.5%(+24.9)#38 | 9.3%(+27.0)#507 |
| 39. | Cuylerville | 36.3% | 11.5%(+24.8)#39 | 9.3%(+26.9)#512 |
| 40. | Cadyville | 35.6% | 11.5%(+24.1)#40 | 9.3%(+26.2)#533 |
| 41. | Jacksonville | 35.5% | 11.5%(+24.0)#41 | 9.3%(+26.2)#536 |
| 42. | Marist College | 35.3% | 11.5%(+23.8)#42 | 9.3%(+26.0)#546 |
| 43. | Salisbury Center | 35.3% | 11.5%(+23.8)#43 | 9.3%(+26.0)#547 |
| 44. | Stone Ridge | 35.3% | 11.5%(+23.8)#44 | 9.3%(+26.0)#548 |
| 45. | Rhinecliff | 34.6% | 11.5%(+23.1)#45 | 9.3%(+25.2)#593 |
| 46. | Lake Luzerne | 34.4% | 11.5%(+22.8)#46 | 9.3%(+25.0)#604 |
| 47. | Round Top | 33.9% | 11.5%(+22.4)#47 | 9.3%(+24.6)#617 |
| 48. | Geneseo | 33.7% | 11.5%(+22.2)#48 | 9.3%(+24.4)#623 |
| 49. | Potsdam | 33.6% | 11.5%(+22.1)#49 | 9.3%(+24.3)#626 |
| 50. | Monsey | 33.2% | 11.5%(+21.7)#50 | 9.3%(+23.9)#658 |
| 51. | Canton | 32.8% | 11.5%(+21.3)#51 | 9.3%(+23.5)#671 |
| 52. | Bolivar | 31.6% | 11.5%(+20.1)#52 | 9.3%(+22.3)#724 |
| 53. | Forestville | 31.5% | 11.5%(+19.9)#53 | 9.3%(+22.1)#731 |
| 54. | Andes | 31.4% | 11.5%(+19.9)#54 | 9.3%(+22.1)#736 |
| 55. | Napeague | 31.3% | 11.5%(+19.8)#55 | 9.3%(+22.0)#742 |
| 56. | Odessa | 31.1% | 11.5%(+19.6)#56 | 9.3%(+21.8)#757 |
| 57. | Edwards | 31.1% | 11.5%(+19.5)#57 | 9.3%(+21.7)#760 |
| 58. | Malverne Park Oaks | 31.0% | 11.5%(+19.5)#58 | 9.3%(+21.6)#768 |
| 59. | Dryden | 30.8% | 11.5%(+19.3)#59 | 9.3%(+21.5)#774 |
| 60. | Red Hook | 30.7% | 11.5%(+19.2)#60 | 9.3%(+21.4)#784 |
| 61. | Hermon | 30.6% | 11.5%(+19.1)#61 | 9.3%(+21.3)#790 |
| 62. | Candor | 30.5% | 11.5%(+19.0)#62 | 9.3%(+21.2)#793 |
| 63. | Freeville | 29.9% | 11.5%(+18.4)#63 | 9.3%(+20.6)#833 |
| 64. | Northwest Ithaca | 29.5% | 11.5%(+18.0)#64 | 9.3%(+20.2)#854 |
| 65. | Sloatsburg | 29.3% | 11.5%(+17.8)#65 | 9.3%(+19.9)#867 |
| 66. | Binghamton University | 28.5% | 11.5%(+17.0)#66 | 9.3%(+19.2)#929 |
| 67. | Keuka Park | 28.4% | 11.5%(+16.9)#67 | 9.3%(+19.1)#932 |
| 68. | Shorehaven | 28.3% | 11.5%(+16.8)#68 | 9.3%(+19.0)#940 |
| 69. | Scottsburg | 28.3% | 11.5%(+16.8)#69 | 9.3%(+18.9)#950 |
| 70. | Deruyter | 28.2% | 11.5%(+16.7)#70 | 9.3%(+18.9)#955 |
| 71. | Munsons Corners | 28.1% | 11.5%(+16.6)#71 | 9.3%(+18.8)#964 |
| 72. | Fredonia | 28.1% | 11.5%(+16.6)#72 | 9.3%(+18.8)#966 |
| 73. | Ripley | 27.8% | 11.5%(+16.3)#73 | 9.3%(+18.5)#990 |
| 74. | Lincolndale | 27.3% | 11.5%(+15.8)#74 | 9.3%(+18.0)#1,027 |
| 75. | Dalton | 27.3% | 11.5%(+15.8)#75 | 9.3%(+18.0)#1,028 |
| 76. | Westport | 27.0% | 11.5%(+15.5)#76 | 9.3%(+17.6)#1,058 |
| 77. | Star Lake | 26.8% | 11.5%(+15.3)#77 | 9.3%(+17.5)#1,074 |
| 78. | Great River | 26.7% | 11.5%(+15.2)#78 | 9.3%(+17.4)#1,079 |
| 79. | Schroon Lake | 26.6% | 11.5%(+15.1)#79 | 9.3%(+17.3)#1,094 |
| 80. | Red Creek | 26.5% | 11.5%(+15.0)#80 | 9.3%(+17.2)#1,096 |
| 81. | Macdonnell Heights | 26.3% | 11.5%(+14.8)#81 | 9.3%(+17.0)#1,115 |
| 82. | Danby | 26.2% | 11.5%(+14.7)#82 | 9.3%(+16.9)#1,120 |
| 83. | Copake | 26.2% | 11.5%(+14.7)#83 | 9.3%(+16.9)#1,124 |
| 84. | Stony Brook | 25.9% | 11.5%(+14.4)#84 | 9.3%(+16.6)#1,157 |
| 85. | Parishville | 25.8% | 11.5%(+14.3)#85 | 9.3%(+16.5)#1,171 |
| 86. | Union Springs | 25.6% | 11.5%(+14.1)#86 | 9.3%(+16.3)#1,194 |
| 87. | Minetto | 25.5% | 11.5%(+14.0)#87 | 9.3%(+16.2)#1,200 |
| 88. | Colton | 25.4% | 11.5%(+13.9)#88 | 9.3%(+16.1)#1,215 |
| 89. | Honeoye Falls | 25.2% | 11.5%(+13.7)#89 | 9.3%(+15.9)#1,225 |
| 90. | Rushville | 25.1% | 11.5%(+13.6)#90 | 9.3%(+15.8)#1,230 |
| 91. | Clinton | 25.0% | 11.5%(+13.5)#91 | 9.3%(+15.7)#1,259 |
| 92. | Cazenovia | 25.0% | 11.5%(+13.4)#92 | 9.3%(+15.6)#1,261 |
| 93. | Brookhaven | 24.9% | 11.5%(+13.4)#93 | 9.3%(+15.6)#1,265 |
| 94. | Highland Falls | 24.8% | 11.5%(+13.3)#94 | 9.3%(+15.5)#1,269 |
| 95. | Delhi | 24.8% | 11.5%(+13.3)#95 | 9.3%(+15.4)#1,277 |
| 96. | Brookville | 24.7% | 11.5%(+13.1)#96 | 9.3%(+15.3)#1,289 |
| 97. | Lake Huntington | 24.5% | 11.5%(+13.0)#97 | 9.3%(+15.2)#1,308 |
| 98. | Pittsford | 24.4% | 11.5%(+12.9)#98 | 9.3%(+15.1)#1,311 |
| 99. | Glenwood Landing | 24.4% | 11.5%(+12.9)#99 | 9.3%(+15.1)#1,314 |
| 100. | Homer | 24.1% | 11.5%(+12.6)#100 | 9.3%(+14.8)#1,356 |
Common Questions
What are the Top 10 Cities with the Highest Percentage of Population Employed in Educational Services in New York?
Top 10 Cities with the Highest Percentage of Population Employed in Educational Services in New York are:
#1
67.1%
#2
64.3%
#3
61.1%
#4
58.9%
#5
57.6%
#6
51.6%
#7
51.6%
#8
51.4%
#9
50.9%
#10
48.1%
What city has the Highest Percentage of Population Employed in Educational Services in New York?
Forest Home has the Highest Percentage of Population Employed in Educational Services in New York with 67.1%.
What is the Percentage of Population Employed in Educational Services in the State of New York?
Percentage of Population Employed in Educational Services in New York is 11.5%.
What is the Percentage of Population Employed in Educational Services in the United States?
Percentage of Population Employed in Educational Services in the United States is 9.3%.