Cities with the Highest Percentage of Population Employed in Educational Services in New Mexico
RELATED REPORTS & OPTIONS
Educational Services
New Mexico
Compare Cities
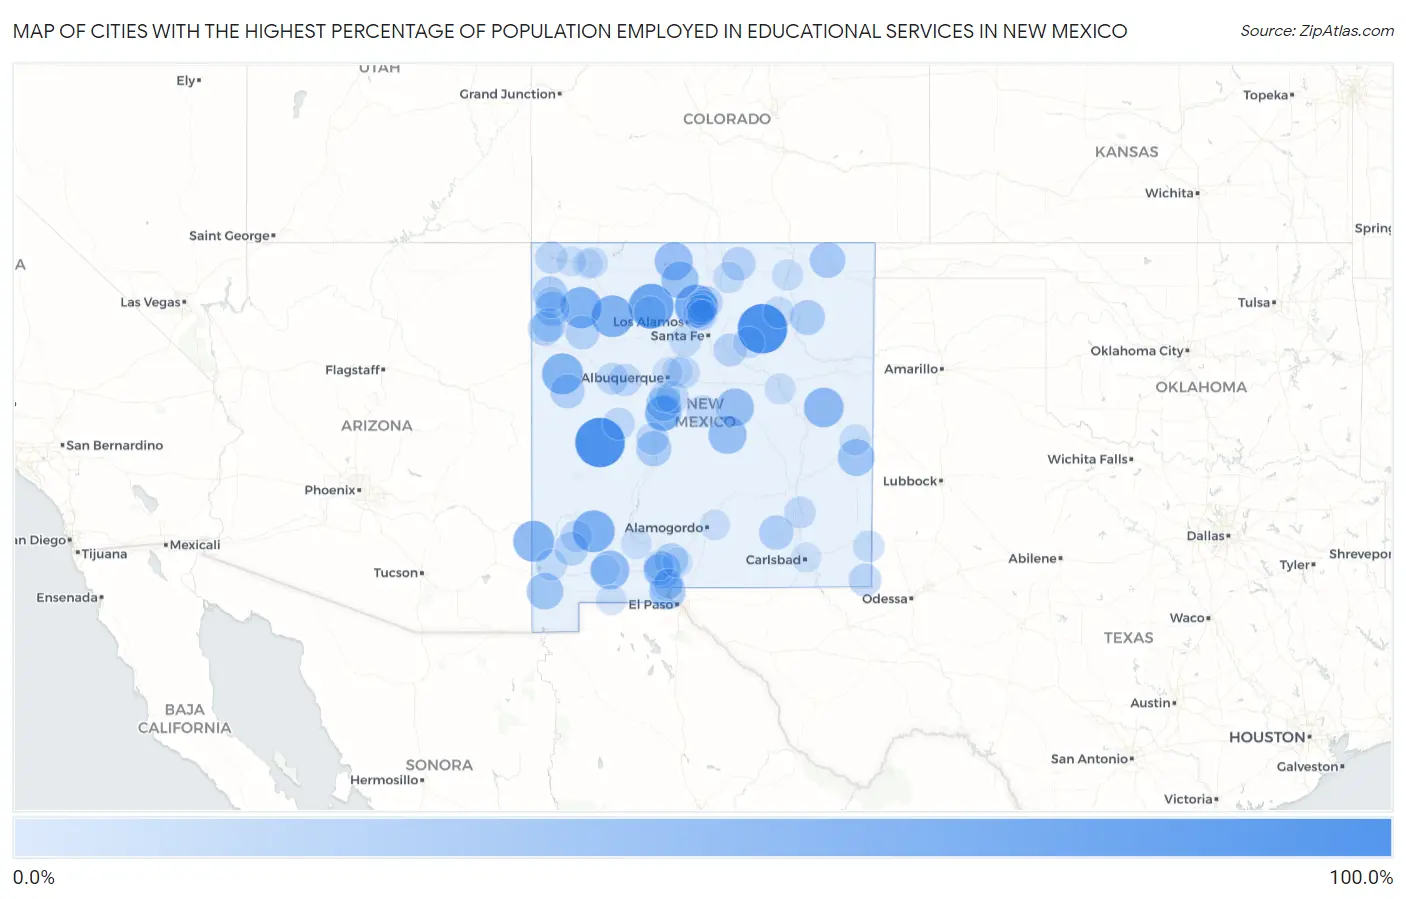
Map of Cities with the Highest Percentage of Population Employed in Educational Services in New Mexico
0.0%
100.0%
Cities with the Highest Percentage of Population Employed in Educational Services in New Mexico
| City | % Employed | vs State | vs National | |
| 1. | Watrous | 100.0% | 10.5%(+89.5)#1 | 9.3%(+90.7)#15 |
| 2. | Datil | 100.0% | 10.5%(+89.5)#2 | 9.3%(+90.7)#34 |
| 3. | La Jara | 78.5% | 10.5%(+67.9)#3 | 9.3%(+69.1)#53 |
| 4. | Chili | 69.4% | 10.5%(+58.9)#4 | 9.3%(+60.1)#72 |
| 5. | Mimbres | 65.6% | 10.5%(+55.1)#5 | 9.3%(+56.3)#86 |
| 6. | Pueblo Pintado | 64.7% | 10.5%(+54.2)#6 | 9.3%(+55.4)#91 |
| 7. | Lake Valley | 62.8% | 10.5%(+52.3)#7 | 9.3%(+53.5)#98 |
| 8. | Virden | 61.7% | 10.5%(+51.2)#8 | 9.3%(+52.4)#104 |
| 9. | Ramah | 61.2% | 10.5%(+50.6)#9 | 9.3%(+51.9)#106 |
| 10. | Golden Acres | 58.2% | 10.5%(+47.6)#10 | 9.3%(+48.8)#130 |
| 11. | House | 55.6% | 10.5%(+45.0)#11 | 9.3%(+46.2)#153 |
| 12. | Pecan Park | 50.9% | 10.5%(+40.4)#12 | 9.3%(+41.6)#197 |
| 13. | Ensenada | 48.9% | 10.5%(+38.4)#13 | 9.3%(+39.6)#225 |
| 14. | Corona | 48.1% | 10.5%(+37.6)#14 | 9.3%(+38.8)#236 |
| 15. | Encino | 48.0% | 10.5%(+37.5)#15 | 9.3%(+38.7)#240 |
| 16. | Ojo Sarco | 45.8% | 10.5%(+35.3)#16 | 9.3%(+36.5)#273 |
| 17. | Canjilon | 45.3% | 10.5%(+34.8)#17 | 9.3%(+36.0)#282 |
| 18. | Dora | 42.9% | 10.5%(+32.3)#18 | 9.3%(+33.5)#328 |
| 19. | Animas | 42.0% | 10.5%(+31.5)#19 | 9.3%(+32.7)#351 |
| 20. | University Park | 40.9% | 10.5%(+30.4)#20 | 9.3%(+31.6)#374 |
| 21. | La Union | 40.3% | 10.5%(+29.7)#21 | 9.3%(+31.0)#385 |
| 22. | Madrone | 39.7% | 10.5%(+29.1)#22 | 9.3%(+30.3)#400 |
| 23. | Bluewater | 37.5% | 10.5%(+27.0)#23 | 9.3%(+28.2)#463 |
| 24. | Des Moines | 37.5% | 10.5%(+27.0)#24 | 9.3%(+28.2)#465 |
| 25. | Pinedale | 36.8% | 10.5%(+26.3)#25 | 9.3%(+27.5)#487 |
| 26. | Casa Colorada | 36.1% | 10.5%(+25.6)#26 | 9.3%(+26.8)#516 |
| 27. | Socorro | 35.1% | 10.5%(+24.6)#27 | 9.3%(+25.8)#564 |
| 28. | Roy | 34.7% | 10.5%(+24.2)#28 | 9.3%(+25.4)#585 |
| 29. | Newcomb | 34.2% | 10.5%(+23.7)#29 | 9.3%(+24.9)#608 |
| 30. | Adelino | 34.2% | 10.5%(+23.7)#30 | 9.3%(+24.9)#609 |
| 31. | Naschitti | 33.3% | 10.5%(+22.8)#31 | 9.3%(+24.0)#635 |
| 32. | Hope | 32.1% | 10.5%(+21.6)#32 | 9.3%(+22.8)#702 |
| 33. | Pinehill | 31.7% | 10.5%(+21.2)#33 | 9.3%(+22.4)#721 |
| 34. | Nakaibito | 30.9% | 10.5%(+20.4)#34 | 9.3%(+21.6)#772 |
| 35. | Crownpoint | 30.5% | 10.5%(+20.0)#35 | 9.3%(+21.2)#795 |
| 36. | Canon | 30.5% | 10.5%(+19.9)#36 | 9.3%(+21.2)#796 |
| 37. | Organ | 29.8% | 10.5%(+19.2)#37 | 9.3%(+20.4)#842 |
| 38. | Tohatchi | 29.6% | 10.5%(+19.1)#38 | 9.3%(+20.3)#849 |
| 39. | White Signal | 29.4% | 10.5%(+18.9)#39 | 9.3%(+20.1)#857 |
| 40. | Red River | 28.8% | 10.5%(+18.3)#40 | 9.3%(+19.5)#894 |
| 41. | Totah Vista | 27.4% | 10.5%(+16.9)#41 | 9.3%(+18.1)#1,020 |
| 42. | North San Ysidro | 26.4% | 10.5%(+15.9)#42 | 9.3%(+17.1)#1,104 |
| 43. | Velarde | 25.6% | 10.5%(+15.1)#43 | 9.3%(+16.3)#1,192 |
| 44. | Jal | 25.2% | 10.5%(+14.7)#44 | 9.3%(+15.9)#1,226 |
| 45. | Cuba | 24.5% | 10.5%(+14.0)#45 | 9.3%(+15.2)#1,303 |
| 46. | Paa-Ko | 24.2% | 10.5%(+13.7)#46 | 9.3%(+14.9)#1,346 |
| 47. | Laguna | 24.0% | 10.5%(+13.5)#47 | 9.3%(+14.7)#1,359 |
| 48. | Meadow Lake | 23.8% | 10.5%(+13.3)#48 | 9.3%(+14.5)#1,400 |
| 49. | Chamita | 23.7% | 10.5%(+13.2)#49 | 9.3%(+14.4)#1,419 |
| 50. | Polvadera | 23.6% | 10.5%(+13.1)#50 | 9.3%(+14.3)#1,439 |
| 51. | Acomita Lake | 22.8% | 10.5%(+12.3)#51 | 9.3%(+13.5)#1,543 |
| 52. | Chamberino | 22.8% | 10.5%(+12.3)#52 | 9.3%(+13.5)#1,544 |
| 53. | Alamo | 22.6% | 10.5%(+12.1)#53 | 9.3%(+13.3)#1,590 |
| 54. | La Villita | 22.5% | 10.5%(+12.0)#54 | 9.3%(+13.2)#1,612 |
| 55. | Willard | 22.4% | 10.5%(+11.9)#55 | 9.3%(+13.1)#1,632 |
| 56. | Shiprock | 22.2% | 10.5%(+11.7)#56 | 9.3%(+12.9)#1,658 |
| 57. | Sandia Park | 21.6% | 10.5%(+11.1)#57 | 9.3%(+12.3)#1,748 |
| 58. | Santa Clara Pueblo | 21.4% | 10.5%(+10.9)#58 | 9.3%(+12.1)#1,782 |
| 59. | Sunlit Hills | 21.1% | 10.5%(+10.6)#59 | 9.3%(+11.8)#1,851 |
| 60. | Hagerman | 20.9% | 10.5%(+10.4)#60 | 9.3%(+11.6)#1,904 |
| 61. | Silver City | 20.7% | 10.5%(+10.2)#61 | 9.3%(+11.4)#1,947 |
| 62. | South River | 20.2% | 10.5%(+9.68)#62 | 9.3%(+10.9)#2,068 |
| 63. | Arroyo Seco | 20.0% | 10.5%(+9.49)#63 | 9.3%(+10.7)#2,099 |
| 64. | Lordsburg | 20.0% | 10.5%(+9.44)#64 | 9.3%(+10.7)#2,136 |
| 65. | Wagon Mound | 19.9% | 10.5%(+9.35)#65 | 9.3%(+10.6)#2,154 |
| 66. | Cochiti | 19.8% | 10.5%(+9.30)#66 | 9.3%(+10.5)#2,169 |
| 67. | Las Vegas | 19.8% | 10.5%(+9.28)#67 | 9.3%(+10.5)#2,175 |
| 68. | Sheep Springs | 19.8% | 10.5%(+9.27)#68 | 9.3%(+10.5)#2,178 |
| 69. | Nadine | 19.6% | 10.5%(+9.10)#69 | 9.3%(+10.3)#2,224 |
| 70. | Angustura | 19.5% | 10.5%(+8.95)#70 | 9.3%(+10.2)#2,260 |
| 71. | Valencia | 19.4% | 10.5%(+8.90)#71 | 9.3%(+10.1)#2,272 |
| 72. | Placitas Cdp Sandoval County | 19.4% | 10.5%(+8.89)#72 | 9.3%(+10.1)#2,277 |
| 73. | Thunder Mountain | 18.8% | 10.5%(+8.22)#73 | 9.3%(+9.43)#2,464 |
| 74. | Butterfield Park | 18.8% | 10.5%(+8.22)#74 | 9.3%(+9.43)#2,465 |
| 75. | Maxwell | 18.5% | 10.5%(+7.96)#75 | 9.3%(+9.17)#2,567 |
| 76. | Mesilla | 18.4% | 10.5%(+7.85)#76 | 9.3%(+9.07)#2,607 |
| 77. | Portales | 18.0% | 10.5%(+7.42)#77 | 9.3%(+8.64)#2,764 |
| 78. | Bloomfield | 17.8% | 10.5%(+7.23)#78 | 9.3%(+8.45)#2,835 |
| 79. | Santa Rosa | 17.7% | 10.5%(+7.17)#79 | 9.3%(+8.38)#2,866 |
| 80. | Haystack | 17.5% | 10.5%(+6.97)#80 | 9.3%(+8.18)#2,942 |
| 81. | Picacho Hills | 17.5% | 10.5%(+6.94)#81 | 9.3%(+8.15)#2,957 |
| 82. | Cañoncito | 17.0% | 10.5%(+6.46)#82 | 9.3%(+7.67)#3,173 |
| 83. | Hatch | 16.7% | 10.5%(+6.21)#83 | 9.3%(+7.43)#3,293 |
| 84. | Ojo Encino | 16.4% | 10.5%(+5.83)#84 | 9.3%(+7.05)#3,507 |
| 85. | Ohkay Owingeh | 16.2% | 10.5%(+5.65)#85 | 9.3%(+6.86)#3,615 |
| 86. | Sandia Heights | 15.3% | 10.5%(+4.75)#86 | 9.3%(+5.96)#4,142 |
| 87. | Edith Enclave | 15.2% | 10.5%(+4.62)#87 | 9.3%(+5.84)#4,205 |
| 88. | High Rolls | 15.1% | 10.5%(+4.57)#88 | 9.3%(+5.78)#4,233 |
| 89. | Sombrillo | 15.0% | 10.5%(+4.47)#89 | 9.3%(+5.68)#4,304 |
| 90. | Columbus | 14.9% | 10.5%(+4.38)#90 | 9.3%(+5.60)#4,366 |
| 91. | Las Cruces | 14.9% | 10.5%(+4.37)#91 | 9.3%(+5.58)#4,379 |
| 92. | Los Ranchos De Albuquerque | 14.8% | 10.5%(+4.23)#92 | 9.3%(+5.45)#4,467 |
| 93. | Barton | 14.8% | 10.5%(+4.22)#93 | 9.3%(+5.44)#4,470 |
| 94. | Lee Acres | 14.7% | 10.5%(+4.20)#94 | 9.3%(+5.41)#4,492 |
| 95. | Berino | 14.7% | 10.5%(+4.19)#95 | 9.3%(+5.40)#4,498 |
| 96. | Iyanbito | 14.7% | 10.5%(+4.14)#96 | 9.3%(+5.36)#4,531 |
| 97. | Kirtland | 14.5% | 10.5%(+3.94)#97 | 9.3%(+5.15)#4,699 |
| 98. | Deming | 14.5% | 10.5%(+3.92)#98 | 9.3%(+5.14)#4,713 |
| 99. | La Huerta | 14.2% | 10.5%(+3.66)#99 | 9.3%(+4.88)#4,944 |
| 100. | White Sands | 14.2% | 10.5%(+3.63)#100 | 9.3%(+4.84)#4,969 |
Common Questions
What are the Top 10 Cities with the Highest Percentage of Population Employed in Educational Services in New Mexico?
Top 10 Cities with the Highest Percentage of Population Employed in Educational Services in New Mexico are:
#1
100.0%
#2
100.0%
#3
78.5%
#4
69.4%
#5
65.6%
#6
64.7%
#7
62.8%
#8
61.7%
#9
61.2%
#10
55.6%
What city has the Highest Percentage of Population Employed in Educational Services in New Mexico?
Watrous has the Highest Percentage of Population Employed in Educational Services in New Mexico with 100.0%.
What is the Percentage of Population Employed in Educational Services in the State of New Mexico?
Percentage of Population Employed in Educational Services in New Mexico is 10.5%.
What is the Percentage of Population Employed in Educational Services in the United States?
Percentage of Population Employed in Educational Services in the United States is 9.3%.