Cities with the Highest Percentage of Population Employed in Educational Services in Tennessee
RELATED REPORTS & OPTIONS
Educational Services
Tennessee
Compare Cities
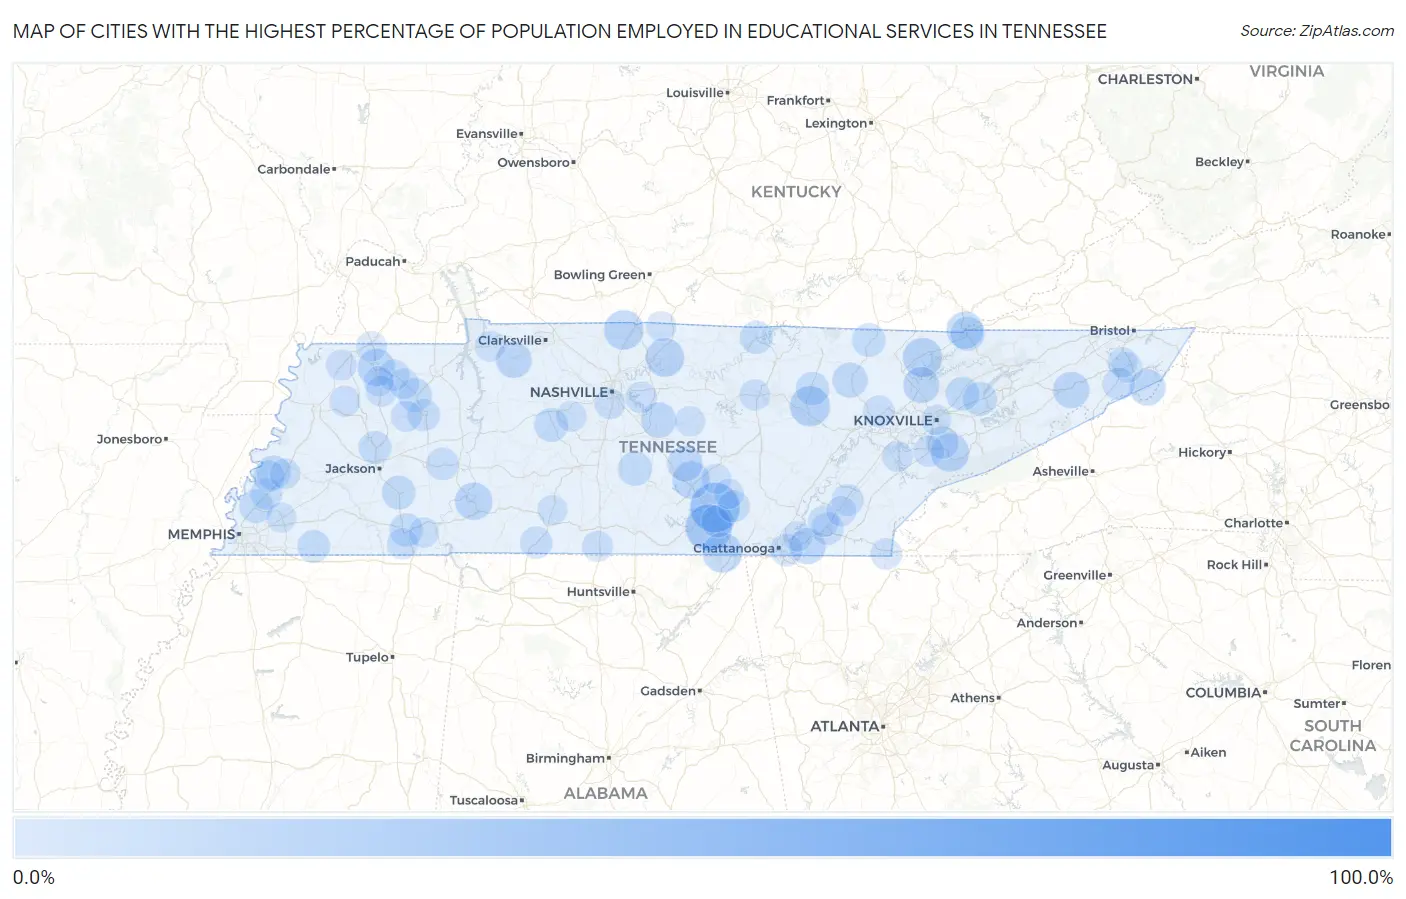
Map of Cities with the Highest Percentage of Population Employed in Educational Services in Tennessee
0.0%
100.0%
Cities with the Highest Percentage of Population Employed in Educational Services in Tennessee
| City | % Employed | vs State | vs National | |
| 1. | Mercer | 100.0% | 8.3%(+91.7)#1 | 9.3%(+90.7)#17 |
| 2. | Morris Chapel | 46.3% | 8.3%(+38.0)#2 | 9.3%(+37.0)#265 |
| 3. | Pocahontas | 42.3% | 8.3%(+34.0)#3 | 9.3%(+33.0)#343 |
| 4. | Pelham | 38.8% | 8.3%(+30.5)#4 | 9.3%(+29.5)#425 |
| 5. | Sewanee | 34.4% | 8.3%(+26.1)#5 | 9.3%(+25.1)#599 |
| 6. | Leoma | 29.1% | 8.3%(+20.8)#6 | 9.3%(+19.8)#879 |
| 7. | Luray | 28.2% | 8.3%(+19.9)#7 | 9.3%(+18.9)#951 |
| 8. | Palmersville | 26.0% | 8.3%(+17.7)#8 | 9.3%(+16.7)#1,146 |
| 9. | Bowman | 25.4% | 8.3%(+17.1)#9 | 9.3%(+16.1)#1,207 |
| 10. | Orme | 25.0% | 8.3%(+16.7)#10 | 9.3%(+15.7)#1,252 |
| 11. | Wildersville | 24.6% | 8.3%(+16.3)#11 | 9.3%(+15.3)#1,295 |
| 12. | Orlinda | 24.2% | 8.3%(+15.9)#12 | 9.3%(+14.9)#1,344 |
| 13. | Fincastle | 24.2% | 8.3%(+15.9)#13 | 9.3%(+14.9)#1,348 |
| 14. | Castalian Springs | 23.1% | 8.3%(+14.8)#14 | 9.3%(+13.8)#1,506 |
| 15. | Walland | 22.9% | 8.3%(+14.6)#15 | 9.3%(+13.6)#1,540 |
| 16. | Yuma | 22.7% | 8.3%(+14.4)#16 | 9.3%(+13.4)#1,569 |
| 17. | New Union | 21.5% | 8.3%(+13.2)#17 | 9.3%(+12.2)#1,777 |
| 18. | Martin | 21.4% | 8.3%(+13.1)#18 | 9.3%(+12.1)#1,780 |
| 19. | Clifton | 21.4% | 8.3%(+13.1)#19 | 9.3%(+12.1)#1,802 |
| 20. | Cumberland Gap | 20.7% | 8.3%(+12.4)#20 | 9.3%(+11.4)#1,949 |
| 21. | Tusculum | 19.9% | 8.3%(+11.6)#21 | 9.3%(+10.6)#2,155 |
| 22. | Norris | 19.4% | 8.3%(+11.1)#22 | 9.3%(+10.1)#2,282 |
| 23. | Roan Mountain | 19.3% | 8.3%(+11.0)#23 | 9.3%(+10.0)#2,305 |
| 24. | Collegedale | 19.3% | 8.3%(+11.0)#24 | 9.3%(+9.98)#2,312 |
| 25. | Cumberland City | 19.2% | 8.3%(+10.9)#25 | 9.3%(+9.92)#2,327 |
| 26. | Pinson | 18.6% | 8.3%(+10.3)#26 | 9.3%(+9.27)#2,532 |
| 27. | Lakewood Park | 18.5% | 8.3%(+10.2)#27 | 9.3%(+9.21)#2,554 |
| 28. | Walterhill | 18.4% | 8.3%(+10.1)#28 | 9.3%(+9.13)#2,580 |
| 29. | Sunbright | 18.1% | 8.3%(+9.80)#29 | 9.3%(+8.79)#2,714 |
| 30. | Rarity Bay | 18.1% | 8.3%(+9.77)#30 | 9.3%(+8.76)#2,724 |
| 31. | Harrogate | 17.1% | 8.3%(+8.78)#31 | 9.3%(+7.78)#3,133 |
| 32. | Unionville | 16.8% | 8.3%(+8.44)#32 | 9.3%(+7.44)#3,285 |
| 33. | New Market | 16.6% | 8.3%(+8.28)#33 | 9.3%(+7.28)#3,408 |
| 34. | Garland | 16.6% | 8.3%(+8.24)#34 | 9.3%(+7.24)#3,429 |
| 35. | Blaine | 16.3% | 8.3%(+8.00)#35 | 9.3%(+7.00)#3,527 |
| 36. | Bon Aqua Junction | 16.3% | 8.3%(+7.99)#36 | 9.3%(+6.99)#3,535 |
| 37. | Henderson | 16.2% | 8.3%(+7.91)#37 | 9.3%(+6.91)#3,592 |
| 38. | Millington | 16.2% | 8.3%(+7.89)#38 | 9.3%(+6.89)#3,603 |
| 39. | Mckenzie | 16.2% | 8.3%(+7.89)#39 | 9.3%(+6.89)#3,605 |
| 40. | Oneida | 16.0% | 8.3%(+7.71)#40 | 9.3%(+6.70)#3,706 |
| 41. | Clarkrange | 15.9% | 8.3%(+7.56)#41 | 9.3%(+6.55)#3,788 |
| 42. | Selmer | 15.6% | 8.3%(+7.30)#42 | 9.3%(+6.30)#3,931 |
| 43. | Celina | 15.2% | 8.3%(+6.85)#43 | 9.3%(+5.85)#4,194 |
| 44. | Three Way | 14.8% | 8.3%(+6.52)#44 | 9.3%(+5.52)#4,414 |
| 45. | Moscow | 14.7% | 8.3%(+6.39)#45 | 9.3%(+5.38)#4,519 |
| 46. | Wildwood | 14.7% | 8.3%(+6.35)#46 | 9.3%(+5.35)#4,539 |
| 47. | Delano | 14.6% | 8.3%(+6.28)#47 | 9.3%(+5.28)#4,606 |
| 48. | Monteagle | 14.4% | 8.3%(+6.13)#48 | 9.3%(+5.12)#4,727 |
| 49. | Chesterfield | 14.4% | 8.3%(+6.06)#49 | 9.3%(+5.05)#4,780 |
| 50. | Ridgeside | 14.4% | 8.3%(+6.04)#50 | 9.3%(+5.04)#4,788 |
| 51. | Cleveland | 14.3% | 8.3%(+5.97)#51 | 9.3%(+4.97)#4,826 |
| 52. | Huntingdon | 14.3% | 8.3%(+5.97)#52 | 9.3%(+4.97)#4,827 |
| 53. | Unicoi | 14.1% | 8.3%(+5.76)#53 | 9.3%(+4.76)#5,035 |
| 54. | Loretto | 14.0% | 8.3%(+5.66)#54 | 9.3%(+4.65)#5,144 |
| 55. | Munford | 13.8% | 8.3%(+5.47)#55 | 9.3%(+4.47)#5,296 |
| 56. | Riceville | 13.6% | 8.3%(+5.31)#56 | 9.3%(+4.31)#5,427 |
| 57. | Coalmont | 13.4% | 8.3%(+5.13)#57 | 9.3%(+4.12)#5,577 |
| 58. | Burlison | 13.3% | 8.3%(+5.02)#58 | 9.3%(+4.02)#5,671 |
| 59. | Oak Grove Cdp Washington County | 13.3% | 8.3%(+4.94)#59 | 9.3%(+3.94)#5,767 |
| 60. | Lenox | 13.2% | 8.3%(+4.92)#60 | 9.3%(+3.92)#5,782 |
| 61. | Coalfield | 13.1% | 8.3%(+4.76)#61 | 9.3%(+3.75)#5,936 |
| 62. | Dresden | 12.9% | 8.3%(+4.57)#62 | 9.3%(+3.57)#6,161 |
| 63. | Copperhill | 12.9% | 8.3%(+4.54)#63 | 9.3%(+3.54)#6,183 |
| 64. | Rural Hill | 12.7% | 8.3%(+4.41)#64 | 9.3%(+3.41)#6,307 |
| 65. | Hopewell | 12.7% | 8.3%(+4.37)#65 | 9.3%(+3.37)#6,350 |
| 66. | Ramer | 12.6% | 8.3%(+4.28)#66 | 9.3%(+3.28)#6,434 |
| 67. | Prospect | 12.5% | 8.3%(+4.19)#67 | 9.3%(+3.18)#6,563 |
| 68. | Mclemoresville | 12.4% | 8.3%(+4.10)#68 | 9.3%(+3.10)#6,666 |
| 69. | Maryville | 12.4% | 8.3%(+4.06)#69 | 9.3%(+3.06)#6,692 |
| 70. | Greenfield | 12.2% | 8.3%(+3.89)#70 | 9.3%(+2.89)#6,906 |
| 71. | Yorkville | 12.2% | 8.3%(+3.88)#71 | 9.3%(+2.88)#6,923 |
| 72. | Gladeville | 12.2% | 8.3%(+3.85)#72 | 9.3%(+2.85)#6,961 |
| 73. | Cookeville | 12.2% | 8.3%(+3.85)#73 | 9.3%(+2.85)#6,964 |
| 74. | Hampton | 12.1% | 8.3%(+3.83)#74 | 9.3%(+2.83)#6,981 |
| 75. | Elkton | 12.0% | 8.3%(+3.72)#75 | 9.3%(+2.72)#7,131 |
| 76. | Tellico Village | 12.0% | 8.3%(+3.64)#76 | 9.3%(+2.64)#7,234 |
| 77. | Blanche | 11.9% | 8.3%(+3.61)#77 | 9.3%(+2.61)#7,268 |
| 78. | Gleason | 11.9% | 8.3%(+3.57)#78 | 9.3%(+2.57)#7,314 |
| 79. | Troy | 11.9% | 8.3%(+3.54)#79 | 9.3%(+2.54)#7,356 |
| 80. | Oak Hill | 11.8% | 8.3%(+3.50)#80 | 9.3%(+2.49)#7,422 |
| 81. | Covington | 11.8% | 8.3%(+3.50)#81 | 9.3%(+2.49)#7,424 |
| 82. | Fairview | 11.7% | 8.3%(+3.36)#82 | 9.3%(+2.36)#7,607 |
| 83. | Dover | 11.6% | 8.3%(+3.27)#83 | 9.3%(+2.27)#7,728 |
| 84. | Elizabethton | 11.4% | 8.3%(+3.10)#84 | 9.3%(+2.10)#7,969 |
| 85. | Huron | 11.4% | 8.3%(+3.05)#85 | 9.3%(+2.05)#8,037 |
| 86. | Strawberry Plains | 11.4% | 8.3%(+3.04)#86 | 9.3%(+2.04)#8,046 |
| 87. | South Fulton | 11.3% | 8.3%(+2.99)#87 | 9.3%(+1.98)#8,118 |
| 88. | Calhoun | 11.3% | 8.3%(+2.97)#88 | 9.3%(+1.96)#8,144 |
| 89. | Stantonville | 11.3% | 8.3%(+2.95)#89 | 9.3%(+1.94)#8,178 |
| 90. | Orebank | 11.3% | 8.3%(+2.94)#90 | 9.3%(+1.94)#8,184 |
| 91. | Auburntown | 11.2% | 8.3%(+2.92)#91 | 9.3%(+1.92)#8,216 |
| 92. | Arlington | 11.2% | 8.3%(+2.86)#92 | 9.3%(+1.85)#8,327 |
| 93. | Sharon | 11.2% | 8.3%(+2.85)#93 | 9.3%(+1.85)#8,340 |
| 94. | Harrison | 11.1% | 8.3%(+2.82)#94 | 9.3%(+1.82)#8,369 |
| 95. | Knoxville | 11.1% | 8.3%(+2.82)#95 | 9.3%(+1.81)#8,382 |
| 96. | Viola | 11.1% | 8.3%(+2.80)#96 | 9.3%(+1.80)#8,445 |
| 97. | Altamont | 11.1% | 8.3%(+2.76)#97 | 9.3%(+1.75)#8,507 |
| 98. | Watauga | 11.1% | 8.3%(+2.75)#98 | 9.3%(+1.75)#8,518 |
| 99. | Ethridge | 11.0% | 8.3%(+2.70)#99 | 9.3%(+1.70)#8,591 |
| 100. | Fairfield | 11.0% | 8.3%(+2.65)#100 | 9.3%(+1.64)#8,668 |
Common Questions
What are the Top 10 Cities with the Highest Percentage of Population Employed in Educational Services in Tennessee?
Top 10 Cities with the Highest Percentage of Population Employed in Educational Services in Tennessee are:
What city has the Highest Percentage of Population Employed in Educational Services in Tennessee?
Pelham has the Highest Percentage of Population Employed in Educational Services in Tennessee with 38.8%.
What is the Percentage of Population Employed in Educational Services in the State of Tennessee?
Percentage of Population Employed in Educational Services in Tennessee is 8.3%.
What is the Percentage of Population Employed in Educational Services in the United States?
Percentage of Population Employed in Educational Services in the United States is 9.3%.