Cities with the Highest Percentage of Population Employed in Educational Services in Virginia
RELATED REPORTS & OPTIONS
Educational Services
Virginia
Compare Cities
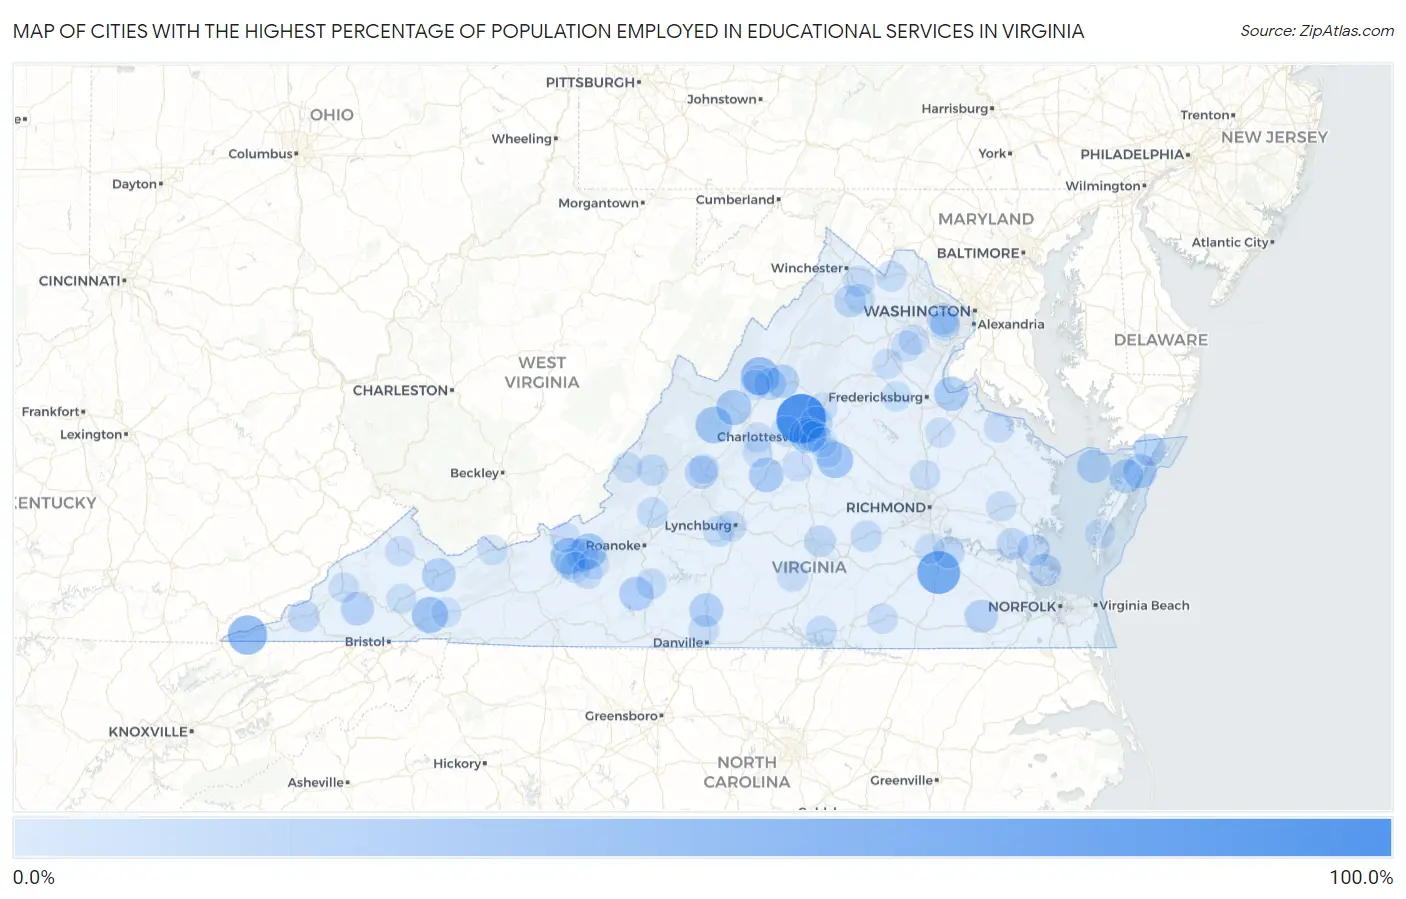
Map of Cities with the Highest Percentage of Population Employed in Educational Services in Virginia
0.0%
100.0%
Cities with the Highest Percentage of Population Employed in Educational Services in Virginia
| City | % Employed | vs State | vs National | |
| 1. | Free Union | 100.0% | 9.8%(+90.2)#1 | 9.3%(+90.7)#5 |
| 2. | Templeton | 70.5% | 9.8%(+60.7)#2 | 9.3%(+61.2)#68 |
| 3. | Ewing | 54.5% | 9.8%(+44.7)#3 | 9.3%(+45.2)#166 |
| 4. | Mcdowell | 50.0% | 9.8%(+40.2)#4 | 9.3%(+40.7)#210 |
| 5. | Belmont Estates | 49.9% | 9.8%(+40.1)#5 | 9.3%(+40.6)#220 |
| 6. | Augusta Springs | 43.0% | 9.8%(+33.3)#6 | 9.3%(+33.7)#321 |
| 7. | Belspring | 42.7% | 9.8%(+32.9)#7 | 9.3%(+33.4)#335 |
| 8. | University Of Virginia | 42.0% | 9.8%(+32.2)#8 | 9.3%(+32.7)#350 |
| 9. | Emory | 41.9% | 9.8%(+32.1)#9 | 9.3%(+32.6)#354 |
| 10. | Palmyra | 41.6% | 9.8%(+31.8)#10 | 9.3%(+32.3)#361 |
| 11. | Blacksburg | 38.9% | 9.8%(+29.1)#11 | 9.3%(+29.6)#423 |
| 12. | Stickleyville | 37.9% | 9.8%(+28.1)#12 | 9.3%(+28.6)#449 |
| 13. | Churchville | 37.5% | 9.8%(+27.7)#13 | 9.3%(+28.2)#466 |
| 14. | Brucetown | 36.7% | 9.8%(+26.9)#14 | 9.3%(+27.4)#491 |
| 15. | The University Of Virginia's College At Wise | 35.7% | 9.8%(+25.9)#15 | 9.3%(+26.3)#531 |
| 16. | Lovingston | 35.3% | 9.8%(+25.5)#16 | 9.3%(+26.0)#550 |
| 17. | Fairview Beach | 33.8% | 9.8%(+24.0)#17 | 9.3%(+24.5)#619 |
| 18. | North Garden | 33.0% | 9.8%(+23.2)#18 | 9.3%(+23.7)#663 |
| 19. | Ferrum | 32.7% | 9.8%(+22.9)#19 | 9.3%(+23.4)#678 |
| 20. | Gargatha | 32.7% | 9.8%(+22.9)#20 | 9.3%(+23.4)#679 |
| 21. | Bayside | 32.6% | 9.8%(+22.8)#21 | 9.3%(+23.3)#683 |
| 22. | Chatham | 31.3% | 9.8%(+21.5)#22 | 9.3%(+22.0)#745 |
| 23. | Claypool Hill | 31.2% | 9.8%(+21.4)#23 | 9.3%(+21.9)#751 |
| 24. | Innovation | 31.0% | 9.8%(+21.2)#24 | 9.3%(+21.7)#762 |
| 25. | Cliftondale Park | 30.8% | 9.8%(+21.0)#25 | 9.3%(+21.5)#775 |
| 26. | Massanutten | 30.7% | 9.8%(+20.9)#26 | 9.3%(+21.4)#781 |
| 27. | Tangier | 30.1% | 9.8%(+20.3)#27 | 9.3%(+20.8)#818 |
| 28. | Hilltown | 29.8% | 9.8%(+20.0)#28 | 9.3%(+20.5)#840 |
| 29. | Dungannon | 29.2% | 9.8%(+19.4)#29 | 9.3%(+19.9)#870 |
| 30. | Lexington | 29.1% | 9.8%(+19.3)#30 | 9.3%(+19.7)#882 |
| 31. | Prices Fork | 29.0% | 9.8%(+19.2)#31 | 9.3%(+19.7)#885 |
| 32. | Sedley | 28.9% | 9.8%(+19.1)#32 | 9.3%(+19.5)#893 |
| 33. | Big Rock | 27.6% | 9.8%(+17.8)#33 | 9.3%(+18.3)#1,003 |
| 34. | Abbs Valley | 27.3% | 9.8%(+17.5)#34 | 9.3%(+18.0)#1,032 |
| 35. | Bethel Manor | 26.3% | 9.8%(+16.6)#35 | 9.3%(+17.0)#1,107 |
| 36. | Charlottesville | 26.3% | 9.8%(+16.5)#36 | 9.3%(+17.0)#1,114 |
| 37. | Camp Barrett | 26.2% | 9.8%(+16.4)#37 | 9.3%(+16.9)#1,125 |
| 38. | Massanetta Springs | 25.7% | 9.8%(+15.9)#38 | 9.3%(+16.4)#1,174 |
| 39. | Wattsville | 25.7% | 9.8%(+15.9)#39 | 9.3%(+16.4)#1,178 |
| 40. | Earlysville | 25.4% | 9.8%(+15.7)#40 | 9.3%(+16.1)#1,206 |
| 41. | Hollymead | 25.0% | 9.8%(+15.2)#41 | 9.3%(+15.7)#1,238 |
| 42. | Shenandoah Shores | 24.3% | 9.8%(+14.5)#42 | 9.3%(+15.0)#1,330 |
| 43. | Yorktown | 23.8% | 9.8%(+14.1)#43 | 9.3%(+14.5)#1,389 |
| 44. | Dryden | 23.4% | 9.8%(+13.7)#44 | 9.3%(+14.1)#1,455 |
| 45. | Farmville | 22.8% | 9.8%(+13.0)#45 | 9.3%(+13.5)#1,549 |
| 46. | George Mason | 22.8% | 9.8%(+13.0)#46 | 9.3%(+13.5)#1,550 |
| 47. | Williamsburg | 22.7% | 9.8%(+12.9)#47 | 9.3%(+13.4)#1,563 |
| 48. | Prince George | 22.1% | 9.8%(+12.3)#48 | 9.3%(+12.8)#1,672 |
| 49. | Amelia Court House | 21.8% | 9.8%(+12.0)#49 | 9.3%(+12.5)#1,730 |
| 50. | Pantops | 21.4% | 9.8%(+11.6)#50 | 9.3%(+12.1)#1,792 |
| 51. | Low Moor | 21.4% | 9.8%(+11.6)#51 | 9.3%(+12.1)#1,797 |
| 52. | Boyce | 20.5% | 9.8%(+10.7)#52 | 9.3%(+11.2)#1,994 |
| 53. | Rocky Mount | 20.2% | 9.8%(+10.4)#53 | 9.3%(+10.9)#2,074 |
| 54. | Forest | 20.1% | 9.8%(+10.3)#54 | 9.3%(+10.8)#2,084 |
| 55. | Crozet | 20.0% | 9.8%(+10.2)#55 | 9.3%(+10.6)#2,138 |
| 56. | New River | 19.9% | 9.8%(+10.2)#56 | 9.3%(+10.6)#2,142 |
| 57. | Radford | 19.9% | 9.8%(+10.1)#57 | 9.3%(+10.6)#2,159 |
| 58. | Boydton | 19.9% | 9.8%(+10.1)#58 | 9.3%(+10.5)#2,163 |
| 59. | Fincastle | 19.8% | 9.8%(+10.0)#59 | 9.3%(+10.5)#2,168 |
| 60. | Round Hill | 19.3% | 9.8%(+9.48)#60 | 9.3%(+9.95)#2,320 |
| 61. | Mount Hermon | 19.2% | 9.8%(+9.43)#61 | 9.3%(+9.90)#2,335 |
| 62. | Christiansburg | 19.1% | 9.8%(+9.27)#62 | 9.3%(+9.74)#2,368 |
| 63. | Catlett | 19.0% | 9.8%(+9.17)#63 | 9.3%(+9.64)#2,399 |
| 64. | Charlotte Court House | 18.8% | 9.8%(+9.04)#64 | 9.3%(+9.51)#2,440 |
| 65. | Lynchburg | 18.6% | 9.8%(+8.81)#65 | 9.3%(+9.28)#2,526 |
| 66. | Pounding Mill | 18.4% | 9.8%(+8.61)#66 | 9.3%(+9.08)#2,602 |
| 67. | Dayton | 18.0% | 9.8%(+8.24)#67 | 9.3%(+8.72)#2,741 |
| 68. | Lawrenceville | 17.8% | 9.8%(+8.01)#68 | 9.3%(+8.48)#2,821 |
| 69. | Lyndhurst | 17.7% | 9.8%(+7.87)#69 | 9.3%(+8.34)#2,875 |
| 70. | Singers Glen | 17.6% | 9.8%(+7.86)#70 | 9.3%(+8.33)#2,882 |
| 71. | Keezletown | 17.6% | 9.8%(+7.83)#71 | 9.3%(+8.30)#2,899 |
| 72. | Bridgewater | 17.6% | 9.8%(+7.81)#72 | 9.3%(+8.28)#2,911 |
| 73. | Ettrick | 17.3% | 9.8%(+7.56)#73 | 9.3%(+8.03)#3,011 |
| 74. | Remington | 17.3% | 9.8%(+7.54)#74 | 9.3%(+8.01)#3,018 |
| 75. | Riner | 17.3% | 9.8%(+7.49)#75 | 9.3%(+7.97)#3,044 |
| 76. | Esmont | 17.2% | 9.8%(+7.45)#76 | 9.3%(+7.93)#3,059 |
| 77. | Boissevain | 17.2% | 9.8%(+7.37)#77 | 9.3%(+7.84)#3,096 |
| 78. | Nokesville | 17.2% | 9.8%(+7.37)#78 | 9.3%(+7.84)#3,098 |
| 79. | Burke Centre | 16.9% | 9.8%(+7.12)#79 | 9.3%(+7.59)#3,214 |
| 80. | Callaghan | 16.9% | 9.8%(+7.12)#80 | 9.3%(+7.59)#3,215 |
| 81. | Pembroke | 16.9% | 9.8%(+7.12)#81 | 9.3%(+7.59)#3,216 |
| 82. | Lebanon | 16.9% | 9.8%(+7.09)#82 | 9.3%(+7.56)#3,234 |
| 83. | Vansant | 16.8% | 9.8%(+7.04)#83 | 9.3%(+7.52)#3,253 |
| 84. | Montross | 16.8% | 9.8%(+7.04)#84 | 9.3%(+7.51)#3,258 |
| 85. | Lake Monticello | 16.8% | 9.8%(+7.03)#85 | 9.3%(+7.50)#3,260 |
| 86. | Lake Wilderness | 16.7% | 9.8%(+6.92)#86 | 9.3%(+7.39)#3,303 |
| 87. | Bluefield | 16.7% | 9.8%(+6.91)#87 | 9.3%(+7.39)#3,307 |
| 88. | West Point | 16.7% | 9.8%(+6.91)#88 | 9.3%(+7.38)#3,309 |
| 89. | Wise | 16.7% | 9.8%(+6.91)#89 | 9.3%(+7.38)#3,310 |
| 90. | East Lexington | 16.7% | 9.8%(+6.90)#90 | 9.3%(+7.37)#3,313 |
| 91. | Ruckersville | 16.7% | 9.8%(+6.88)#91 | 9.3%(+7.35)#3,318 |
| 92. | Ashland | 16.6% | 9.8%(+6.81)#92 | 9.3%(+7.28)#3,405 |
| 93. | Shenandoah Farms | 16.4% | 9.8%(+6.58)#93 | 9.3%(+7.05)#3,504 |
| 94. | Chilhowie | 16.3% | 9.8%(+6.56)#94 | 9.3%(+7.03)#3,515 |
| 95. | Wintergreen | 16.3% | 9.8%(+6.49)#95 | 9.3%(+6.96)#3,548 |
| 96. | Kings Park West | 16.3% | 9.8%(+6.48)#96 | 9.3%(+6.95)#3,557 |
| 97. | Eastville | 16.1% | 9.8%(+6.28)#97 | 9.3%(+6.76)#3,682 |
| 98. | Meadowview | 16.0% | 9.8%(+6.19)#98 | 9.3%(+6.67)#3,732 |
| 99. | Bowling Green | 15.9% | 9.8%(+6.13)#99 | 9.3%(+6.60)#3,761 |
| 100. | Rivanna | 15.8% | 9.8%(+6.01)#100 | 9.3%(+6.48)#3,828 |
Common Questions
What are the Top 10 Cities with the Highest Percentage of Population Employed in Educational Services in Virginia?
Top 10 Cities with the Highest Percentage of Population Employed in Educational Services in Virginia are:
#1
100.0%
#2
70.5%
#3
54.5%
#4
49.9%
#5
43.0%
#6
42.7%
#7
42.0%
#8
41.9%
#9
41.6%
#10
38.9%
What city has the Highest Percentage of Population Employed in Educational Services in Virginia?
Free Union has the Highest Percentage of Population Employed in Educational Services in Virginia with 100.0%.
What is the Percentage of Population Employed in Educational Services in the State of Virginia?
Percentage of Population Employed in Educational Services in Virginia is 9.8%.
What is the Percentage of Population Employed in Educational Services in the United States?
Percentage of Population Employed in Educational Services in the United States is 9.3%.