Cities with the Highest Percentage of Bhutanese Population in Michigan
RELATED REPORTS & OPTIONS
Bhutanese
Michigan
Compare Cities
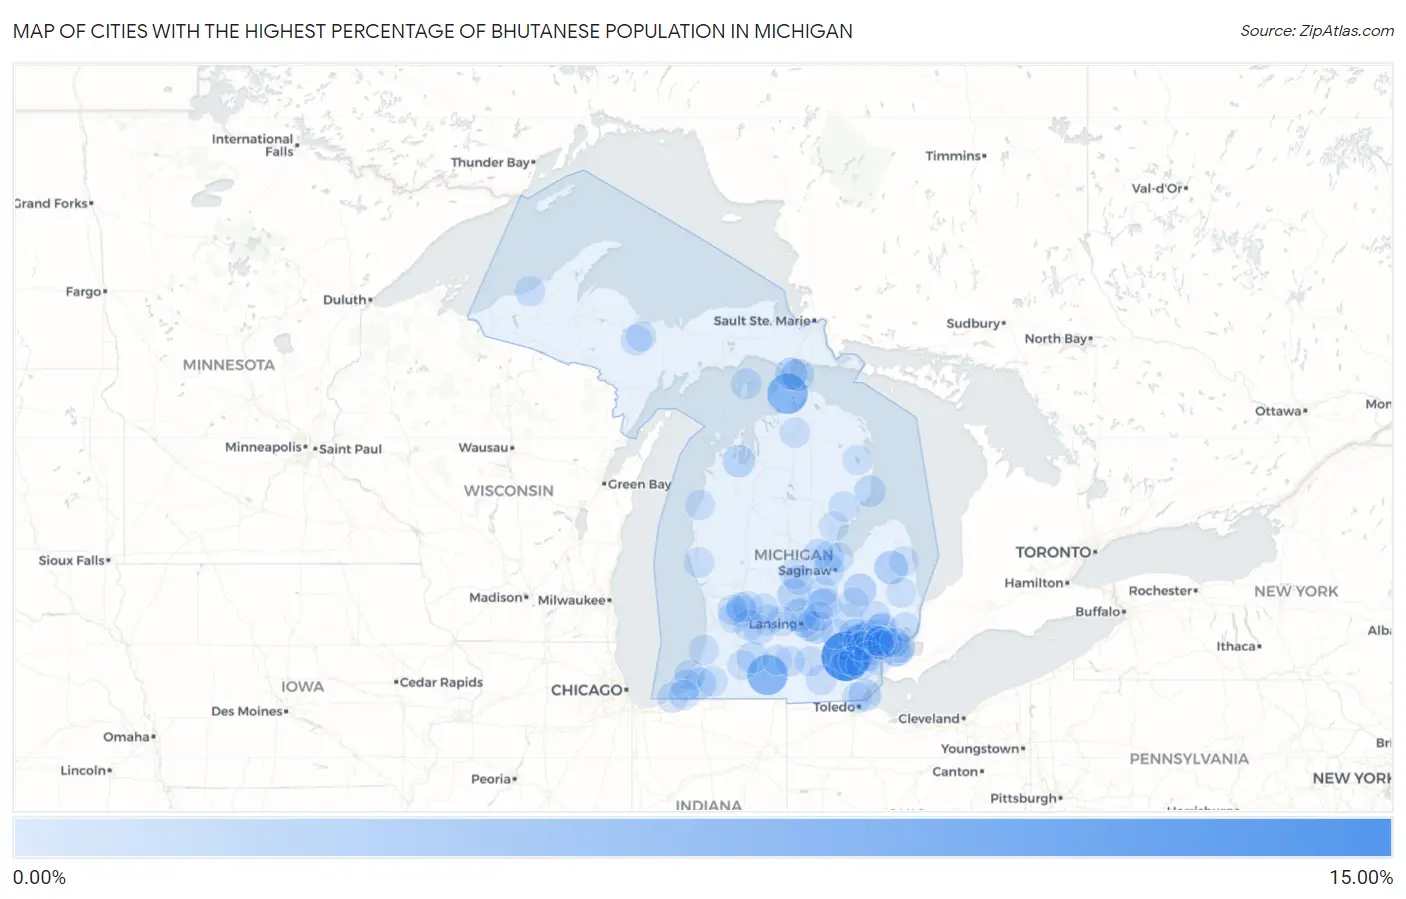
Map of Cities with the Highest Percentage of Bhutanese Population in Michigan
0.00%
15.00%
Cities with the Highest Percentage of Bhutanese Population in Michigan
| City | Bhutanese | vs State | vs National | |
| 1. | Barton Hills | 14.64% | 0.24%(+14.4)#1 | 0.49%(+14.2)#88 |
| 2. | Rapid River | 14.43% | 0.24%(+14.2)#2 | 0.49%(+13.9)#91 |
| 3. | Levering | 7.69% | 0.24%(+7.45)#3 | 0.49%(+7.20)#178 |
| 4. | Union City | 7.61% | 0.24%(+7.37)#4 | 0.49%(+7.12)#179 |
| 5. | Mass | 5.59% | 0.24%(+5.35)#5 | 0.49%(+5.10)#247 |
| 6. | Naubinway | 5.33% | 0.24%(+5.09)#6 | 0.49%(+4.85)#264 |
| 7. | Novi | 4.97% | 0.24%(+4.73)#7 | 0.49%(+4.48)#281 |
| 8. | Snover | 2.69% | 0.24%(+2.45)#8 | 0.49%(+2.20)#525 |
| 9. | Dewitt | 2.28% | 0.24%(+2.04)#9 | 0.49%(+1.79)#644 |
| 10. | Maple Rapids | 2.23% | 0.24%(+1.98)#10 | 0.49%(+1.74)#670 |
| 11. | Otisville | 2.20% | 0.24%(+1.96)#11 | 0.49%(+1.71)#680 |
| 12. | Mackinac Island | 2.15% | 0.24%(+1.91)#12 | 0.49%(+1.67)#707 |
| 13. | Williamston | 1.94% | 0.24%(+1.70)#13 | 0.49%(+1.45)#797 |
| 14. | Luna Pier | 1.88% | 0.24%(+1.64)#14 | 0.49%(+1.39)#827 |
| 15. | Greilickville | 1.84% | 0.24%(+1.60)#15 | 0.49%(+1.35)#853 |
| 16. | St Ignace | 1.84% | 0.24%(+1.60)#16 | 0.49%(+1.35)#857 |
| 17. | Grosse Pointe Farms | 1.79% | 0.24%(+1.55)#17 | 0.49%(+1.30)#891 |
| 18. | Milford | 1.73% | 0.24%(+1.49)#18 | 0.49%(+1.24)#934 |
| 19. | Middletown | 1.53% | 0.24%(+1.29)#19 | 0.49%(+1.04)#1,097 |
| 20. | Berrien Springs | 1.48% | 0.24%(+1.24)#20 | 0.49%(+0.996)#1,132 |
| 21. | Oscoda | 1.42% | 0.24%(+1.18)#21 | 0.49%(+0.929)#1,186 |
| 22. | Galesburg | 1.30% | 0.24%(+1.06)#22 | 0.49%(+0.817)#1,299 |
| 23. | Farmington | 1.20% | 0.24%(+0.961)#23 | 0.49%(+0.714)#1,411 |
| 24. | Farmington Hills | 1.14% | 0.24%(+0.904)#24 | 0.49%(+0.657)#1,488 |
| 25. | Shields | 1.13% | 0.24%(+0.888)#25 | 0.49%(+0.641)#1,502 |
| 26. | Kincheloe | 1.06% | 0.24%(+0.823)#26 | 0.49%(+0.576)#1,572 |
| 27. | Ann Arbor | 1.05% | 0.24%(+0.808)#27 | 0.49%(+0.561)#1,596 |
| 28. | Bingham Farms | 1.05% | 0.24%(+0.807)#28 | 0.49%(+0.560)#1,597 |
| 29. | Kentwood | 0.95% | 0.24%(+0.712)#29 | 0.49%(+0.465)#1,772 |
| 30. | Bridgman | 0.93% | 0.24%(+0.685)#30 | 0.49%(+0.438)#1,828 |
| 31. | Lake Odessa | 0.89% | 0.24%(+0.652)#31 | 0.49%(+0.405)#1,907 |
| 32. | Auburn | 0.88% | 0.24%(+0.644)#32 | 0.49%(+0.397)#1,921 |
| 33. | St James | 0.88% | 0.24%(+0.644)#33 | 0.49%(+0.397)#1,922 |
| 34. | Grosse Pointe | 0.87% | 0.24%(+0.631)#34 | 0.49%(+0.384)#1,963 |
| 35. | Shoreham | 0.87% | 0.24%(+0.628)#35 | 0.49%(+0.381)#1,970 |
| 36. | Alma | 0.82% | 0.24%(+0.576)#36 | 0.49%(+0.329)#2,092 |
| 37. | Gwinn | 0.80% | 0.24%(+0.562)#37 | 0.49%(+0.315)#2,121 |
| 38. | Byron Center | 0.80% | 0.24%(+0.561)#38 | 0.49%(+0.314)#2,129 |
| 39. | Oakley | 0.74% | 0.24%(+0.500)#39 | 0.49%(+0.253)#2,277 |
| 40. | Troy | 0.71% | 0.24%(+0.471)#40 | 0.49%(+0.224)#2,344 |
| 41. | Michiana | 0.70% | 0.24%(+0.461)#41 | 0.49%(+0.214)#2,373 |
| 42. | Okemos | 0.68% | 0.24%(+0.437)#42 | 0.49%(+0.190)#2,432 |
| 43. | Wolverine Lake | 0.67% | 0.24%(+0.427)#43 | 0.49%(+0.180)#2,455 |
| 44. | Wixom | 0.66% | 0.24%(+0.418)#44 | 0.49%(+0.171)#2,480 |
| 45. | Village Of Grosse Pointe Shores | 0.65% | 0.24%(+0.411)#45 | 0.49%(+0.164)#2,502 |
| 46. | Orchard Lake Village | 0.64% | 0.24%(+0.400)#46 | 0.49%(+0.153)#2,538 |
| 47. | East Lansing | 0.63% | 0.24%(+0.392)#47 | 0.49%(+0.145)#2,577 |
| 48. | Vanderbilt | 0.61% | 0.24%(+0.366)#48 | 0.49%(+0.119)#2,656 |
| 49. | Rochester | 0.60% | 0.24%(+0.361)#49 | 0.49%(+0.114)#2,674 |
| 50. | Rochester Hills | 0.58% | 0.24%(+0.337)#50 | 0.49%(+0.090)#2,746 |
| 51. | Forest Hills | 0.58% | 0.24%(+0.336)#51 | 0.49%(+0.089)#2,748 |
| 52. | Mulliken | 0.57% | 0.24%(+0.331)#52 | 0.49%(+0.084)#2,769 |
| 53. | Middleville | 0.56% | 0.24%(+0.323)#53 | 0.49%(+0.076)#2,820 |
| 54. | Rothbury | 0.56% | 0.24%(+0.323)#54 | 0.49%(+0.076)#2,822 |
| 55. | Midland | 0.54% | 0.24%(+0.295)#55 | 0.49%(+0.048)#2,934 |
| 56. | South Haven | 0.53% | 0.24%(+0.285)#56 | 0.49%(+0.038)#2,979 |
| 57. | Saline | 0.52% | 0.24%(+0.283)#57 | 0.49%(+0.036)#2,983 |
| 58. | Onsted | 0.52% | 0.24%(+0.283)#58 | 0.49%(+0.036)#2,987 |
| 59. | Jackson | 0.51% | 0.24%(+0.266)#59 | 0.49%(+0.019)#3,054 |
| 60. | Three Oaks | 0.50% | 0.24%(+0.257)#60 | 0.49%(+0.010)#3,092 |
| 61. | Howell | 0.50% | 0.24%(+0.256)#61 | 0.49%(+0.009)#3,094 |
| 62. | K I Sawyer | 0.49% | 0.24%(+0.254)#62 | 0.49%(+0.007)#3,111 |
| 63. | Albion | 0.49% | 0.24%(+0.251)#63 | 0.49%(+0.004)#3,125 |
| 64. | Clawson | 0.47% | 0.24%(+0.234)#64 | 0.49%(-0.013)#3,210 |
| 65. | Ontonagon | 0.47% | 0.24%(+0.225)#65 | 0.49%(-0.022)#3,247 |
| 66. | Whittemore | 0.46% | 0.24%(+0.221)#66 | 0.49%(-0.026)#3,267 |
| 67. | Temperance | 0.46% | 0.24%(+0.220)#67 | 0.49%(-0.027)#3,277 |
| 68. | Livonia | 0.45% | 0.24%(+0.214)#68 | 0.49%(-0.033)#3,309 |
| 69. | Belleville | 0.45% | 0.24%(+0.212)#69 | 0.49%(-0.035)#3,316 |
| 70. | Oak Park | 0.43% | 0.24%(+0.190)#70 | 0.49%(-0.057)#3,433 |
| 71. | Oxford | 0.43% | 0.24%(+0.190)#71 | 0.49%(-0.057)#3,436 |
| 72. | Hastings | 0.41% | 0.24%(+0.173)#72 | 0.49%(-0.074)#3,512 |
| 73. | Grandville | 0.41% | 0.24%(+0.172)#73 | 0.49%(-0.075)#3,518 |
| 74. | Saranac | 0.41% | 0.24%(+0.171)#74 | 0.49%(-0.076)#3,525 |
| 75. | Dowagiac | 0.40% | 0.24%(+0.164)#75 | 0.49%(-0.083)#3,570 |
| 76. | East Grand Rapids | 0.40% | 0.24%(+0.164)#76 | 0.49%(-0.083)#3,573 |
| 77. | Owosso | 0.38% | 0.24%(+0.141)#77 | 0.49%(-0.106)#3,695 |
| 78. | Beverly Hills | 0.38% | 0.24%(+0.139)#78 | 0.49%(-0.108)#3,703 |
| 79. | Fenton | 0.38% | 0.24%(+0.136)#79 | 0.49%(-0.111)#3,724 |
| 80. | Portage | 0.38% | 0.24%(+0.136)#80 | 0.49%(-0.111)#3,725 |
| 81. | Royal Oak | 0.36% | 0.24%(+0.116)#81 | 0.49%(-0.131)#3,838 |
| 82. | New Baltimore | 0.36% | 0.24%(+0.115)#82 | 0.49%(-0.132)#3,854 |
| 83. | Ithaca | 0.35% | 0.24%(+0.112)#83 | 0.49%(-0.135)#3,879 |
| 84. | Northville | 0.34% | 0.24%(+0.104)#84 | 0.49%(-0.143)#3,928 |
| 85. | Yale | 0.34% | 0.24%(+0.101)#85 | 0.49%(-0.146)#3,954 |
| 86. | Ypsilanti | 0.33% | 0.24%(+0.091)#86 | 0.49%(-0.156)#4,021 |
| 87. | Hubbard Lake | 0.33% | 0.24%(+0.091)#87 | 0.49%(-0.156)#4,027 |
| 88. | Standish | 0.32% | 0.24%(+0.082)#88 | 0.49%(-0.165)#4,079 |
| 89. | Manistee | 0.32% | 0.24%(+0.080)#89 | 0.49%(-0.167)#4,087 |
| 90. | Allen Park | 0.31% | 0.24%(+0.073)#90 | 0.49%(-0.174)#4,136 |
| 91. | Perry | 0.31% | 0.24%(+0.066)#91 | 0.49%(-0.181)#4,193 |
| 92. | Westland | 0.31% | 0.24%(+0.065)#92 | 0.49%(-0.182)#4,203 |
| 93. | Center Line | 0.29% | 0.24%(+0.054)#93 | 0.49%(-0.193)#4,272 |
| 94. | Burton | 0.29% | 0.24%(+0.054)#94 | 0.49%(-0.193)#4,274 |
| 95. | Berkley | 0.29% | 0.24%(+0.050)#95 | 0.49%(-0.197)#4,304 |
| 96. | Deckerville | 0.28% | 0.24%(+0.043)#96 | 0.49%(-0.204)#4,351 |
| 97. | Marshall | 0.28% | 0.24%(+0.039)#97 | 0.49%(-0.208)#4,379 |
| 98. | Bay City | 0.28% | 0.24%(+0.038)#98 | 0.49%(-0.209)#4,382 |
| 99. | Ferndale | 0.28% | 0.24%(+0.035)#99 | 0.49%(-0.212)#4,404 |
| 100. | St Clair Shores | 0.27% | 0.24%(+0.034)#100 | 0.49%(-0.213)#4,408 |
Common Questions
What are the Top 10 Cities with the Highest Percentage of Bhutanese Population in Michigan?
Top 10 Cities with the Highest Percentage of Bhutanese Population in Michigan are:
#1
14.64%
#2
7.69%
#3
7.61%
#4
4.97%
#5
2.69%
#6
2.28%
#7
2.23%
#8
2.20%
#9
2.15%
#10
1.94%
What city has the Highest Percentage of Bhutanese Population in Michigan?
Barton Hills has the Highest Percentage of Bhutanese Population in Michigan with 14.64%.
What is the Percentage of Bhutanese Population in the State of Michigan?
Percentage of Bhutanese Population in Michigan is 0.24%.
What is the Percentage of Bhutanese Population in the United States?
Percentage of Bhutanese Population in the United States is 0.49%.