Cities with the Highest Percentage of Bhutanese Population in Utah
RELATED REPORTS & OPTIONS
Bhutanese
Utah
Compare Cities
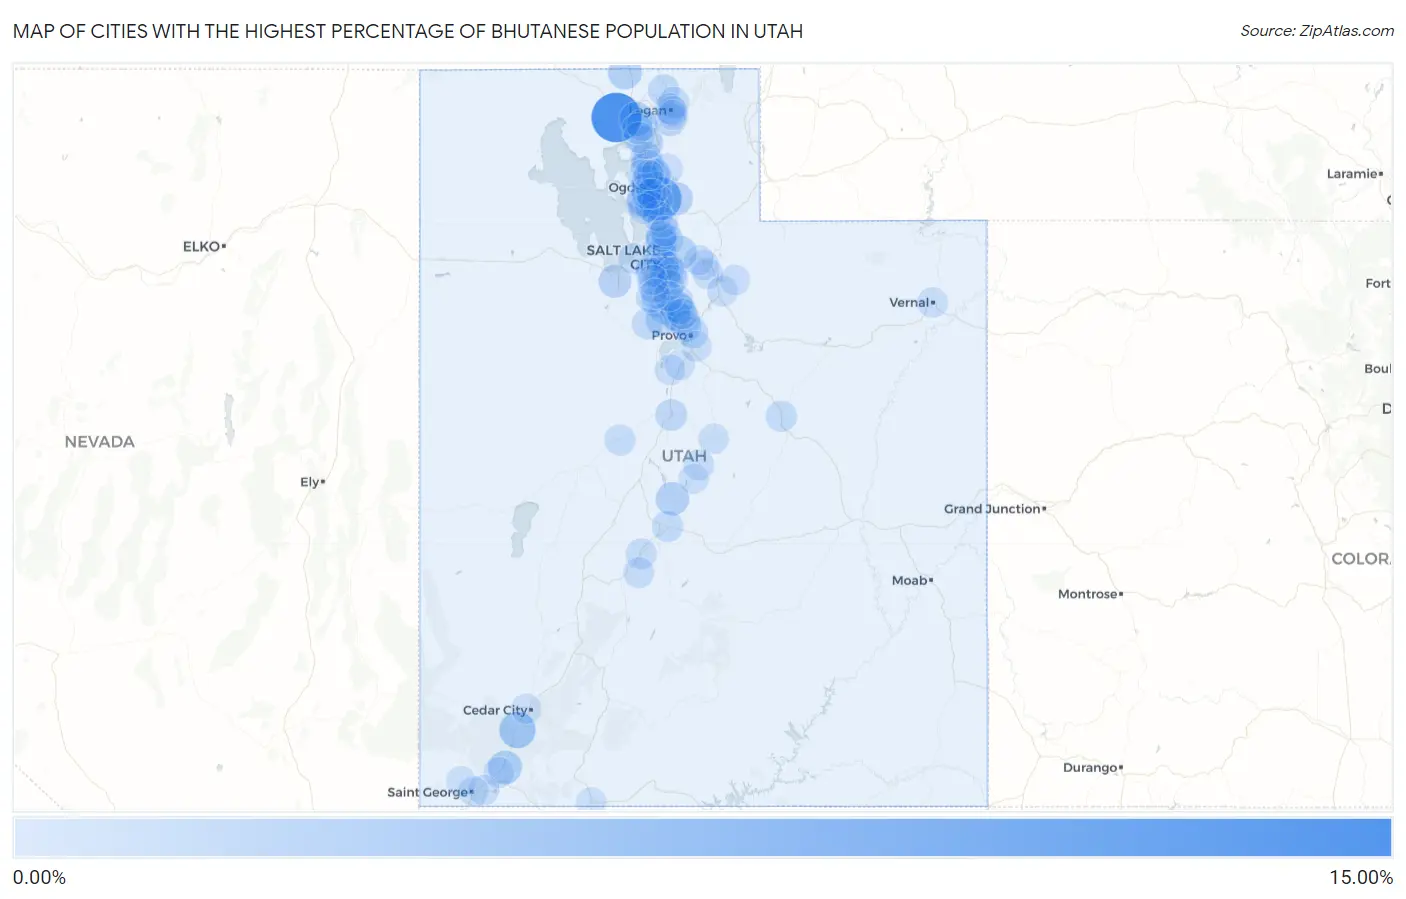
Map of Cities with the Highest Percentage of Bhutanese Population in Utah
0.00%
15.00%
Cities with the Highest Percentage of Bhutanese Population in Utah
| City | Bhutanese | vs State | vs National | |
| 1. | Thatcher | 12.22% | 0.57%(+11.6)#1 | 0.49%(+11.7)#113 |
| 2. | Uintah | 8.13% | 0.57%(+7.56)#2 | 0.49%(+7.64)#171 |
| 3. | Kanarraville | 3.98% | 0.57%(+3.40)#3 | 0.49%(+3.49)#353 |
| 4. | Portage | 2.39% | 0.57%(+1.82)#4 | 0.49%(+1.90)#603 |
| 5. | Toquerville | 2.36% | 0.57%(+1.79)#5 | 0.49%(+1.87)#617 |
| 6. | Elwood | 2.32% | 0.57%(+1.74)#6 | 0.49%(+1.83)#631 |
| 7. | Emigration Canyon | 2.26% | 0.57%(+1.69)#7 | 0.49%(+1.77)#653 |
| 8. | Harrisville | 2.26% | 0.57%(+1.69)#8 | 0.49%(+1.77)#655 |
| 9. | Centerfield | 2.14% | 0.57%(+1.57)#9 | 0.49%(+1.66)#710 |
| 10. | Brigham City | 2.05% | 0.57%(+1.47)#10 | 0.49%(+1.56)#756 |
| 11. | Mountain Green | 2.00% | 0.57%(+1.43)#11 | 0.49%(+1.51)#769 |
| 12. | Clinton | 1.86% | 0.57%(+1.28)#12 | 0.49%(+1.37)#836 |
| 13. | South Willard | 1.81% | 0.57%(+1.24)#13 | 0.49%(+1.32)#875 |
| 14. | Erda | 1.73% | 0.57%(+1.16)#14 | 0.49%(+1.24)#933 |
| 15. | Highland | 1.59% | 0.57%(+1.02)#15 | 0.49%(+1.10)#1,051 |
| 16. | Lindon | 1.51% | 0.57%(+0.936)#16 | 0.49%(+1.02)#1,109 |
| 17. | Nibley | 1.34% | 0.57%(+0.771)#17 | 0.49%(+0.855)#1,250 |
| 18. | Marriott Slaterville | 1.32% | 0.57%(+0.751)#18 | 0.49%(+0.835)#1,271 |
| 19. | West Haven | 1.25% | 0.57%(+0.683)#19 | 0.49%(+0.767)#1,350 |
| 20. | Bluffdale | 1.23% | 0.57%(+0.660)#20 | 0.49%(+0.744)#1,374 |
| 21. | Nephi | 1.15% | 0.57%(+0.581)#21 | 0.49%(+0.665)#1,474 |
| 22. | North Salt Lake | 1.14% | 0.57%(+0.567)#22 | 0.49%(+0.651)#1,495 |
| 23. | Lehi | 1.12% | 0.57%(+0.545)#23 | 0.49%(+0.629)#1,514 |
| 24. | Saratoga Springs | 1.11% | 0.57%(+0.540)#24 | 0.49%(+0.624)#1,517 |
| 25. | Woods Cross | 1.04% | 0.57%(+0.469)#25 | 0.49%(+0.553)#1,607 |
| 26. | Alpine | 1.01% | 0.57%(+0.442)#26 | 0.49%(+0.526)#1,657 |
| 27. | Amalga | 1.01% | 0.57%(+0.441)#27 | 0.49%(+0.525)#1,661 |
| 28. | American Fork | 0.98% | 0.57%(+0.411)#28 | 0.49%(+0.495)#1,720 |
| 29. | Salt Lake City | 0.96% | 0.57%(+0.388)#29 | 0.49%(+0.472)#1,758 |
| 30. | Provo | 0.96% | 0.57%(+0.385)#30 | 0.49%(+0.469)#1,767 |
| 31. | Bountiful | 0.95% | 0.57%(+0.377)#31 | 0.49%(+0.461)#1,780 |
| 32. | Millcreek | 0.93% | 0.57%(+0.359)#32 | 0.49%(+0.443)#1,814 |
| 33. | Eagle Mountain | 0.93% | 0.57%(+0.357)#33 | 0.49%(+0.441)#1,820 |
| 34. | Layton | 0.92% | 0.57%(+0.352)#34 | 0.49%(+0.436)#1,830 |
| 35. | Willard | 0.91% | 0.57%(+0.341)#35 | 0.49%(+0.425)#1,853 |
| 36. | Honeyville | 0.87% | 0.57%(+0.303)#36 | 0.49%(+0.387)#1,954 |
| 37. | Salina | 0.84% | 0.57%(+0.268)#37 | 0.49%(+0.352)#2,037 |
| 38. | Helper | 0.81% | 0.57%(+0.234)#38 | 0.49%(+0.318)#2,113 |
| 39. | Orem | 0.80% | 0.57%(+0.230)#39 | 0.49%(+0.314)#2,130 |
| 40. | Ogden | 0.80% | 0.57%(+0.230)#40 | 0.49%(+0.314)#2,132 |
| 41. | Murray | 0.79% | 0.57%(+0.222)#41 | 0.49%(+0.306)#2,151 |
| 42. | North Logan | 0.76% | 0.57%(+0.193)#42 | 0.49%(+0.277)#2,221 |
| 43. | West Point | 0.69% | 0.57%(+0.123)#43 | 0.49%(+0.207)#2,392 |
| 44. | Plain City | 0.67% | 0.57%(+0.102)#44 | 0.49%(+0.186)#2,440 |
| 45. | Cedar Hills | 0.67% | 0.57%(+0.100)#45 | 0.49%(+0.184)#2,441 |
| 46. | Richfield | 0.67% | 0.57%(+0.098)#46 | 0.49%(+0.182)#2,445 |
| 47. | Brighton | 0.67% | 0.57%(+0.097)#47 | 0.49%(+0.181)#2,450 |
| 48. | Leamington | 0.66% | 0.57%(+0.089)#48 | 0.49%(+0.173)#2,470 |
| 49. | West Bountiful | 0.64% | 0.57%(+0.072)#49 | 0.49%(+0.156)#2,529 |
| 50. | Monroe | 0.63% | 0.57%(+0.061)#50 | 0.49%(+0.145)#2,573 |
| 51. | Midvale | 0.62% | 0.57%(+0.044)#51 | 0.49%(+0.128)#2,635 |
| 52. | Magna | 0.60% | 0.57%(+0.026)#52 | 0.49%(+0.110)#2,684 |
| 53. | Logan | 0.60% | 0.57%(+0.026)#53 | 0.49%(+0.110)#2,685 |
| 54. | West Valley City | 0.57% | 0.57%(-0.000)#54 | 0.49%(+0.084)#2,771 |
| 55. | Taylorsville | 0.56% | 0.57%(-0.011)#55 | 0.49%(+0.073)#2,833 |
| 56. | South Salt Lake | 0.55% | 0.57%(-0.024)#56 | 0.49%(+0.060)#2,883 |
| 57. | Ephraim | 0.54% | 0.57%(-0.031)#57 | 0.49%(+0.053)#2,916 |
| 58. | Sandy | 0.53% | 0.57%(-0.043)#58 | 0.49%(+0.041)#2,968 |
| 59. | Corinne | 0.51% | 0.57%(-0.057)#59 | 0.49%(+0.027)#3,014 |
| 60. | Bear River City | 0.51% | 0.57%(-0.058)#60 | 0.49%(+0.026)#3,021 |
| 61. | Leeds | 0.50% | 0.57%(-0.070)#61 | 0.49%(+0.014)#3,074 |
| 62. | Pleasant Grove | 0.50% | 0.57%(-0.072)#62 | 0.49%(+0.012)#3,084 |
| 63. | Herriman | 0.49% | 0.57%(-0.078)#63 | 0.49%(+0.006)#3,116 |
| 64. | Park City | 0.49% | 0.57%(-0.082)#64 | 0.49%(+0.002)#3,139 |
| 65. | South Weber | 0.48% | 0.57%(-0.093)#65 | 0.49%(-0.009)#3,188 |
| 66. | Springville | 0.47% | 0.57%(-0.103)#66 | 0.49%(-0.019)#3,229 |
| 67. | Clearfield | 0.45% | 0.57%(-0.120)#67 | 0.49%(-0.036)#3,327 |
| 68. | Cottonwood Heights | 0.44% | 0.57%(-0.136)#68 | 0.49%(-0.052)#3,399 |
| 69. | Heber | 0.42% | 0.57%(-0.152)#69 | 0.49%(-0.068)#3,482 |
| 70. | Liberty | 0.41% | 0.57%(-0.160)#70 | 0.49%(-0.076)#3,524 |
| 71. | Vernal | 0.38% | 0.57%(-0.187)#71 | 0.49%(-0.103)#3,674 |
| 72. | South Jordan | 0.38% | 0.57%(-0.187)#72 | 0.49%(-0.103)#3,678 |
| 73. | Holladay | 0.38% | 0.57%(-0.194)#73 | 0.49%(-0.110)#3,719 |
| 74. | Farmington | 0.38% | 0.57%(-0.195)#74 | 0.49%(-0.111)#3,723 |
| 75. | Snyderville | 0.37% | 0.57%(-0.205)#75 | 0.49%(-0.121)#3,771 |
| 76. | Kaysville | 0.34% | 0.57%(-0.232)#76 | 0.49%(-0.148)#3,967 |
| 77. | Centerville | 0.33% | 0.57%(-0.237)#77 | 0.49%(-0.153)#4,002 |
| 78. | Roy | 0.32% | 0.57%(-0.249)#78 | 0.49%(-0.165)#4,078 |
| 79. | Francis | 0.32% | 0.57%(-0.254)#79 | 0.49%(-0.170)#4,105 |
| 80. | River Heights | 0.31% | 0.57%(-0.258)#80 | 0.49%(-0.174)#4,139 |
| 81. | Washington | 0.31% | 0.57%(-0.259)#81 | 0.49%(-0.175)#4,151 |
| 82. | Genola | 0.30% | 0.57%(-0.268)#82 | 0.49%(-0.184)#4,217 |
| 83. | Mount Pleasant | 0.30% | 0.57%(-0.272)#83 | 0.49%(-0.188)#4,244 |
| 84. | Kanab | 0.27% | 0.57%(-0.302)#84 | 0.49%(-0.218)#4,440 |
| 85. | Draper | 0.27% | 0.57%(-0.303)#85 | 0.49%(-0.219)#4,449 |
| 86. | Syracuse | 0.26% | 0.57%(-0.309)#86 | 0.49%(-0.225)#4,500 |
| 87. | North Ogden | 0.26% | 0.57%(-0.310)#87 | 0.49%(-0.226)#4,509 |
| 88. | Manti | 0.26% | 0.57%(-0.312)#88 | 0.49%(-0.228)#4,523 |
| 89. | Payson | 0.25% | 0.57%(-0.321)#89 | 0.49%(-0.237)#4,593 |
| 90. | Cedar City | 0.25% | 0.57%(-0.326)#90 | 0.49%(-0.242)#4,634 |
| 91. | Kearns | 0.24% | 0.57%(-0.327)#91 | 0.49%(-0.243)#4,651 |
| 92. | Providence | 0.23% | 0.57%(-0.346)#92 | 0.49%(-0.262)#4,816 |
| 93. | Ivins | 0.22% | 0.57%(-0.353)#93 | 0.49%(-0.269)#4,876 |
| 94. | White | 0.22% | 0.57%(-0.356)#94 | 0.49%(-0.272)#4,898 |
| 95. | West Jordan | 0.21% | 0.57%(-0.364)#95 | 0.49%(-0.280)#4,964 |
| 96. | Farr West | 0.21% | 0.57%(-0.365)#96 | 0.49%(-0.281)#4,971 |
| 97. | St George | 0.20% | 0.57%(-0.373)#97 | 0.49%(-0.289)#5,041 |
| 98. | Summit Park | 0.18% | 0.57%(-0.388)#98 | 0.49%(-0.304)#5,192 |
| 99. | Riverdale | 0.18% | 0.57%(-0.389)#99 | 0.49%(-0.305)#5,208 |
| 100. | Riverton | 0.17% | 0.57%(-0.402)#100 | 0.49%(-0.318)#5,333 |
1
2Common Questions
What are the Top 10 Cities with the Highest Percentage of Bhutanese Population in Utah?
Top 10 Cities with the Highest Percentage of Bhutanese Population in Utah are:
#1
12.22%
#2
8.13%
#3
3.98%
#4
2.39%
#5
2.36%
#6
2.32%
#7
2.26%
#8
2.26%
#9
2.14%
#10
2.05%
What city has the Highest Percentage of Bhutanese Population in Utah?
Thatcher has the Highest Percentage of Bhutanese Population in Utah with 12.22%.
What is the Percentage of Bhutanese Population in the State of Utah?
Percentage of Bhutanese Population in Utah is 0.57%.
What is the Percentage of Bhutanese Population in the United States?
Percentage of Bhutanese Population in the United States is 0.49%.