Cities with the Highest Percentage of Bhutanese Population in North Carolina
RELATED REPORTS & OPTIONS
Bhutanese
North Carolina
Compare Cities
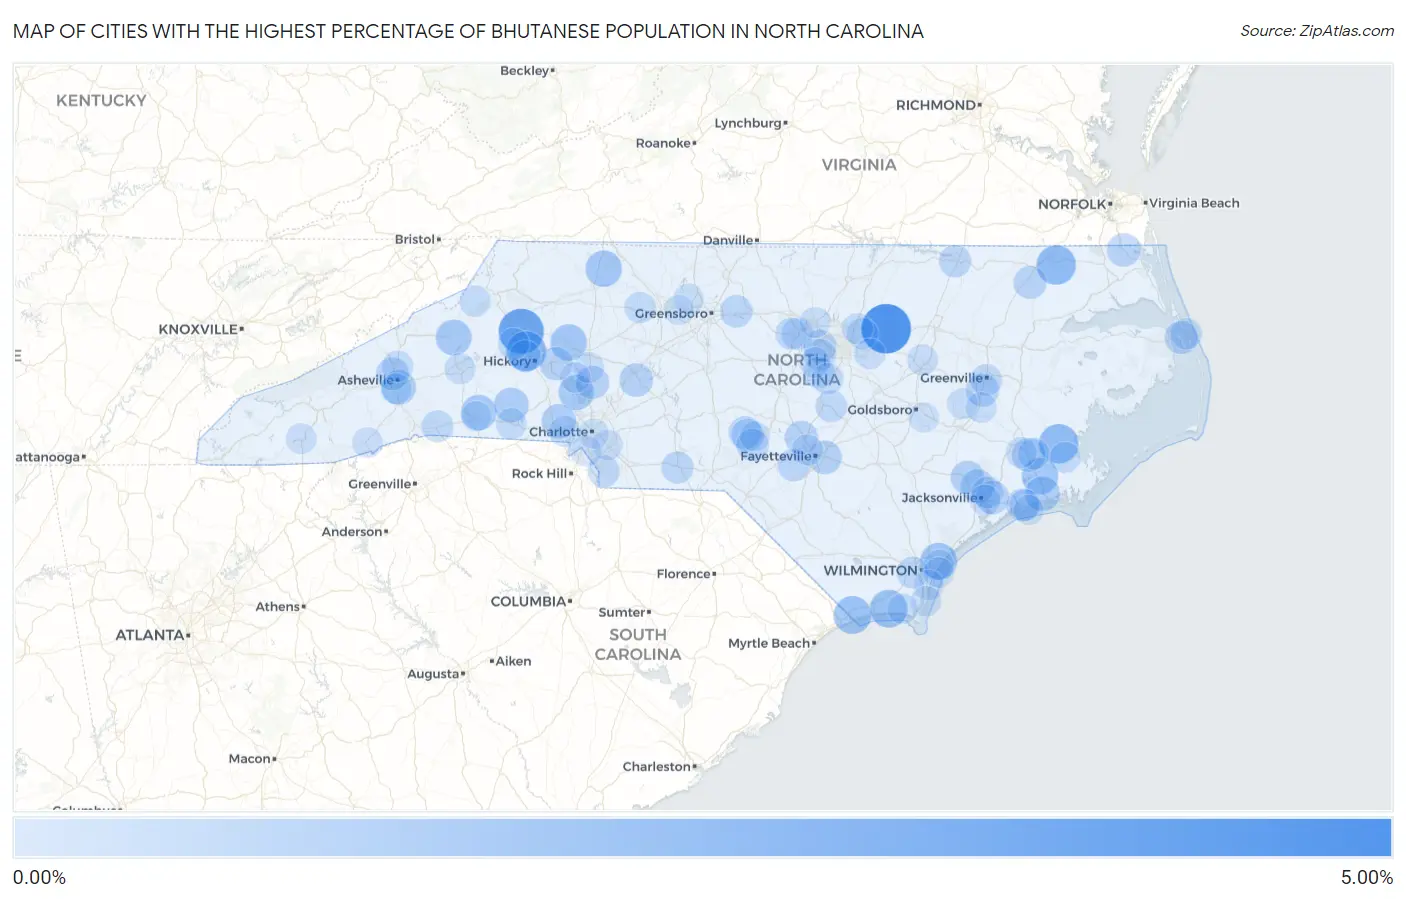
Map of Cities with the Highest Percentage of Bhutanese Population in North Carolina
0.00%
5.00%
Cities with the Highest Percentage of Bhutanese Population in North Carolina
| City | Bhutanese | vs State | vs National | |
| 1. | Governors | 4.57% | 0.19%(+4.38)#1 | 0.49%(+4.08)#304 |
| 2. | Bunn | 4.39% | 0.19%(+4.20)#2 | 0.49%(+3.91)#318 |
| 3. | Cedar Rock | 3.42% | 0.19%(+3.23)#3 | 0.49%(+2.94)#396 |
| 4. | Granite Falls | 2.29% | 0.19%(+2.10)#4 | 0.49%(+1.80)#640 |
| 5. | Stonewall | 2.18% | 0.19%(+1.99)#5 | 0.49%(+1.70)#688 |
| 6. | Gatesville | 2.17% | 0.19%(+1.97)#6 | 0.49%(+1.68)#701 |
| 7. | Calabash | 1.83% | 0.19%(+1.64)#7 | 0.49%(+1.34)#864 |
| 8. | Varnamtown | 1.81% | 0.19%(+1.62)#8 | 0.49%(+1.32)#878 |
| 9. | Bayshore | 1.60% | 0.19%(+1.41)#9 | 0.49%(+1.11)#1,042 |
| 10. | Havelock | 1.55% | 0.19%(+1.35)#10 | 0.49%(+1.06)#1,086 |
| 11. | Stony Point | 1.54% | 0.19%(+1.35)#11 | 0.49%(+1.05)#1,091 |
| 12. | Dobson | 1.49% | 0.19%(+1.30)#12 | 0.49%(+1.00)#1,126 |
| 13. | Spruce Pine | 1.40% | 0.19%(+1.21)#13 | 0.49%(+0.916)#1,199 |
| 14. | Bostic | 1.32% | 0.19%(+1.12)#14 | 0.49%(+0.828)#1,282 |
| 15. | Westport | 1.29% | 0.19%(+1.10)#15 | 0.49%(+0.804)#1,310 |
| 16. | Briar Chapel | 1.20% | 0.19%(+1.01)#16 | 0.49%(+0.713)#1,412 |
| 17. | Newport | 1.18% | 0.19%(+0.988)#17 | 0.49%(+0.692)#1,434 |
| 18. | Lawndale | 1.17% | 0.19%(+0.976)#18 | 0.49%(+0.681)#1,450 |
| 19. | Biltmore Forest | 1.12% | 0.19%(+0.926)#19 | 0.49%(+0.630)#1,512 |
| 20. | Ranlo | 1.07% | 0.19%(+0.878)#20 | 0.49%(+0.582)#1,568 |
| 21. | Alexis | 1.05% | 0.19%(+0.861)#21 | 0.49%(+0.565)#1,589 |
| 22. | Half Moon | 0.97% | 0.19%(+0.774)#22 | 0.49%(+0.479)#1,748 |
| 23. | Vander | 0.95% | 0.19%(+0.753)#23 | 0.49%(+0.458)#1,783 |
| 24. | James City | 0.94% | 0.19%(+0.753)#24 | 0.49%(+0.457)#1,784 |
| 25. | Richlands | 0.93% | 0.19%(+0.739)#25 | 0.49%(+0.444)#1,812 |
| 26. | Faith | 0.91% | 0.19%(+0.720)#26 | 0.49%(+0.425)#1,854 |
| 27. | Piney Green | 0.89% | 0.19%(+0.702)#27 | 0.49%(+0.406)#1,902 |
| 28. | Moyock | 0.89% | 0.19%(+0.702)#28 | 0.49%(+0.406)#1,903 |
| 29. | Springdale | 0.89% | 0.19%(+0.700)#29 | 0.49%(+0.405)#1,908 |
| 30. | Spring Lake | 0.87% | 0.19%(+0.679)#30 | 0.49%(+0.384)#1,965 |
| 31. | Mooresville | 0.85% | 0.19%(+0.661)#31 | 0.49%(+0.366)#2,004 |
| 32. | Claremont | 0.84% | 0.19%(+0.649)#32 | 0.49%(+0.354)#2,033 |
| 33. | Manteo | 0.83% | 0.19%(+0.638)#33 | 0.49%(+0.342)#2,055 |
| 34. | Winterville | 0.82% | 0.19%(+0.626)#34 | 0.49%(+0.331)#2,087 |
| 35. | Ahoskie | 0.78% | 0.19%(+0.593)#35 | 0.49%(+0.297)#2,171 |
| 36. | Woodfin | 0.77% | 0.19%(+0.580)#36 | 0.49%(+0.285)#2,208 |
| 37. | Cape Carteret | 0.75% | 0.19%(+0.562)#37 | 0.49%(+0.267)#2,244 |
| 38. | Morrisville | 0.75% | 0.19%(+0.554)#38 | 0.49%(+0.259)#2,264 |
| 39. | Taylortown | 0.73% | 0.19%(+0.540)#39 | 0.49%(+0.244)#2,299 |
| 40. | Rockfish | 0.73% | 0.19%(+0.536)#40 | 0.49%(+0.241)#2,304 |
| 41. | Pinehurst | 0.71% | 0.19%(+0.516)#41 | 0.49%(+0.221)#2,352 |
| 42. | Aberdeen | 0.69% | 0.19%(+0.500)#42 | 0.49%(+0.204)#2,399 |
| 43. | Whitsett | 0.69% | 0.19%(+0.499)#43 | 0.49%(+0.203)#2,401 |
| 44. | Wadesboro | 0.62% | 0.19%(+0.427)#44 | 0.49%(+0.132)#2,620 |
| 45. | Roanoke Rapids | 0.61% | 0.19%(+0.422)#45 | 0.49%(+0.127)#2,639 |
| 46. | Spout Springs | 0.61% | 0.19%(+0.415)#46 | 0.49%(+0.119)#2,653 |
| 47. | Waxhaw | 0.58% | 0.19%(+0.384)#47 | 0.49%(+0.088)#2,751 |
| 48. | Greenville | 0.57% | 0.19%(+0.373)#48 | 0.49%(+0.078)#2,805 |
| 49. | Chapel Hill | 0.57% | 0.19%(+0.373)#49 | 0.49%(+0.078)#2,810 |
| 50. | Belville | 0.56% | 0.19%(+0.370)#50 | 0.49%(+0.075)#2,826 |
| 51. | Rhodhiss | 0.56% | 0.19%(+0.367)#51 | 0.49%(+0.071)#2,840 |
| 52. | Pumpkin Center | 0.56% | 0.19%(+0.366)#52 | 0.49%(+0.070)#2,847 |
| 53. | Buies Creek | 0.56% | 0.19%(+0.365)#53 | 0.49%(+0.070)#2,849 |
| 54. | Cary | 0.55% | 0.19%(+0.361)#54 | 0.49%(+0.065)#2,865 |
| 55. | Columbus | 0.55% | 0.19%(+0.360)#55 | 0.49%(+0.064)#2,869 |
| 56. | Carrboro | 0.55% | 0.19%(+0.354)#56 | 0.49%(+0.059)#2,891 |
| 57. | Holly Springs | 0.51% | 0.19%(+0.322)#57 | 0.49%(+0.027)#3,019 |
| 58. | Bogue | 0.49% | 0.19%(+0.299)#58 | 0.49%(+0.003)#3,131 |
| 59. | Cajah S Mountain | 0.48% | 0.19%(+0.287)#59 | 0.49%(-0.009)#3,187 |
| 60. | Nags Head | 0.48% | 0.19%(+0.284)#60 | 0.49%(-0.012)#3,203 |
| 61. | Fuquay Varina | 0.47% | 0.19%(+0.274)#61 | 0.49%(-0.022)#3,243 |
| 62. | Fairfield Harbour | 0.46% | 0.19%(+0.270)#62 | 0.49%(-0.026)#3,269 |
| 63. | Weaverville | 0.44% | 0.19%(+0.247)#63 | 0.49%(-0.049)#3,385 |
| 64. | Lewisville | 0.44% | 0.19%(+0.245)#64 | 0.49%(-0.051)#3,396 |
| 65. | Rolesville | 0.43% | 0.19%(+0.241)#65 | 0.49%(-0.054)#3,418 |
| 66. | Cramerton | 0.42% | 0.19%(+0.223)#66 | 0.49%(-0.072)#3,499 |
| 67. | Oriental | 0.41% | 0.19%(+0.221)#67 | 0.49%(-0.074)#3,511 |
| 68. | Wake Forest | 0.41% | 0.19%(+0.216)#68 | 0.49%(-0.080)#3,551 |
| 69. | Banner Elk | 0.41% | 0.19%(+0.213)#69 | 0.49%(-0.082)#3,568 |
| 70. | Shelby | 0.40% | 0.19%(+0.204)#70 | 0.49%(-0.091)#3,613 |
| 71. | Asheville | 0.39% | 0.19%(+0.196)#71 | 0.49%(-0.099)#3,652 |
| 72. | New Bern | 0.38% | 0.19%(+0.190)#72 | 0.49%(-0.105)#3,688 |
| 73. | Fayetteville | 0.38% | 0.19%(+0.188)#73 | 0.49%(-0.108)#3,699 |
| 74. | Marion | 0.37% | 0.19%(+0.174)#74 | 0.49%(-0.122)#3,781 |
| 75. | Wendell | 0.35% | 0.19%(+0.158)#75 | 0.49%(-0.138)#3,893 |
| 76. | Hookerton | 0.35% | 0.19%(+0.154)#76 | 0.49%(-0.141)#3,925 |
| 77. | Durham | 0.34% | 0.19%(+0.151)#77 | 0.49%(-0.144)#3,938 |
| 78. | Wilson | 0.34% | 0.19%(+0.147)#78 | 0.49%(-0.148)#3,969 |
| 79. | Grifton | 0.34% | 0.19%(+0.144)#79 | 0.49%(-0.151)#3,992 |
| 80. | Troutman | 0.33% | 0.19%(+0.133)#80 | 0.49%(-0.162)#4,061 |
| 81. | Jacksonville | 0.32% | 0.19%(+0.132)#81 | 0.49%(-0.163)#4,068 |
| 82. | Rosman | 0.31% | 0.19%(+0.119)#82 | 0.49%(-0.176)#4,158 |
| 83. | Franklin | 0.31% | 0.19%(+0.119)#83 | 0.49%(-0.177)#4,164 |
| 84. | Matthews | 0.30% | 0.19%(+0.112)#84 | 0.49%(-0.184)#4,214 |
| 85. | Apex | 0.30% | 0.19%(+0.108)#85 | 0.49%(-0.187)#4,233 |
| 86. | Lake Norman Of Catawba | 0.30% | 0.19%(+0.103)#86 | 0.49%(-0.192)#4,264 |
| 87. | Pineville | 0.29% | 0.19%(+0.102)#87 | 0.49%(-0.193)#4,273 |
| 88. | Ogden | 0.28% | 0.19%(+0.084)#88 | 0.49%(-0.212)#4,400 |
| 89. | Myrtle Grove | 0.27% | 0.19%(+0.081)#89 | 0.49%(-0.215)#4,419 |
| 90. | Kure Beach | 0.26% | 0.19%(+0.067)#90 | 0.49%(-0.228)#4,518 |
| 91. | St James | 0.26% | 0.19%(+0.067)#91 | 0.49%(-0.229)#4,525 |
| 92. | Oak Ridge | 0.25% | 0.19%(+0.057)#92 | 0.49%(-0.239)#4,610 |
| 93. | Wrightsville Beach | 0.25% | 0.19%(+0.054)#93 | 0.49%(-0.242)#4,633 |
| 94. | Forest City | 0.24% | 0.19%(+0.053)#94 | 0.49%(-0.243)#4,645 |
| 95. | Elroy | 0.23% | 0.19%(+0.037)#95 | 0.49%(-0.259)#4,784 |
| 96. | Anderson Creek | 0.23% | 0.19%(+0.036)#96 | 0.49%(-0.259)#4,789 |
| 97. | Kernersville | 0.21% | 0.19%(+0.021)#97 | 0.49%(-0.274)#4,914 |
| 98. | Charlotte | 0.21% | 0.19%(+0.016)#98 | 0.49%(-0.279)#4,948 |
| 99. | Emerald Isle | 0.21% | 0.19%(+0.015)#99 | 0.49%(-0.281)#4,969 |
| 100. | Southern Pines | 0.20% | 0.19%(+0.012)#100 | 0.49%(-0.284)#4,993 |
Common Questions
What are the Top 10 Cities with the Highest Percentage of Bhutanese Population in North Carolina?
Top 10 Cities with the Highest Percentage of Bhutanese Population in North Carolina are:
#1
4.39%
#2
3.42%
#3
2.29%
#4
2.18%
#5
2.17%
#6
1.83%
#7
1.81%
#8
1.60%
#9
1.55%
#10
1.54%
What city has the Highest Percentage of Bhutanese Population in North Carolina?
Bunn has the Highest Percentage of Bhutanese Population in North Carolina with 4.39%.
What is the Percentage of Bhutanese Population in the State of North Carolina?
Percentage of Bhutanese Population in North Carolina is 0.19%.
What is the Percentage of Bhutanese Population in the United States?
Percentage of Bhutanese Population in the United States is 0.49%.