Cities with the Highest Percentage of Bhutanese Population in New York
RELATED REPORTS & OPTIONS
Bhutanese
New York
Compare Cities
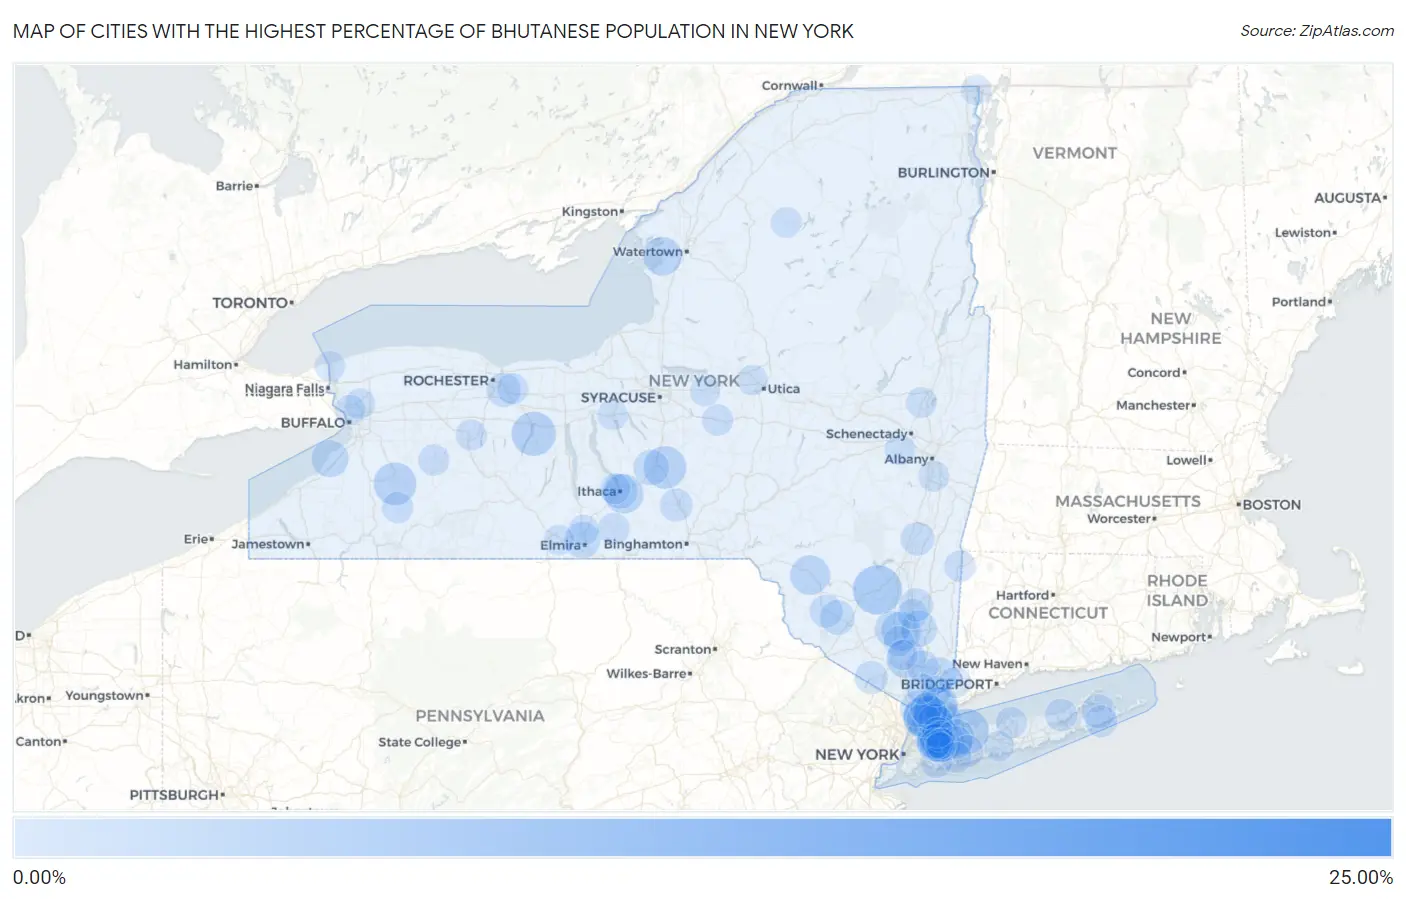
Map of Cities with the Highest Percentage of Bhutanese Population in New York
0.00%
25.00%
Cities with the Highest Percentage of Bhutanese Population in New York
| City | Bhutanese | vs State | vs National | |
| 1. | Millwood | 23.56% | 0.31%(+23.3)#1 | 0.49%(+23.1)#42 |
| 2. | Springwater | 14.21% | 0.31%(+13.9)#2 | 0.49%(+13.7)#94 |
| 3. | Accord | 5.43% | 0.31%(+5.12)#3 | 0.49%(+4.94)#258 |
| 4. | Eastchester | 4.46% | 0.31%(+4.16)#4 | 0.49%(+3.98)#309 |
| 5. | Rosendale | 4.44% | 0.31%(+4.13)#5 | 0.49%(+3.95)#311 |
| 6. | Cold Spring Harbor | 4.43% | 0.31%(+4.12)#6 | 0.49%(+3.94)#312 |
| 7. | Crystal Beach | 4.16% | 0.31%(+3.85)#7 | 0.49%(+3.67)#338 |
| 8. | Delevan | 3.74% | 0.31%(+3.44)#8 | 0.49%(+3.26)#364 |
| 9. | Mcgraw | 3.73% | 0.31%(+3.42)#9 | 0.49%(+3.24)#367 |
| 10. | Greenville Cdp Westchester County | 3.61% | 0.31%(+3.30)#10 | 0.49%(+3.12)#373 |
| 11. | Roslyn | 3.35% | 0.31%(+3.04)#11 | 0.49%(+2.86)#403 |
| 12. | Harrison | 3.33% | 0.31%(+3.02)#12 | 0.49%(+2.84)#406 |
| 13. | Tuckahoe | 3.32% | 0.31%(+3.01)#13 | 0.49%(+2.83)#408 |
| 14. | Larchmont | 3.24% | 0.31%(+2.93)#14 | 0.49%(+2.75)#417 |
| 15. | Baxter Estates | 3.22% | 0.31%(+2.92)#15 | 0.49%(+2.74)#422 |
| 16. | Manorhaven | 3.03% | 0.31%(+2.72)#16 | 0.49%(+2.54)#449 |
| 17. | Livingston Manor | 3.01% | 0.31%(+2.71)#17 | 0.49%(+2.53)#457 |
| 18. | East Ithaca | 2.95% | 0.31%(+2.64)#18 | 0.49%(+2.46)#467 |
| 19. | Balmville | 2.91% | 0.31%(+2.60)#19 | 0.49%(+2.42)#471 |
| 20. | Fort Montgomery | 2.85% | 0.31%(+2.55)#20 | 0.49%(+2.37)#484 |
| 21. | Sackets Harbor | 2.74% | 0.31%(+2.44)#21 | 0.49%(+2.26)#513 |
| 22. | Thomaston | 2.44% | 0.31%(+2.13)#22 | 0.49%(+1.95)#593 |
| 23. | Great Neck | 2.40% | 0.31%(+2.09)#23 | 0.49%(+1.91)#602 |
| 24. | Angola On The Lake | 2.38% | 0.31%(+2.07)#24 | 0.49%(+1.89)#609 |
| 25. | Dobbs Ferry | 2.32% | 0.31%(+2.01)#25 | 0.49%(+1.83)#628 |
| 26. | Rye | 2.31% | 0.31%(+2.00)#26 | 0.49%(+1.82)#634 |
| 27. | Muttontown | 2.26% | 0.31%(+1.95)#27 | 0.49%(+1.77)#656 |
| 28. | Great Neck Plaza | 2.26% | 0.31%(+1.95)#28 | 0.49%(+1.77)#657 |
| 29. | Elmira Heights | 2.19% | 0.31%(+1.89)#29 | 0.49%(+1.71)#682 |
| 30. | Merritt Park | 2.13% | 0.31%(+1.82)#30 | 0.49%(+1.64)#716 |
| 31. | Rye Brook | 2.09% | 0.31%(+1.78)#31 | 0.49%(+1.60)#736 |
| 32. | Orange Lake | 2.01% | 0.31%(+1.70)#32 | 0.49%(+1.52)#767 |
| 33. | Bedford Hills | 2.00% | 0.31%(+1.69)#33 | 0.49%(+1.51)#773 |
| 34. | Cortland West | 1.97% | 0.31%(+1.66)#34 | 0.49%(+1.48)#786 |
| 35. | Ithaca | 1.85% | 0.31%(+1.54)#35 | 0.49%(+1.36)#848 |
| 36. | Plandome Heights | 1.81% | 0.31%(+1.51)#36 | 0.49%(+1.32)#872 |
| 37. | Rock Hill | 1.76% | 0.31%(+1.46)#37 | 0.49%(+1.27)#911 |
| 38. | Mamaroneck | 1.73% | 0.31%(+1.42)#38 | 0.49%(+1.24)#935 |
| 39. | Bronxville | 1.72% | 0.31%(+1.41)#39 | 0.49%(+1.23)#939 |
| 40. | Pittsford | 1.64% | 0.31%(+1.34)#40 | 0.49%(+1.15)#1,001 |
| 41. | Sag Harbor | 1.58% | 0.31%(+1.28)#41 | 0.49%(+1.10)#1,056 |
| 42. | Latham | 1.55% | 0.31%(+1.25)#42 | 0.49%(+1.06)#1,076 |
| 43. | Scarsdale | 1.55% | 0.31%(+1.24)#43 | 0.49%(+1.06)#1,080 |
| 44. | Germantown | 1.50% | 0.31%(+1.19)#44 | 0.49%(+1.01)#1,118 |
| 45. | Albertson | 1.47% | 0.31%(+1.17)#45 | 0.49%(+0.985)#1,143 |
| 46. | Arlington | 1.41% | 0.31%(+1.11)#46 | 0.49%(+0.926)#1,189 |
| 47. | Monticello | 1.37% | 0.31%(+1.06)#47 | 0.49%(+0.883)#1,227 |
| 48. | Marist College | 1.37% | 0.31%(+1.06)#48 | 0.49%(+0.880)#1,231 |
| 49. | Greenwood Lake | 1.35% | 0.31%(+1.05)#49 | 0.49%(+0.867)#1,239 |
| 50. | Lisle | 1.30% | 0.31%(+0.992)#50 | 0.49%(+0.811)#1,306 |
| 51. | Bard College | 1.30% | 0.31%(+0.989)#51 | 0.49%(+0.808)#1,307 |
| 52. | Northville | 1.20% | 0.31%(+0.896)#52 | 0.49%(+0.715)#1,410 |
| 53. | Sagaponack | 1.16% | 0.31%(+0.856)#53 | 0.49%(+0.675)#1,457 |
| 54. | Jericho | 1.15% | 0.31%(+0.842)#54 | 0.49%(+0.661)#1,480 |
| 55. | Farmingdale | 1.10% | 0.31%(+0.797)#55 | 0.49%(+0.616)#1,527 |
| 56. | Crompond | 1.09% | 0.31%(+0.779)#56 | 0.49%(+0.598)#1,543 |
| 57. | Hartsdale | 1.07% | 0.31%(+0.764)#57 | 0.49%(+0.583)#1,565 |
| 58. | Vassar College | 1.06% | 0.31%(+0.756)#58 | 0.49%(+0.575)#1,576 |
| 59. | Van Etten | 1.05% | 0.31%(+0.744)#59 | 0.49%(+0.563)#1,592 |
| 60. | Eldred | 1.05% | 0.31%(+0.741)#60 | 0.49%(+0.560)#1,598 |
| 61. | Niagara University | 0.99% | 0.31%(+0.679)#61 | 0.49%(+0.498)#1,715 |
| 62. | Scotts Corners | 0.97% | 0.31%(+0.661)#62 | 0.49%(+0.480)#1,746 |
| 63. | Franklinville | 0.93% | 0.31%(+0.627)#63 | 0.49%(+0.446)#1,806 |
| 64. | Millerton | 0.93% | 0.31%(+0.622)#64 | 0.49%(+0.441)#1,821 |
| 65. | Gainesville | 0.93% | 0.31%(+0.619)#65 | 0.49%(+0.438)#1,826 |
| 66. | Fairport | 0.92% | 0.31%(+0.612)#66 | 0.49%(+0.431)#1,840 |
| 67. | Morrisville | 0.92% | 0.31%(+0.611)#67 | 0.49%(+0.430)#1,845 |
| 68. | Port Jefferson Station | 0.92% | 0.31%(+0.609)#68 | 0.49%(+0.428)#1,847 |
| 69. | Geneseo | 0.88% | 0.31%(+0.575)#69 | 0.49%(+0.394)#1,930 |
| 70. | South Valley Stream | 0.84% | 0.31%(+0.536)#70 | 0.49%(+0.355)#2,028 |
| 71. | Port Washington | 0.84% | 0.31%(+0.534)#71 | 0.49%(+0.353)#2,036 |
| 72. | Castleton On Hudson | 0.81% | 0.31%(+0.504)#72 | 0.49%(+0.323)#2,104 |
| 73. | Altamont | 0.80% | 0.31%(+0.496)#73 | 0.49%(+0.315)#2,126 |
| 74. | North Bellmore | 0.80% | 0.31%(+0.496)#74 | 0.49%(+0.315)#2,128 |
| 75. | Ballston Spa | 0.79% | 0.31%(+0.488)#75 | 0.49%(+0.307)#2,149 |
| 76. | Loudonville | 0.78% | 0.31%(+0.477)#76 | 0.49%(+0.296)#2,174 |
| 77. | Northwest Ithaca | 0.78% | 0.31%(+0.473)#77 | 0.49%(+0.292)#2,188 |
| 78. | Lake Success | 0.78% | 0.31%(+0.472)#78 | 0.49%(+0.291)#2,190 |
| 79. | Sands Point | 0.78% | 0.31%(+0.471)#79 | 0.49%(+0.290)#2,193 |
| 80. | Horseheads North | 0.78% | 0.31%(+0.469)#80 | 0.49%(+0.288)#2,196 |
| 81. | Star Lake | 0.77% | 0.31%(+0.464)#81 | 0.49%(+0.283)#2,211 |
| 82. | Youngstown | 0.76% | 0.31%(+0.457)#82 | 0.49%(+0.276)#2,225 |
| 83. | Fairview Cdp Dutchess County | 0.76% | 0.31%(+0.455)#83 | 0.49%(+0.274)#2,230 |
| 84. | North Hills | 0.76% | 0.31%(+0.449)#84 | 0.49%(+0.268)#2,241 |
| 85. | Oriskany | 0.75% | 0.31%(+0.443)#85 | 0.49%(+0.262)#2,253 |
| 86. | Rochester Institute Of Technology | 0.75% | 0.31%(+0.439)#86 | 0.49%(+0.258)#2,265 |
| 87. | Armonk | 0.73% | 0.31%(+0.424)#87 | 0.49%(+0.243)#2,300 |
| 88. | Briarcliff Manor | 0.73% | 0.31%(+0.424)#88 | 0.49%(+0.243)#2,302 |
| 89. | Russell Gardens | 0.73% | 0.31%(+0.421)#89 | 0.49%(+0.240)#2,306 |
| 90. | South Corning | 0.72% | 0.31%(+0.418)#90 | 0.49%(+0.237)#2,311 |
| 91. | Rouses Point | 0.71% | 0.31%(+0.405)#91 | 0.49%(+0.224)#2,342 |
| 92. | University At Buffalo | 0.71% | 0.31%(+0.405)#92 | 0.49%(+0.223)#2,346 |
| 93. | North Great River | 0.71% | 0.31%(+0.400)#93 | 0.49%(+0.219)#2,360 |
| 94. | Kenmore | 0.70% | 0.31%(+0.393)#94 | 0.49%(+0.212)#2,379 |
| 95. | Auburn | 0.70% | 0.31%(+0.391)#95 | 0.49%(+0.210)#2,382 |
| 96. | Vails Gate | 0.69% | 0.31%(+0.388)#96 | 0.49%(+0.207)#2,393 |
| 97. | Crown Heights | 0.69% | 0.31%(+0.387)#97 | 0.49%(+0.206)#2,395 |
| 98. | Manhasset Hills | 0.69% | 0.31%(+0.385)#98 | 0.49%(+0.204)#2,400 |
| 99. | West Point | 0.66% | 0.31%(+0.351)#99 | 0.49%(+0.170)#2,484 |
| 100. | Canastota | 0.64% | 0.31%(+0.331)#100 | 0.49%(+0.150)#2,549 |
Common Questions
What are the Top 10 Cities with the Highest Percentage of Bhutanese Population in New York?
Top 10 Cities with the Highest Percentage of Bhutanese Population in New York are:
#1
5.43%
#2
4.46%
#3
4.43%
#4
4.16%
#5
3.74%
#6
3.73%
#7
3.35%
#8
3.33%
#9
3.32%
#10
3.24%
What city has the Highest Percentage of Bhutanese Population in New York?
Accord has the Highest Percentage of Bhutanese Population in New York with 5.43%.
What is the Percentage of Bhutanese Population in the State of New York?
Percentage of Bhutanese Population in New York is 0.31%.
What is the Percentage of Bhutanese Population in the United States?
Percentage of Bhutanese Population in the United States is 0.49%.