Cities with the Highest Percentage of Bhutanese Population in Ohio
RELATED REPORTS & OPTIONS
Bhutanese
Ohio
Compare Cities
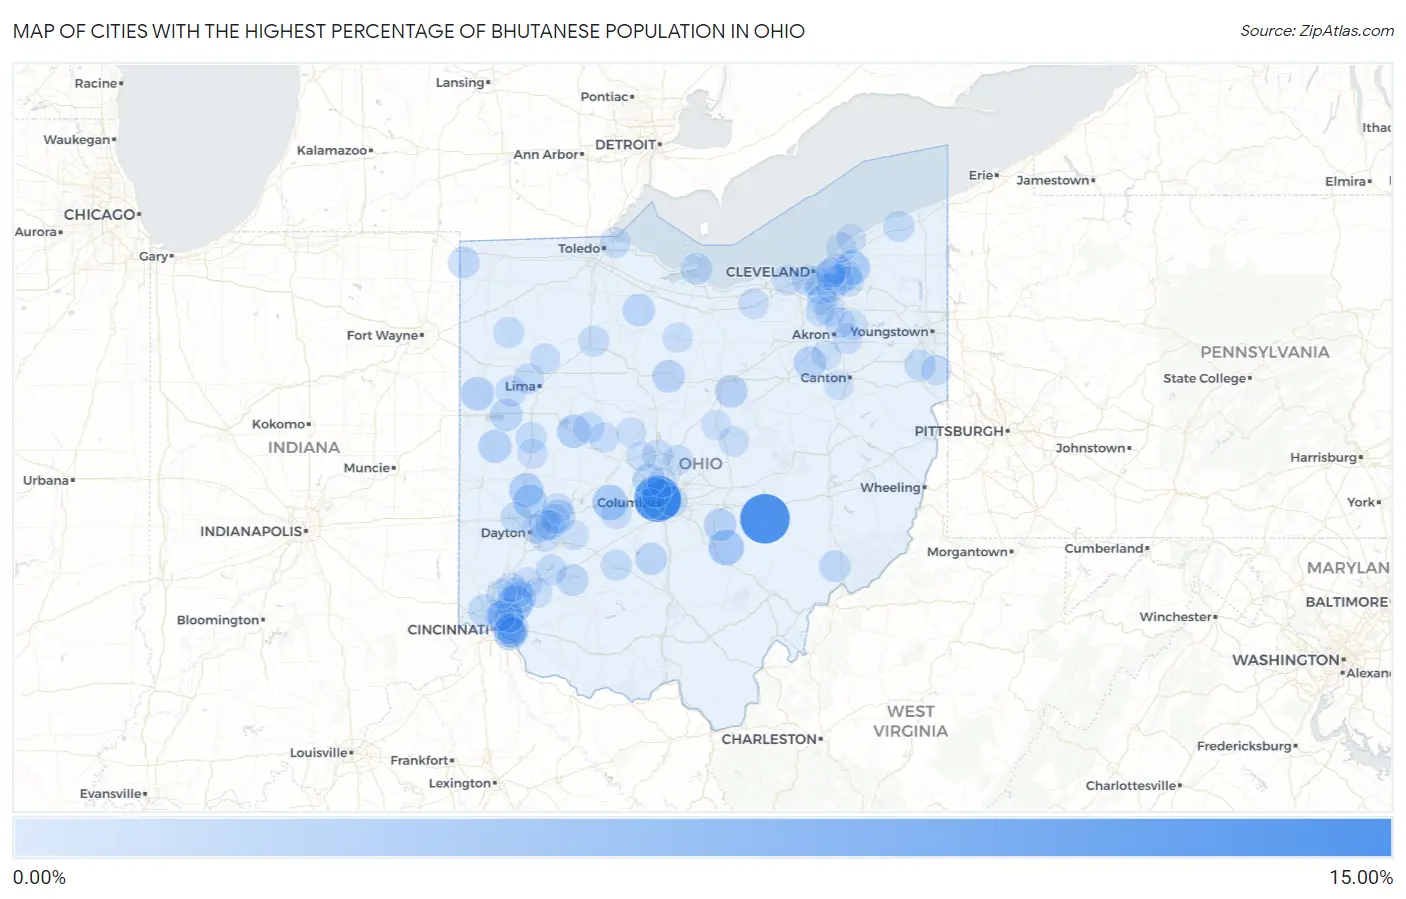
Map of Cities with the Highest Percentage of Bhutanese Population in Ohio
0.00%
15.00%
Cities with the Highest Percentage of Bhutanese Population in Ohio
| City | Bhutanese | vs State | vs National | |
| 1. | East Fultonham | 10.49% | 0.20%(+10.3)#1 | 0.49%(+10.0)#132 |
| 2. | Marble Cliff | 8.82% | 0.20%(+8.62)#2 | 0.49%(+8.33)#159 |
| 3. | Grandview Heights | 5.53% | 0.20%(+5.33)#3 | 0.49%(+5.05)#252 |
| 4. | Sixteen Mile Stand | 3.51% | 0.20%(+3.31)#4 | 0.49%(+3.02)#389 |
| 5. | Silverton | 3.50% | 0.20%(+3.30)#5 | 0.49%(+3.01)#391 |
| 6. | Hide A Way Hills | 3.17% | 0.20%(+2.97)#6 | 0.49%(+2.68)#432 |
| 7. | Choctaw Lake | 2.98% | 0.20%(+2.78)#7 | 0.49%(+2.49)#463 |
| 8. | Chesterland | 2.65% | 0.20%(+2.45)#8 | 0.49%(+2.16)#536 |
| 9. | Troy | 2.37% | 0.20%(+2.17)#9 | 0.49%(+1.88)#612 |
| 10. | Tipp City | 2.28% | 0.20%(+2.08)#10 | 0.49%(+1.79)#645 |
| 11. | Rockford | 2.13% | 0.20%(+1.93)#11 | 0.49%(+1.64)#715 |
| 12. | Huntsville | 2.10% | 0.20%(+1.90)#12 | 0.49%(+1.61)#728 |
| 13. | Enon | 1.99% | 0.20%(+1.79)#13 | 0.49%(+1.51)#776 |
| 14. | Osgood | 1.98% | 0.20%(+1.78)#14 | 0.49%(+1.50)#779 |
| 15. | Fruit Hill | 1.92% | 0.20%(+1.72)#15 | 0.49%(+1.44)#805 |
| 16. | Pleasantville | 1.69% | 0.20%(+1.49)#16 | 0.49%(+1.21)#957 |
| 17. | Lucas | 1.69% | 0.20%(+1.49)#17 | 0.49%(+1.20)#959 |
| 18. | Marshallville | 1.68% | 0.20%(+1.47)#18 | 0.49%(+1.19)#974 |
| 19. | Bucyrus | 1.67% | 0.20%(+1.47)#19 | 0.49%(+1.18)#982 |
| 20. | Dublin | 1.64% | 0.20%(+1.44)#20 | 0.49%(+1.15)#1,005 |
| 21. | Dry Run | 1.63% | 0.20%(+1.43)#21 | 0.49%(+1.14)#1,010 |
| 22. | Bettsville | 1.59% | 0.20%(+1.39)#22 | 0.49%(+1.10)#1,053 |
| 23. | St Marys | 1.59% | 0.20%(+1.39)#23 | 0.49%(+1.10)#1,055 |
| 24. | Williamsport | 1.46% | 0.20%(+1.26)#24 | 0.49%(+0.974)#1,155 |
| 25. | Sherwood | 1.41% | 0.20%(+1.21)#25 | 0.49%(+0.921)#1,195 |
| 26. | Landen | 1.40% | 0.20%(+1.20)#26 | 0.49%(+0.911)#1,206 |
| 27. | Wright Patterson Afb | 1.35% | 0.20%(+1.15)#27 | 0.49%(+0.864)#1,240 |
| 28. | Marblehead | 1.25% | 0.20%(+1.05)#28 | 0.49%(+0.760)#1,360 |
| 29. | Ridgewood | 1.24% | 0.20%(+1.04)#29 | 0.49%(+0.756)#1,365 |
| 30. | Edon | 1.22% | 0.20%(+1.02)#30 | 0.49%(+0.732)#1,388 |
| 31. | Wilmington | 1.20% | 0.20%(+0.999)#31 | 0.49%(+0.712)#1,414 |
| 32. | Lowell | 1.19% | 0.20%(+0.985)#32 | 0.49%(+0.698)#1,426 |
| 33. | Leetonia | 1.16% | 0.20%(+0.956)#33 | 0.49%(+0.669)#1,466 |
| 34. | Groesbeck | 1.12% | 0.20%(+0.921)#34 | 0.49%(+0.634)#1,507 |
| 35. | Englewood | 1.04% | 0.20%(+0.842)#35 | 0.49%(+0.555)#1,606 |
| 36. | Harveysburg | 1.03% | 0.20%(+0.829)#36 | 0.49%(+0.542)#1,628 |
| 37. | Independence | 1.02% | 0.20%(+0.821)#37 | 0.49%(+0.534)#1,643 |
| 38. | Anna | 0.98% | 0.20%(+0.784)#38 | 0.49%(+0.497)#1,716 |
| 39. | Rushsylvania | 0.98% | 0.20%(+0.778)#39 | 0.49%(+0.491)#1,730 |
| 40. | Geneva | 0.96% | 0.20%(+0.760)#40 | 0.49%(+0.473)#1,756 |
| 41. | Spencerville | 0.94% | 0.20%(+0.740)#41 | 0.49%(+0.453)#1,797 |
| 42. | Washington Court House | 0.90% | 0.20%(+0.703)#42 | 0.49%(+0.416)#1,879 |
| 43. | Oakwood | 0.90% | 0.20%(+0.695)#43 | 0.49%(+0.408)#1,899 |
| 44. | Woodworth | 0.89% | 0.20%(+0.686)#44 | 0.49%(+0.399)#1,920 |
| 45. | Bexley | 0.88% | 0.20%(+0.678)#45 | 0.49%(+0.392)#1,938 |
| 46. | Hunting Valley | 0.88% | 0.20%(+0.674)#46 | 0.49%(+0.388)#1,948 |
| 47. | Orange | 0.87% | 0.20%(+0.674)#47 | 0.49%(+0.387)#1,955 |
| 48. | Findlay | 0.85% | 0.20%(+0.648)#48 | 0.49%(+0.361)#2,014 |
| 49. | Elida | 0.83% | 0.20%(+0.627)#49 | 0.49%(+0.340)#2,059 |
| 50. | Beavercreek | 0.81% | 0.20%(+0.607)#50 | 0.49%(+0.320)#2,107 |
| 51. | Donnelsville | 0.81% | 0.20%(+0.606)#51 | 0.49%(+0.319)#2,110 |
| 52. | Harbor View | 0.81% | 0.20%(+0.606)#52 | 0.49%(+0.319)#2,111 |
| 53. | Cuyahoga Heights | 0.80% | 0.20%(+0.597)#53 | 0.49%(+0.310)#2,143 |
| 54. | Peninsula | 0.79% | 0.20%(+0.589)#54 | 0.49%(+0.302)#2,158 |
| 55. | Brooklyn | 0.77% | 0.20%(+0.572)#55 | 0.49%(+0.285)#2,206 |
| 56. | Westlake | 0.74% | 0.20%(+0.543)#56 | 0.49%(+0.256)#2,268 |
| 57. | Delaware | 0.74% | 0.20%(+0.541)#57 | 0.49%(+0.254)#2,273 |
| 58. | London | 0.74% | 0.20%(+0.536)#58 | 0.49%(+0.249)#2,286 |
| 59. | Lincoln Village | 0.73% | 0.20%(+0.532)#59 | 0.49%(+0.245)#2,297 |
| 60. | Chagrin Falls | 0.73% | 0.20%(+0.528)#60 | 0.49%(+0.241)#2,303 |
| 61. | Columbus Grove | 0.72% | 0.20%(+0.515)#61 | 0.49%(+0.228)#2,329 |
| 62. | New Waterford | 0.67% | 0.20%(+0.468)#62 | 0.49%(+0.181)#2,449 |
| 63. | Oberlin | 0.66% | 0.20%(+0.458)#63 | 0.49%(+0.172)#2,477 |
| 64. | Gambier | 0.65% | 0.20%(+0.449)#64 | 0.49%(+0.162)#2,506 |
| 65. | Sunbury | 0.63% | 0.20%(+0.434)#65 | 0.49%(+0.147)#2,559 |
| 66. | Turpin Hills | 0.60% | 0.20%(+0.400)#66 | 0.49%(+0.113)#2,676 |
| 67. | Mogadore | 0.60% | 0.20%(+0.399)#67 | 0.49%(+0.112)#2,681 |
| 68. | Lebanon | 0.60% | 0.20%(+0.395)#68 | 0.49%(+0.108)#2,691 |
| 69. | Brecksville | 0.59% | 0.20%(+0.387)#69 | 0.49%(+0.100)#2,712 |
| 70. | Lyndhurst | 0.58% | 0.20%(+0.380)#70 | 0.49%(+0.093)#2,731 |
| 71. | Bedford | 0.58% | 0.20%(+0.374)#71 | 0.49%(+0.088)#2,752 |
| 72. | Silver Lake | 0.57% | 0.20%(+0.372)#72 | 0.49%(+0.085)#2,765 |
| 73. | West Mansfield | 0.57% | 0.20%(+0.366)#73 | 0.49%(+0.079)#2,796 |
| 74. | Sidney | 0.56% | 0.20%(+0.360)#74 | 0.49%(+0.073)#2,836 |
| 75. | Attica | 0.56% | 0.20%(+0.359)#75 | 0.49%(+0.072)#2,839 |
| 76. | Forestville | 0.55% | 0.20%(+0.350)#76 | 0.49%(+0.063)#2,872 |
| 77. | Mason | 0.55% | 0.20%(+0.346)#77 | 0.49%(+0.059)#2,886 |
| 78. | Shaker Heights | 0.55% | 0.20%(+0.345)#78 | 0.49%(+0.058)#2,895 |
| 79. | Holiday Valley | 0.53% | 0.20%(+0.327)#79 | 0.49%(+0.041)#2,967 |
| 80. | Four Bridges | 0.51% | 0.20%(+0.312)#80 | 0.49%(+0.025)#3,024 |
| 81. | Madeira | 0.51% | 0.20%(+0.309)#81 | 0.49%(+0.022)#3,035 |
| 82. | Lakeline | 0.51% | 0.20%(+0.304)#82 | 0.49%(+0.018)#3,061 |
| 83. | Golf Manor | 0.50% | 0.20%(+0.301)#83 | 0.49%(+0.014)#3,071 |
| 84. | Worthington | 0.50% | 0.20%(+0.300)#84 | 0.49%(+0.013)#3,079 |
| 85. | Beckett Ridge | 0.50% | 0.20%(+0.295)#85 | 0.49%(+0.008)#3,097 |
| 86. | University Heights | 0.49% | 0.20%(+0.290)#86 | 0.49%(+0.003)#3,130 |
| 87. | Upper Arlington | 0.47% | 0.20%(+0.273)#87 | 0.49%(-0.014)#3,211 |
| 88. | Morrow | 0.47% | 0.20%(+0.270)#88 | 0.49%(-0.017)#3,224 |
| 89. | Kent | 0.47% | 0.20%(+0.268)#89 | 0.49%(-0.019)#3,235 |
| 90. | Richville | 0.46% | 0.20%(+0.263)#90 | 0.49%(-0.024)#3,258 |
| 91. | Fredericktown | 0.45% | 0.20%(+0.254)#91 | 0.49%(-0.033)#3,308 |
| 92. | Riverside | 0.45% | 0.20%(+0.253)#92 | 0.49%(-0.034)#3,311 |
| 93. | Fairborn | 0.45% | 0.20%(+0.252)#93 | 0.49%(-0.035)#3,317 |
| 94. | Richwood | 0.45% | 0.20%(+0.249)#94 | 0.49%(-0.037)#3,336 |
| 95. | Middlebranch | 0.45% | 0.20%(+0.246)#95 | 0.49%(-0.041)#3,352 |
| 96. | Cedarville | 0.43% | 0.20%(+0.234)#96 | 0.49%(-0.053)#3,411 |
| 97. | Richfield | 0.43% | 0.20%(+0.230)#97 | 0.49%(-0.057)#3,435 |
| 98. | Ostrander | 0.42% | 0.20%(+0.220)#98 | 0.49%(-0.067)#3,479 |
| 99. | Mentor On The Lake | 0.41% | 0.20%(+0.205)#99 | 0.49%(-0.082)#3,566 |
| 100. | New Franklin | 0.40% | 0.20%(+0.203)#100 | 0.49%(-0.084)#3,576 |
Common Questions
What are the Top 10 Cities with the Highest Percentage of Bhutanese Population in Ohio?
Top 10 Cities with the Highest Percentage of Bhutanese Population in Ohio are:
#1
10.49%
#2
8.82%
#3
5.53%
#4
3.51%
#5
3.50%
#6
3.17%
#7
2.98%
#8
2.65%
#9
2.37%
#10
2.28%
What city has the Highest Percentage of Bhutanese Population in Ohio?
East Fultonham has the Highest Percentage of Bhutanese Population in Ohio with 10.49%.
What is the Percentage of Bhutanese Population in the State of Ohio?
Percentage of Bhutanese Population in Ohio is 0.20%.
What is the Percentage of Bhutanese Population in the United States?
Percentage of Bhutanese Population in the United States is 0.49%.