Cities with the Highest Percentage of Bhutanese Population in Kansas
RELATED REPORTS & OPTIONS
Bhutanese
Kansas
Compare Cities
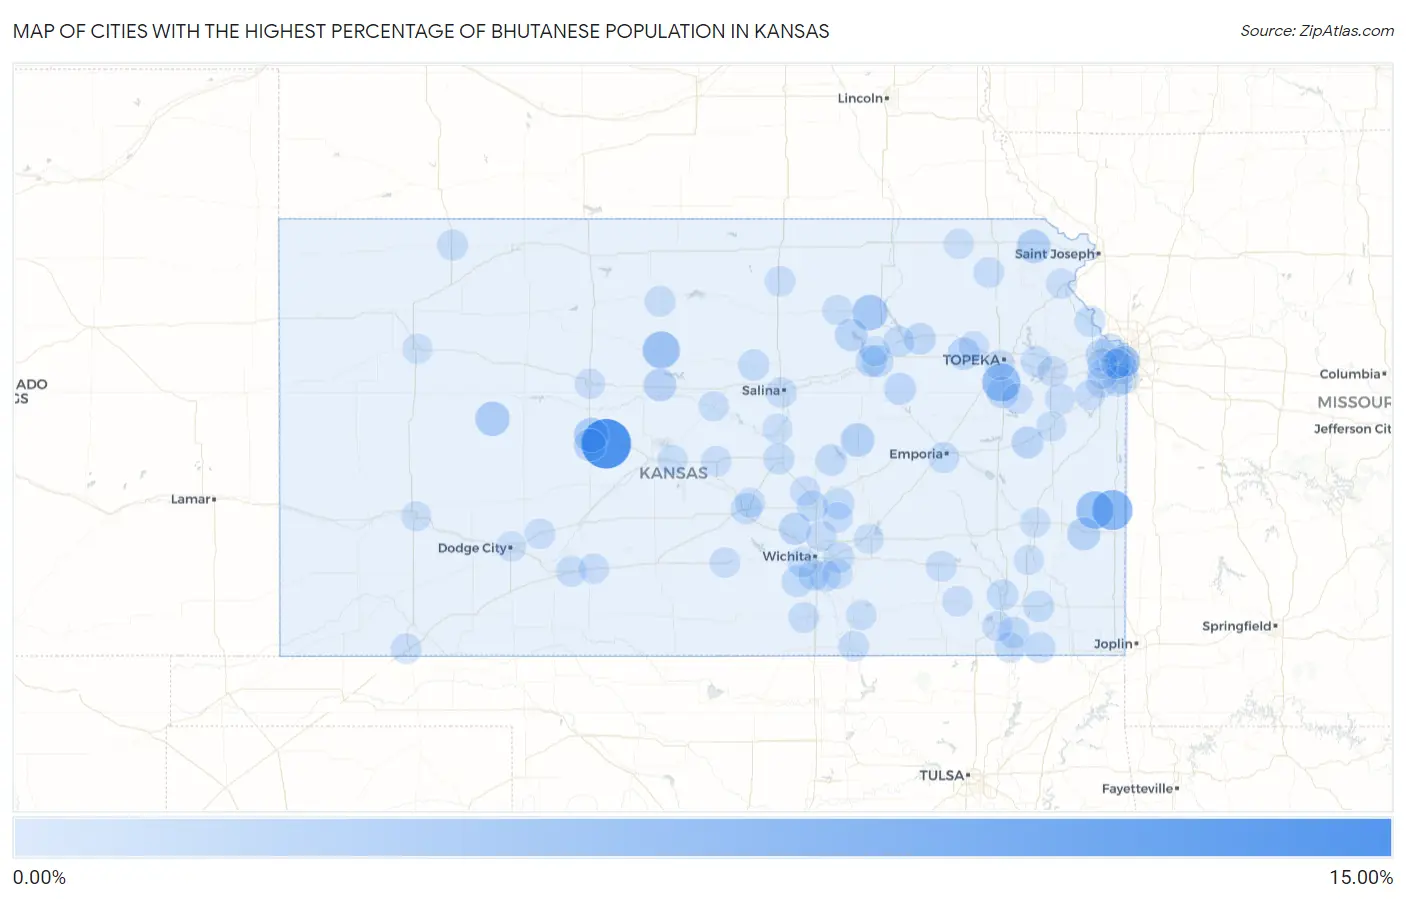
Map of Cities with the Highest Percentage of Bhutanese Population in Kansas
0.00%
15.00%
Cities with the Highest Percentage of Bhutanese Population in Kansas
| City | Bhutanese | vs State | vs National | |
| 1. | Timken | 12.50% | 0.23%(+12.3)#1 | 0.49%(+12.0)#109 |
| 2. | Fulton | 6.32% | 0.23%(+6.09)#2 | 0.49%(+5.83)#224 |
| 3. | Wakarusa | 4.94% | 0.23%(+4.71)#3 | 0.49%(+4.45)#284 |
| 4. | Mapleton | 4.58% | 0.23%(+4.36)#4 | 0.49%(+4.10)#303 |
| 5. | Luray | 4.32% | 0.23%(+4.10)#5 | 0.49%(+3.84)#322 |
| 6. | Leonardville | 3.32% | 0.23%(+3.10)#6 | 0.49%(+2.83)#407 |
| 7. | La Crosse | 2.67% | 0.23%(+2.44)#7 | 0.49%(+2.18)#529 |
| 8. | Utica | 2.65% | 0.23%(+2.43)#8 | 0.49%(+2.17)#534 |
| 9. | Lincolnville | 2.15% | 0.23%(+1.92)#9 | 0.49%(+1.66)#709 |
| 10. | Robinson | 2.12% | 0.23%(+1.89)#10 | 0.49%(+1.63)#722 |
| 11. | Roeland Park | 1.83% | 0.23%(+1.60)#11 | 0.49%(+1.34)#865 |
| 12. | Uniontown | 1.69% | 0.23%(+1.46)#12 | 0.49%(+1.20)#965 |
| 13. | Bunker Hill | 1.67% | 0.23%(+1.44)#13 | 0.49%(+1.18)#980 |
| 14. | Wakefield | 1.51% | 0.23%(+1.28)#14 | 0.49%(+1.02)#1,106 |
| 15. | Maple Hill | 1.40% | 0.23%(+1.17)#15 | 0.49%(+0.911)#1,207 |
| 16. | Rush Center | 1.35% | 0.23%(+1.12)#16 | 0.49%(+0.858)#1,246 |
| 17. | Bentley | 1.33% | 0.23%(+1.10)#17 | 0.49%(+0.840)#1,267 |
| 18. | Williamsburg | 1.17% | 0.23%(+0.939)#18 | 0.49%(+0.678)#1,452 |
| 19. | Dwight | 1.12% | 0.23%(+0.893)#19 | 0.49%(+0.632)#1,510 |
| 20. | Grandview Plaza | 1.12% | 0.23%(+0.890)#20 | 0.49%(+0.629)#1,513 |
| 21. | St George | 1.01% | 0.23%(+0.782)#21 | 0.49%(+0.521)#1,666 |
| 22. | Carbondale | 1.00% | 0.23%(+0.776)#22 | 0.49%(+0.515)#1,679 |
| 23. | Edwardsville | 0.97% | 0.23%(+0.743)#23 | 0.49%(+0.482)#1,743 |
| 24. | Junction City | 0.91% | 0.23%(+0.684)#24 | 0.49%(+0.423)#1,859 |
| 25. | Hillsboro | 0.87% | 0.23%(+0.648)#25 | 0.49%(+0.387)#1,951 |
| 26. | Clearwater | 0.86% | 0.23%(+0.638)#26 | 0.49%(+0.377)#1,982 |
| 27. | Derby | 0.81% | 0.23%(+0.580)#27 | 0.49%(+0.319)#2,112 |
| 28. | Liberty | 0.76% | 0.23%(+0.531)#28 | 0.49%(+0.270)#2,237 |
| 29. | Elbing | 0.74% | 0.23%(+0.511)#29 | 0.49%(+0.251)#2,281 |
| 30. | South Hutchinson | 0.71% | 0.23%(+0.483)#30 | 0.49%(+0.222)#2,350 |
| 31. | Parsons | 0.69% | 0.23%(+0.463)#31 | 0.49%(+0.203)#2,403 |
| 32. | Mcpherson | 0.69% | 0.23%(+0.461)#32 | 0.49%(+0.200)#2,408 |
| 33. | Tescott | 0.68% | 0.23%(+0.456)#33 | 0.49%(+0.195)#2,420 |
| 34. | Neodesha | 0.67% | 0.23%(+0.444)#34 | 0.49%(+0.183)#2,444 |
| 35. | Newton | 0.65% | 0.23%(+0.421)#35 | 0.49%(+0.160)#2,514 |
| 36. | Leavenworth | 0.64% | 0.23%(+0.411)#36 | 0.49%(+0.150)#2,550 |
| 37. | Haysville | 0.63% | 0.23%(+0.407)#37 | 0.49%(+0.146)#2,566 |
| 38. | Emporia | 0.59% | 0.23%(+0.366)#38 | 0.49%(+0.105)#2,697 |
| 39. | Manhattan | 0.57% | 0.23%(+0.346)#39 | 0.49%(+0.085)#2,762 |
| 40. | Edna | 0.57% | 0.23%(+0.345)#40 | 0.49%(+0.084)#2,770 |
| 41. | Mission | 0.57% | 0.23%(+0.339)#41 | 0.49%(+0.078)#2,802 |
| 42. | Andover | 0.54% | 0.23%(+0.310)#42 | 0.49%(+0.049)#2,927 |
| 43. | Oberlin | 0.49% | 0.23%(+0.264)#43 | 0.49%(+0.004)#3,128 |
| 44. | Severy | 0.47% | 0.23%(+0.245)#44 | 0.49%(-0.016)#3,219 |
| 45. | Osborne | 0.46% | 0.23%(+0.236)#45 | 0.49%(-0.025)#3,260 |
| 46. | Leawood | 0.44% | 0.23%(+0.217)#46 | 0.49%(-0.044)#3,363 |
| 47. | Mullinville | 0.43% | 0.23%(+0.206)#47 | 0.49%(-0.055)#3,421 |
| 48. | Salina | 0.43% | 0.23%(+0.203)#48 | 0.49%(-0.057)#3,438 |
| 49. | Prairie Village | 0.42% | 0.23%(+0.192)#49 | 0.49%(-0.069)#3,484 |
| 50. | Wellington | 0.42% | 0.23%(+0.188)#50 | 0.49%(-0.072)#3,503 |
| 51. | Olathe | 0.37% | 0.23%(+0.145)#51 | 0.49%(-0.116)#3,747 |
| 52. | Overland Park | 0.36% | 0.23%(+0.129)#52 | 0.49%(-0.132)#3,845 |
| 53. | Parkerfield | 0.35% | 0.23%(+0.128)#53 | 0.49%(-0.133)#3,859 |
| 54. | Coffeyville | 0.35% | 0.23%(+0.124)#54 | 0.49%(-0.137)#3,889 |
| 55. | Lecompton | 0.35% | 0.23%(+0.121)#55 | 0.49%(-0.140)#3,908 |
| 56. | Wetmore | 0.34% | 0.23%(+0.117)#56 | 0.49%(-0.144)#3,933 |
| 57. | Kechi | 0.34% | 0.23%(+0.112)#57 | 0.49%(-0.148)#3,970 |
| 58. | Concordia | 0.31% | 0.23%(+0.088)#58 | 0.49%(-0.173)#4,123 |
| 59. | Overbrook | 0.31% | 0.23%(+0.084)#59 | 0.49%(-0.177)#4,168 |
| 60. | Liberal | 0.31% | 0.23%(+0.082)#60 | 0.49%(-0.179)#4,181 |
| 61. | Topeka | 0.31% | 0.23%(+0.082)#61 | 0.49%(-0.179)#4,184 |
| 62. | Lyons | 0.31% | 0.23%(+0.079)#62 | 0.49%(-0.182)#4,202 |
| 63. | Longton | 0.30% | 0.23%(+0.076)#63 | 0.49%(-0.184)#4,219 |
| 64. | Hesston | 0.24% | 0.23%(+0.016)#64 | 0.49%(-0.244)#4,664 |
| 65. | Lenexa | 0.23% | 0.23%(+0.006)#65 | 0.49%(-0.254)#4,756 |
| 66. | Lawrence | 0.23% | 0.23%(+0.006)#66 | 0.49%(-0.255)#4,758 |
| 67. | Kingman | 0.23% | 0.23%(+0.003)#67 | 0.49%(-0.258)#4,779 |
| 68. | Clay Center | 0.22% | 0.23%(-0.010)#68 | 0.49%(-0.271)#4,888 |
| 69. | Whitewater | 0.21% | 0.23%(-0.019)#69 | 0.49%(-0.280)#4,955 |
| 70. | Baldwin City | 0.21% | 0.23%(-0.020)#70 | 0.49%(-0.281)#4,974 |
| 71. | Wichita | 0.20% | 0.23%(-0.023)#71 | 0.49%(-0.284)#4,994 |
| 72. | Atchison | 0.20% | 0.23%(-0.024)#72 | 0.49%(-0.284)#5,004 |
| 73. | Spearville | 0.20% | 0.23%(-0.028)#73 | 0.49%(-0.289)#5,043 |
| 74. | Independence | 0.19% | 0.23%(-0.040)#74 | 0.49%(-0.300)#5,159 |
| 75. | Rossville | 0.18% | 0.23%(-0.042)#75 | 0.49%(-0.303)#5,182 |
| 76. | Ellinwood | 0.18% | 0.23%(-0.047)#76 | 0.49%(-0.308)#5,232 |
| 77. | Ottawa | 0.17% | 0.23%(-0.060)#77 | 0.49%(-0.321)#5,361 |
| 78. | Westwood | 0.16% | 0.23%(-0.063)#78 | 0.49%(-0.323)#5,391 |
| 79. | Winfield | 0.16% | 0.23%(-0.066)#79 | 0.49%(-0.327)#5,427 |
| 80. | Rose Hill | 0.16% | 0.23%(-0.066)#80 | 0.49%(-0.327)#5,431 |
| 81. | Greensburg | 0.16% | 0.23%(-0.068)#81 | 0.49%(-0.329)#5,447 |
| 82. | Ellsworth | 0.13% | 0.23%(-0.097)#82 | 0.49%(-0.358)#5,743 |
| 83. | Hays | 0.13% | 0.23%(-0.099)#83 | 0.49%(-0.360)#5,764 |
| 84. | Gardner | 0.12% | 0.23%(-0.107)#84 | 0.49%(-0.368)#5,876 |
| 85. | Kansas City | 0.12% | 0.23%(-0.109)#85 | 0.49%(-0.370)#5,894 |
| 86. | Shawnee | 0.12% | 0.23%(-0.111)#86 | 0.49%(-0.372)#5,918 |
| 87. | Lindsborg | 0.11% | 0.23%(-0.120)#87 | 0.49%(-0.381)#6,033 |
| 88. | Dodge City | 0.10% | 0.23%(-0.122)#88 | 0.49%(-0.383)#6,055 |
| 89. | Seneca | 0.098% | 0.23%(-0.129)#89 | 0.49%(-0.390)#6,126 |
| 90. | Oakley | 0.097% | 0.23%(-0.130)#90 | 0.49%(-0.391)#6,137 |
| 91. | Hutchinson | 0.083% | 0.23%(-0.144)#91 | 0.49%(-0.405)#6,266 |
| 92. | El Dorado | 0.078% | 0.23%(-0.149)#92 | 0.49%(-0.410)#6,311 |
| 93. | Chanute | 0.069% | 0.23%(-0.158)#93 | 0.49%(-0.419)#6,406 |
| 94. | Iola | 0.056% | 0.23%(-0.171)#94 | 0.49%(-0.432)#6,546 |
| 95. | Merriam | 0.054% | 0.23%(-0.172)#95 | 0.49%(-0.433)#6,571 |
| 96. | Fort Riley | 0.046% | 0.23%(-0.180)#96 | 0.49%(-0.441)#6,652 |
| 97. | Garden City | 0.0036% | 0.23%(-0.223)#97 | 0.49%(-0.484)#6,974 |
Common Questions
What are the Top 10 Cities with the Highest Percentage of Bhutanese Population in Kansas?
Top 10 Cities with the Highest Percentage of Bhutanese Population in Kansas are:
#1
12.50%
#2
6.32%
#3
4.94%
#4
4.58%
#5
4.32%
#6
3.32%
#7
2.67%
#8
2.65%
#9
2.15%
#10
2.12%
What city has the Highest Percentage of Bhutanese Population in Kansas?
Timken has the Highest Percentage of Bhutanese Population in Kansas with 12.50%.
What is the Percentage of Bhutanese Population in the State of Kansas?
Percentage of Bhutanese Population in Kansas is 0.23%.
What is the Percentage of Bhutanese Population in the United States?
Percentage of Bhutanese Population in the United States is 0.49%.