Cities with the Highest Percentage of Bhutanese Population in Illinois
RELATED REPORTS & OPTIONS
Bhutanese
Illinois
Compare Cities
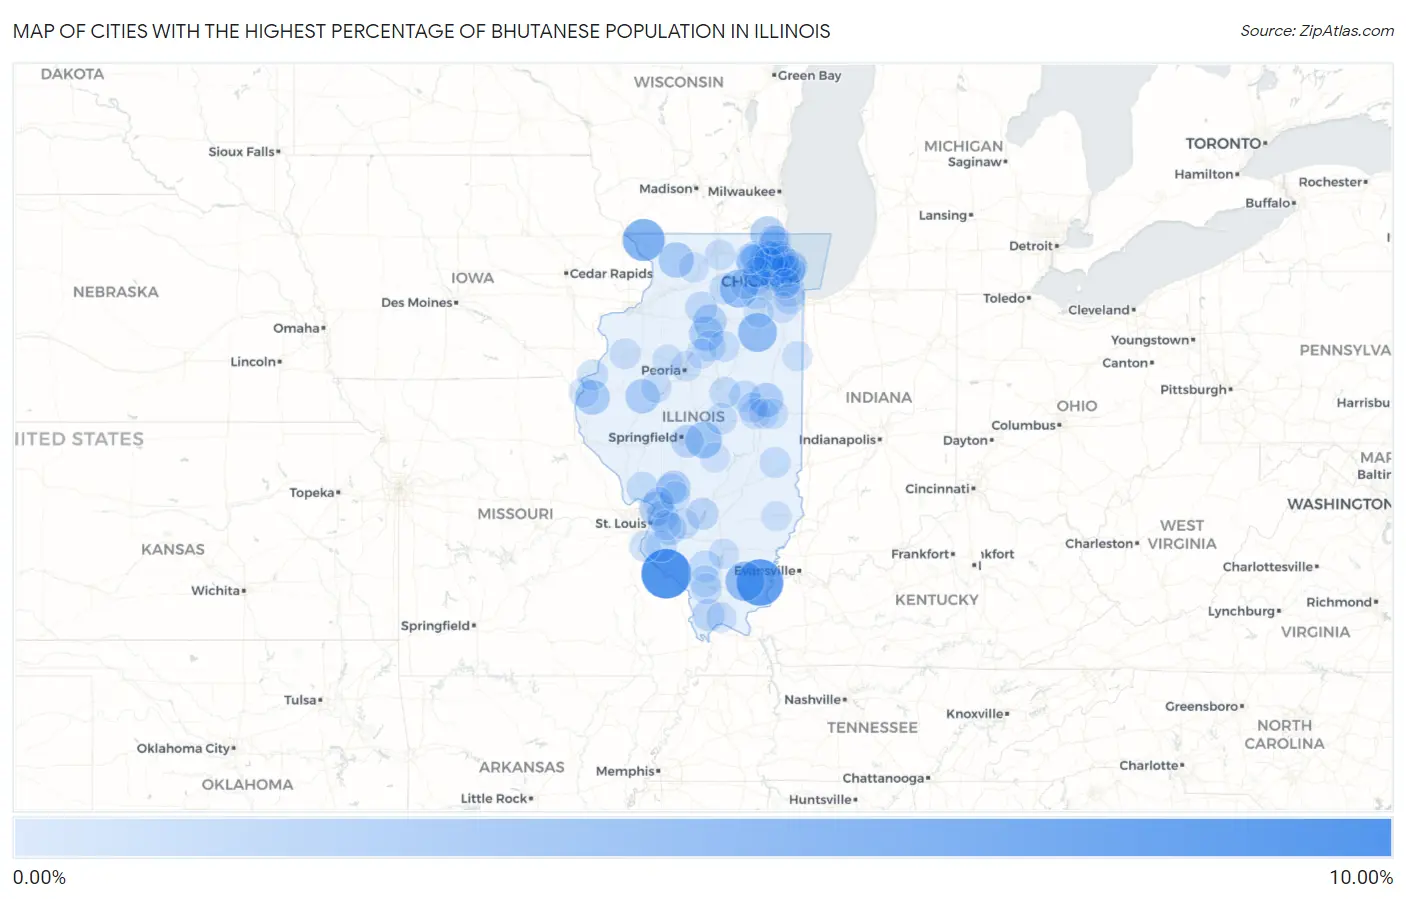
Map of Cities with the Highest Percentage of Bhutanese Population in Illinois
0.00%
10.00%
Cities with the Highest Percentage of Bhutanese Population in Illinois
| City | Bhutanese | vs State | vs National | |
| 1. | Kaskaskia | 8.33% | 0.28%(+8.06)#1 | 0.49%(+7.85)#167 |
| 2. | Ridgway | 7.14% | 0.28%(+6.87)#2 | 0.49%(+6.66)#195 |
| 3. | The Galena Territory | 5.23% | 0.28%(+4.95)#3 | 0.49%(+4.74)#269 |
| 4. | Raleigh | 4.13% | 0.28%(+3.86)#4 | 0.49%(+3.64)#340 |
| 5. | Gardner | 3.99% | 0.28%(+3.72)#5 | 0.49%(+3.51)#350 |
| 6. | Hinckley | 3.57% | 0.28%(+3.30)#6 | 0.49%(+3.09)#377 |
| 7. | Mount Auburn | 3.03% | 0.28%(+2.75)#7 | 0.49%(+2.54)#450 |
| 8. | Schaumburg | 2.59% | 0.28%(+2.32)#8 | 0.49%(+2.11)#550 |
| 9. | Shannon | 2.58% | 0.28%(+2.31)#9 | 0.49%(+2.09)#554 |
| 10. | Lake Catherine | 2.36% | 0.28%(+2.09)#10 | 0.49%(+1.88)#616 |
| 11. | Basco | 2.35% | 0.28%(+2.08)#11 | 0.49%(+1.87)#620 |
| 12. | Hartford | 2.21% | 0.28%(+1.94)#12 | 0.49%(+1.73)#674 |
| 13. | Ipava | 2.21% | 0.28%(+1.94)#13 | 0.49%(+1.72)#675 |
| 14. | Hoffman Estates | 2.20% | 0.28%(+1.93)#14 | 0.49%(+1.72)#679 |
| 15. | Mcnabb | 2.16% | 0.28%(+1.89)#15 | 0.49%(+1.68)#703 |
| 16. | Rantoul | 2.14% | 0.28%(+1.86)#16 | 0.49%(+1.65)#712 |
| 17. | Gilberts | 2.08% | 0.28%(+1.80)#17 | 0.49%(+1.59)#742 |
| 18. | Eagarville | 1.96% | 0.28%(+1.68)#18 | 0.49%(+1.47)#790 |
| 19. | Itasca | 1.89% | 0.28%(+1.61)#19 | 0.49%(+1.40)#814 |
| 20. | Peru | 1.88% | 0.28%(+1.61)#20 | 0.49%(+1.39)#823 |
| 21. | Rochester | 1.60% | 0.28%(+1.32)#21 | 0.49%(+1.11)#1,041 |
| 22. | Scott Afb | 1.47% | 0.28%(+1.19)#22 | 0.49%(+0.979)#1,149 |
| 23. | Dongola | 1.40% | 0.28%(+1.12)#23 | 0.49%(+0.909)#1,209 |
| 24. | Maryville | 1.34% | 0.28%(+1.06)#24 | 0.49%(+0.851)#1,256 |
| 25. | Oak Park | 1.31% | 0.28%(+1.04)#25 | 0.49%(+0.826)#1,285 |
| 26. | Barrington Hills | 1.31% | 0.28%(+1.03)#26 | 0.49%(+0.824)#1,287 |
| 27. | Keyesport | 1.31% | 0.28%(+1.03)#27 | 0.49%(+0.818)#1,296 |
| 28. | La Moille | 1.29% | 0.28%(+1.01)#28 | 0.49%(+0.798)#1,320 |
| 29. | St Johns | 1.16% | 0.28%(+0.886)#29 | 0.49%(+0.675)#1,458 |
| 30. | Arlington Heights | 1.16% | 0.28%(+0.884)#30 | 0.49%(+0.673)#1,461 |
| 31. | De Soto | 1.13% | 0.28%(+0.852)#31 | 0.49%(+0.641)#1,503 |
| 32. | Hecker | 1.11% | 0.28%(+0.834)#32 | 0.49%(+0.624)#1,519 |
| 33. | Rolling Meadows | 1.11% | 0.28%(+0.833)#33 | 0.49%(+0.623)#1,521 |
| 34. | Jerseyville | 1.09% | 0.28%(+0.812)#34 | 0.49%(+0.601)#1,538 |
| 35. | Valmeyer | 1.09% | 0.28%(+0.810)#35 | 0.49%(+0.599)#1,542 |
| 36. | Maroa | 1.07% | 0.28%(+0.790)#36 | 0.49%(+0.579)#1,570 |
| 37. | Boulder Hill | 1.06% | 0.28%(+0.781)#37 | 0.49%(+0.570)#1,583 |
| 38. | Bellflower | 1.06% | 0.28%(+0.779)#38 | 0.49%(+0.568)#1,585 |
| 39. | River Forest | 1.05% | 0.28%(+0.769)#39 | 0.49%(+0.558)#1,600 |
| 40. | Long Grove | 1.04% | 0.28%(+0.762)#40 | 0.49%(+0.551)#1,612 |
| 41. | Hometown | 1.02% | 0.28%(+0.747)#41 | 0.49%(+0.536)#1,638 |
| 42. | Shabbona | 1.02% | 0.28%(+0.739)#42 | 0.49%(+0.528)#1,654 |
| 43. | Streamwood | 1.01% | 0.28%(+0.732)#43 | 0.49%(+0.521)#1,665 |
| 44. | Westfield | 0.99% | 0.28%(+0.717)#44 | 0.49%(+0.507)#1,695 |
| 45. | Buffalo Grove | 0.99% | 0.28%(+0.716)#45 | 0.49%(+0.505)#1,699 |
| 46. | Kenilworth | 0.99% | 0.28%(+0.709)#46 | 0.49%(+0.498)#1,714 |
| 47. | Aviston | 0.98% | 0.28%(+0.705)#47 | 0.49%(+0.495)#1,722 |
| 48. | Downs | 0.98% | 0.28%(+0.704)#48 | 0.49%(+0.493)#1,728 |
| 49. | Toluca | 0.96% | 0.28%(+0.686)#49 | 0.49%(+0.476)#1,752 |
| 50. | Pontoosuc | 0.96% | 0.28%(+0.685)#50 | 0.49%(+0.474)#1,755 |
| 51. | Bonnie Brae | 0.93% | 0.28%(+0.658)#51 | 0.49%(+0.447)#1,803 |
| 52. | Grayslake | 0.93% | 0.28%(+0.656)#52 | 0.49%(+0.445)#1,811 |
| 53. | Long Point | 0.92% | 0.28%(+0.645)#53 | 0.49%(+0.434)#1,836 |
| 54. | Lake Barrington | 0.91% | 0.28%(+0.635)#54 | 0.49%(+0.424)#1,856 |
| 55. | Carbondale | 0.91% | 0.28%(+0.631)#55 | 0.49%(+0.420)#1,867 |
| 56. | Skokie | 0.90% | 0.28%(+0.628)#56 | 0.49%(+0.417)#1,874 |
| 57. | Evanston | 0.90% | 0.28%(+0.626)#57 | 0.49%(+0.416)#1,882 |
| 58. | Park Ridge | 0.89% | 0.28%(+0.612)#58 | 0.49%(+0.402)#1,913 |
| 59. | Bryant | 0.89% | 0.28%(+0.612)#59 | 0.49%(+0.401)#1,916 |
| 60. | Lincolnwood | 0.88% | 0.28%(+0.605)#60 | 0.49%(+0.394)#1,929 |
| 61. | Mount Clare | 0.88% | 0.28%(+0.603)#61 | 0.49%(+0.392)#1,935 |
| 62. | Palatine | 0.88% | 0.28%(+0.602)#62 | 0.49%(+0.392)#1,937 |
| 63. | Lake Zurich | 0.88% | 0.28%(+0.599)#63 | 0.49%(+0.388)#1,944 |
| 64. | Bondville | 0.87% | 0.28%(+0.598)#64 | 0.49%(+0.387)#1,952 |
| 65. | Bethalto | 0.87% | 0.28%(+0.596)#65 | 0.49%(+0.385)#1,959 |
| 66. | Elk Grove Village | 0.87% | 0.28%(+0.594)#66 | 0.49%(+0.383)#1,967 |
| 67. | St Joseph | 0.86% | 0.28%(+0.588)#67 | 0.49%(+0.377)#1,981 |
| 68. | Geneva | 0.86% | 0.28%(+0.579)#68 | 0.49%(+0.368)#2,000 |
| 69. | Warrenville | 0.85% | 0.28%(+0.577)#69 | 0.49%(+0.366)#2,005 |
| 70. | Monmouth | 0.83% | 0.28%(+0.556)#70 | 0.49%(+0.345)#2,049 |
| 71. | Morton Grove | 0.82% | 0.28%(+0.546)#71 | 0.49%(+0.335)#2,068 |
| 72. | Lincolnshire | 0.82% | 0.28%(+0.545)#72 | 0.49%(+0.335)#2,075 |
| 73. | Crestwood | 0.82% | 0.28%(+0.543)#73 | 0.49%(+0.332)#2,085 |
| 74. | Cherry Valley | 0.81% | 0.28%(+0.537)#74 | 0.49%(+0.326)#2,099 |
| 75. | Lake In The Hills | 0.80% | 0.28%(+0.524)#75 | 0.49%(+0.314)#2,131 |
| 76. | Grandwood Park | 0.80% | 0.28%(+0.521)#76 | 0.49%(+0.310)#2,142 |
| 77. | Mokena | 0.76% | 0.28%(+0.483)#77 | 0.49%(+0.272)#2,234 |
| 78. | Peoria Heights | 0.75% | 0.28%(+0.470)#78 | 0.49%(+0.260)#2,261 |
| 79. | Bonnie | 0.74% | 0.28%(+0.468)#79 | 0.49%(+0.257)#2,267 |
| 80. | O Fallon | 0.74% | 0.28%(+0.465)#80 | 0.49%(+0.254)#2,275 |
| 81. | Belknap | 0.72% | 0.28%(+0.448)#81 | 0.49%(+0.237)#2,312 |
| 82. | Algonquin | 0.72% | 0.28%(+0.446)#82 | 0.49%(+0.235)#2,317 |
| 83. | Brimfield | 0.72% | 0.28%(+0.443)#83 | 0.49%(+0.232)#2,324 |
| 84. | Northbrook | 0.71% | 0.28%(+0.436)#84 | 0.49%(+0.225)#2,337 |
| 85. | Mahomet | 0.70% | 0.28%(+0.425)#85 | 0.49%(+0.214)#2,371 |
| 86. | Mount Morris | 0.70% | 0.28%(+0.424)#86 | 0.49%(+0.214)#2,374 |
| 87. | Kaneville | 0.70% | 0.28%(+0.424)#87 | 0.49%(+0.213)#2,376 |
| 88. | Hamilton | 0.69% | 0.28%(+0.416)#88 | 0.49%(+0.205)#2,396 |
| 89. | Donovan | 0.66% | 0.28%(+0.381)#89 | 0.49%(+0.170)#2,483 |
| 90. | Lindenhurst | 0.65% | 0.28%(+0.376)#90 | 0.49%(+0.165)#2,498 |
| 91. | Williamson | 0.65% | 0.28%(+0.373)#91 | 0.49%(+0.162)#2,510 |
| 92. | South Elgin | 0.64% | 0.28%(+0.361)#92 | 0.49%(+0.150)#2,546 |
| 93. | Claremont | 0.63% | 0.28%(+0.352)#93 | 0.49%(+0.141)#2,590 |
| 94. | Washburn | 0.62% | 0.28%(+0.344)#94 | 0.49%(+0.134)#2,617 |
| 95. | Huntley | 0.62% | 0.28%(+0.342)#95 | 0.49%(+0.131)#2,623 |
| 96. | Urbana | 0.62% | 0.28%(+0.340)#96 | 0.49%(+0.129)#2,626 |
| 97. | Inverness | 0.61% | 0.28%(+0.332)#97 | 0.49%(+0.121)#2,649 |
| 98. | Riverside | 0.61% | 0.28%(+0.330)#98 | 0.49%(+0.120)#2,652 |
| 99. | Minooka | 0.59% | 0.28%(+0.318)#99 | 0.49%(+0.107)#2,692 |
| 100. | Assumption | 0.59% | 0.28%(+0.309)#100 | 0.49%(+0.098)#2,719 |
Common Questions
What are the Top 10 Cities with the Highest Percentage of Bhutanese Population in Illinois?
Top 10 Cities with the Highest Percentage of Bhutanese Population in Illinois are:
#1
8.33%
#2
7.14%
#3
5.23%
#4
4.13%
#5
3.99%
#6
3.57%
#7
3.03%
#8
2.59%
#9
2.58%
#10
2.36%
What city has the Highest Percentage of Bhutanese Population in Illinois?
Kaskaskia has the Highest Percentage of Bhutanese Population in Illinois with 8.33%.
What is the Percentage of Bhutanese Population in the State of Illinois?
Percentage of Bhutanese Population in Illinois is 0.28%.
What is the Percentage of Bhutanese Population in the United States?
Percentage of Bhutanese Population in the United States is 0.49%.