Cities with the Highest Percentage of Bhutanese Population in Arizona
RELATED REPORTS & OPTIONS
Bhutanese
Arizona
Compare Cities
Map of Cities with the Highest Percentage of Bhutanese Population in Arizona
0.00%
15.00%
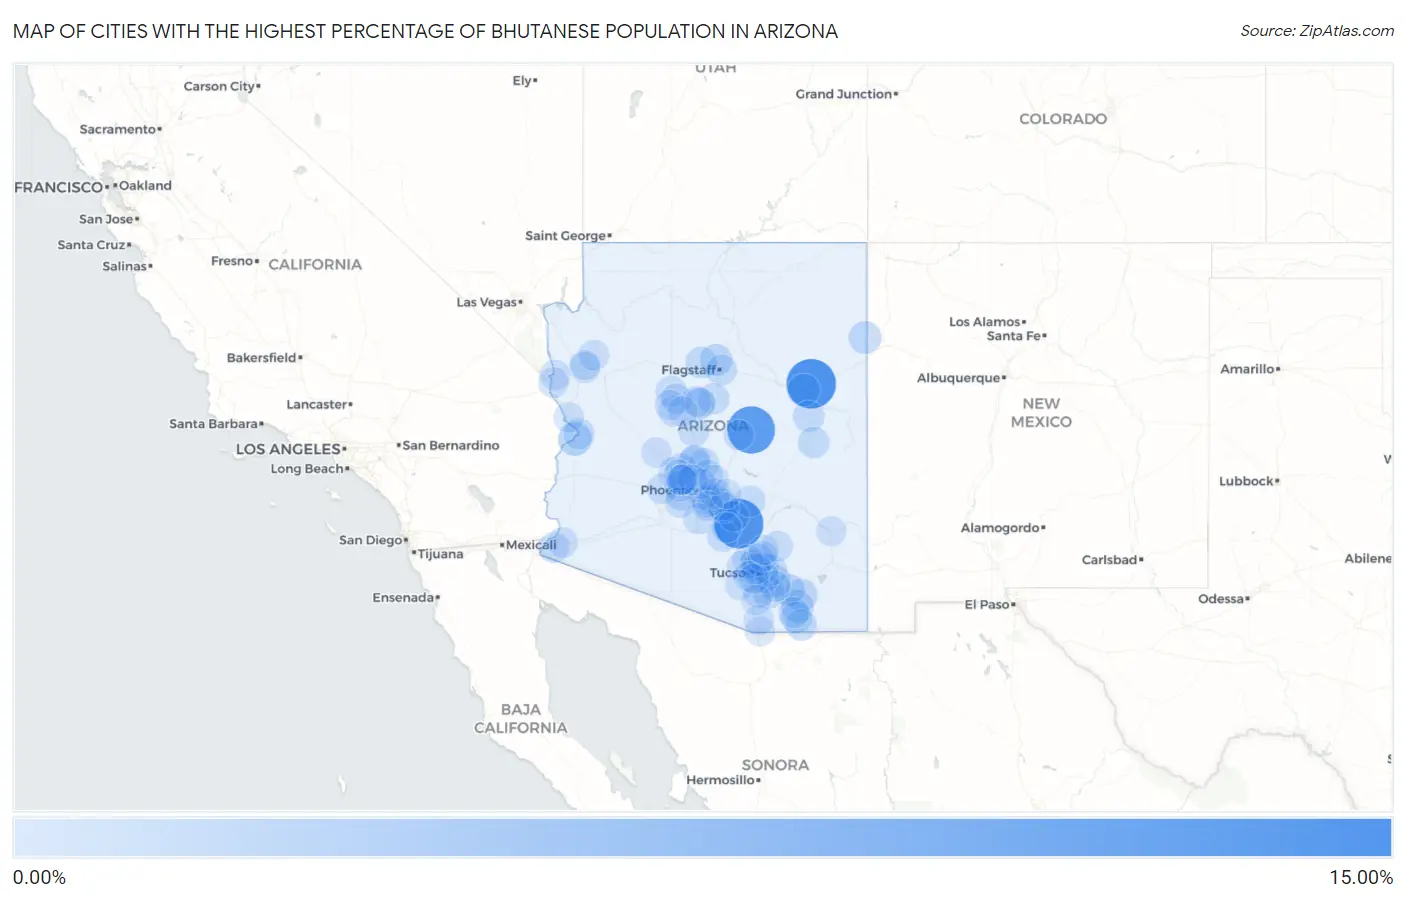
Cities with the Highest Percentage of Bhutanese Population in Arizona
| City | Bhutanese | vs State | vs National | |
| 1. | Sun Valley | 12.38% | 0.41% (+12.0)#1 | 0.49% (+11.9)#111 |
| 2. | Cactus Forest | 12.24% | 0.41% (+11.8)#2 | 0.49% (+11.8)#112 |
| 3. | Kohls Ranch | 10.96% | 0.41% (+10.6)#3 | 0.49% (+10.5)#124 |
| 4. | Oak Creek Canyon | 3.44% | 0.41% (+3.03)#4 | 0.49% (+2.95)#395 |
| 5. | Cienega Springs | 2.22% | 0.41% (+1.81)#5 | 0.49% (+1.73)#673 |
| 6. | St Michaels | 1.55% | 0.41% (+1.14)#6 | 0.49% (+1.06)#1,077 |
| 7. | Holbrook | 1.55% | 0.41% (+1.14)#7 | 0.49% (+1.06)#1,082 |
| 8. | St David | 1.46% | 0.41% (+1.05)#8 | 0.49% (+0.974)#1,154 |
| 9. | Whetstone | 1.43% | 0.41% (+1.02)#9 | 0.49% (+0.944)#1,173 |
| 10. | Fort Valley | 1.27% | 0.41% (+0.861)#10 | 0.49% (+0.781)#1,338 |
| 11. | Mescal | 1.23% | 0.41% (+0.819)#11 | 0.49% (+0.739)#1,383 |
| 12. | Oro Valley | 1.21% | 0.41% (+0.797)#12 | 0.49% (+0.718)#1,405 |
| 13. | Rincon Valley | 1.17% | 0.41% (+0.765)#13 | 0.49% (+0.685)#1,442 |
| 14. | Queen Creek | 1.10% | 0.41% (+0.691)#14 | 0.49% (+0.611)#1,532 |
| 15. | Corona De Tucson | 1.05% | 0.41% (+0.645)#15 | 0.49% (+0.565)#1,590 |
| 16. | Anthem | 1.03% | 0.41% (+0.618)#16 | 0.49% (+0.539)#1,632 |
| 17. | Parks | 0.96% | 0.41% (+0.554)#17 | 0.49% (+0.474)#1,754 |
| 18. | Gilbert | 0.96% | 0.41% (+0.552)#18 | 0.49% (+0.472)#1,759 |
| 19. | Chandler | 0.94% | 0.41% (+0.535)#19 | 0.49% (+0.455)#1,788 |
| 20. | Snowflake | 0.86% | 0.41% (+0.448)#20 | 0.49% (+0.368)#1,999 |
| 21. | Lake Of The Woods | 0.82% | 0.41% (+0.410)#21 | 0.49% (+0.330)#2,090 |
| 22. | Sierra Vista | 0.79% | 0.41% (+0.384)#22 | 0.49% (+0.304)#2,152 |
| 23. | Tanque Verde | 0.78% | 0.41% (+0.375)#23 | 0.49% (+0.295)#2,175 |
| 24. | Sierra Vista Southeast | 0.78% | 0.41% (+0.370)#24 | 0.49% (+0.290)#2,192 |
| 25. | Tempe | 0.77% | 0.41% (+0.365)#25 | 0.49% (+0.285)#2,205 |
| 26. | Superior | 0.72% | 0.41% (+0.312)#26 | 0.49% (+0.232)#2,323 |
| 27. | Carefree | 0.65% | 0.41% (+0.246)#27 | 0.49% (+0.166)#2,494 |
| 28. | Catalina Foothills | 0.65% | 0.41% (+0.239)#28 | 0.49% (+0.159)#2,517 |
| 29. | Flagstaff | 0.65% | 0.41% (+0.238)#29 | 0.49% (+0.158)#2,520 |
| 30. | Vail | 0.64% | 0.41% (+0.228)#30 | 0.49% (+0.149)#2,552 |
| 31. | Village Of Oak Creek Big Park | 0.63% | 0.41% (+0.218)#31 | 0.49% (+0.138)#2,605 |
| 32. | Eloy | 0.62% | 0.41% (+0.208)#32 | 0.49% (+0.128)#2,630 |
| 33. | Parker Strip | 0.61% | 0.41% (+0.207)#33 | 0.49% (+0.127)#2,638 |
| 34. | Huachuca City | 0.59% | 0.41% (+0.182)#34 | 0.49% (+0.102)#2,700 |
| 35. | Avondale | 0.57% | 0.41% (+0.165)#35 | 0.49% (+0.085)#2,763 |
| 36. | Peoria | 0.57% | 0.41% (+0.159)#36 | 0.49% (+0.079)#2,797 |
| 37. | Cordes Lakes | 0.54% | 0.41% (+0.136)#37 | 0.49% (+0.057)#2,899 |
| 38. | Casas Adobes | 0.54% | 0.41% (+0.136)#38 | 0.49% (+0.056)#2,904 |
| 39. | Kingman | 0.54% | 0.41% (+0.131)#39 | 0.49% (+0.051)#2,920 |
| 40. | Paulden | 0.53% | 0.41% (+0.124)#40 | 0.49% (+0.044)#2,949 |
| 41. | Mesa | 0.51% | 0.41% (+0.100)#41 | 0.49% (+0.020)#3,045 |
| 42. | Cottonwood | 0.50% | 0.41% (+0.088)#42 | 0.49% (+0.008)#3,103 |
| 43. | Maricopa | 0.46% | 0.41% (+0.055)#43 | 0.49% (-0.024)#3,259 |
| 44. | New River | 0.46% | 0.41% (+0.054)#44 | 0.49% (-0.026)#3,272 |
| 45. | Tucson | 0.45% | 0.41% (+0.039)#45 | 0.49% (-0.040)#3,347 |
| 46. | Scottsdale | 0.43% | 0.41% (+0.026)#46 | 0.49% (-0.053)#3,413 |
| 47. | Surprise | 0.42% | 0.41% (+0.011)#47 | 0.49% (-0.069)#3,489 |
| 48. | San Tan Valley | 0.41% | 0.41% (+0.003)#48 | 0.49% (-0.076)#3,526 |
| 49. | Prescott | 0.41% | 0.41% (+0.001)#49 | 0.49% (-0.079)#3,548 |
| 50. | Yuma | 0.40% | 0.41% (-0.008)#50 | 0.49% (-0.088)#3,596 |
| 51. | Litchfield Park | 0.40% | 0.41% (-0.010)#51 | 0.49% (-0.090)#3,606 |
| 52. | San Manuel | 0.40% | 0.41% (-0.012)#52 | 0.49% (-0.091)#3,615 |
| 53. | Picture Rocks | 0.36% | 0.41% (-0.051)#53 | 0.49% (-0.131)#3,840 |
| 54. | Buckeye | 0.36% | 0.41% (-0.052)#54 | 0.49% (-0.132)#3,848 |
| 55. | Sahuarita | 0.35% | 0.41% (-0.060)#55 | 0.49% (-0.140)#3,903 |
| 56. | Sun City West | 0.34% | 0.41% (-0.066)#56 | 0.49% (-0.146)#3,953 |
| 57. | Marana | 0.34% | 0.41% (-0.071)#57 | 0.49% (-0.151)#3,987 |
| 58. | Chino Valley | 0.34% | 0.41% (-0.072)#58 | 0.49% (-0.152)#3,996 |
| 59. | Glendale | 0.33% | 0.41% (-0.076)#59 | 0.49% (-0.156)#4,024 |
| 60. | Bullhead City | 0.33% | 0.41% (-0.078)#60 | 0.49% (-0.158)#4,038 |
| 61. | Fort Mohave | 0.32% | 0.41% (-0.090)#61 | 0.49% (-0.170)#4,103 |
| 62. | Paradise Valley | 0.32% | 0.41% (-0.092)#62 | 0.49% (-0.172)#4,117 |
| 63. | Fortuna Foothills | 0.31% | 0.41% (-0.096)#63 | 0.49% (-0.175)#4,149 |
| 64. | Goodyear | 0.31% | 0.41% (-0.096)#64 | 0.49% (-0.176)#4,157 |
| 65. | Valle Vista | 0.30% | 0.41% (-0.104)#65 | 0.49% (-0.184)#4,215 |
| 66. | Phoenix | 0.29% | 0.41% (-0.115)#66 | 0.49% (-0.195)#4,288 |
| 67. | Wickenburg | 0.26% | 0.41% (-0.144)#67 | 0.49% (-0.224)#4,492 |
| 68. | Flowing Wells | 0.26% | 0.41% (-0.146)#68 | 0.49% (-0.226)#4,503 |
| 69. | Florence | 0.24% | 0.41% (-0.171)#69 | 0.49% (-0.251)#4,725 |
| 70. | Verde Village | 0.23% | 0.41% (-0.174)#70 | 0.49% (-0.254)#4,753 |
| 71. | Clarkdale | 0.22% | 0.41% (-0.187)#71 | 0.49% (-0.267)#4,848 |
| 72. | Catalina | 0.22% | 0.41% (-0.188)#72 | 0.49% (-0.268)#4,860 |
| 73. | Payson | 0.20% | 0.41% (-0.206)#73 | 0.49% (-0.286)#5,020 |
| 74. | Williamson | 0.20% | 0.41% (-0.208)#74 | 0.49% (-0.287)#5,028 |
| 75. | Sun City | 0.19% | 0.41% (-0.214)#75 | 0.49% (-0.294)#5,097 |
| 76. | Lake Havasu City | 0.17% | 0.41% (-0.233)#76 | 0.49% (-0.313)#5,285 |
| 77. | Tucson Mountains | 0.15% | 0.41% (-0.255)#77 | 0.49% (-0.335)#5,509 |
| 78. | El Mirage | 0.15% | 0.41% (-0.259)#78 | 0.49% (-0.339)#5,540 |
| 79. | Sun Lakes | 0.15% | 0.41% (-0.259)#79 | 0.49% (-0.339)#5,544 |
| 80. | Tucson Estates | 0.14% | 0.41% (-0.267)#80 | 0.49% (-0.347)#5,628 |
| 81. | Three Points | 0.14% | 0.41% (-0.270)#81 | 0.49% (-0.350)#5,668 |
| 82. | Coolidge | 0.12% | 0.41% (-0.288)#82 | 0.49% (-0.368)#5,866 |
| 83. | Saddlebrooke | 0.12% | 0.41% (-0.291)#83 | 0.49% (-0.371)#5,905 |
| 84. | Prescott Valley | 0.11% | 0.41% (-0.293)#84 | 0.49% (-0.373)#5,922 |
| 85. | Fountain Hills | 0.11% | 0.41% (-0.294)#85 | 0.49% (-0.374)#5,937 |
| 86. | Green Valley | 0.091% | 0.41% (-0.317)#86 | 0.49% (-0.397)#6,186 |
| 87. | Safford | 0.089% | 0.41% (-0.319)#87 | 0.49% (-0.398)#6,200 |
| 88. | Nogales | 0.061% | 0.41% (-0.347)#88 | 0.49% (-0.427)#6,490 |
| 89. | New Kingman Butler | 0.060% | 0.41% (-0.347)#89 | 0.49% (-0.427)#6,496 |
| 90. | Rio Rico | 0.051% | 0.41% (-0.356)#90 | 0.49% (-0.436)#6,605 |
| 91. | Drexel Heights | 0.050% | 0.41% (-0.358)#91 | 0.49% (-0.438)#6,620 |
| 92. | Apache Junction | 0.041% | 0.41% (-0.366)#92 | 0.49% (-0.446)#6,707 |
1
2Common Questions
What are the Top 10 Cities with the Highest Percentage of Bhutanese Population in Arizona?
Top 10 Cities with the Highest Percentage of Bhutanese Population in Arizona are:
#1
12.38%
#2
12.24%
#3
10.96%
#4
2.22%
#5
1.55%
#6
1.55%
#7
1.46%
#8
1.43%
#9
1.27%
#10
1.23%
What city has the Highest Percentage of Bhutanese Population in Arizona?
Sun Valley has the Highest Percentage of Bhutanese Population in Arizona with 12.38%.
What is the Percentage of Bhutanese Population in the State of Arizona?
Percentage of Bhutanese Population in Arizona is 0.41%.
What is the Percentage of Bhutanese Population in the United States?
Percentage of Bhutanese Population in the United States is 0.49%.