Cities with the Highest Percentage of Bhutanese Population in Virginia
RELATED REPORTS & OPTIONS
Bhutanese
Virginia
Compare Cities
Map of Cities with the Highest Percentage of Bhutanese Population in Virginia
0.00%
8.00%
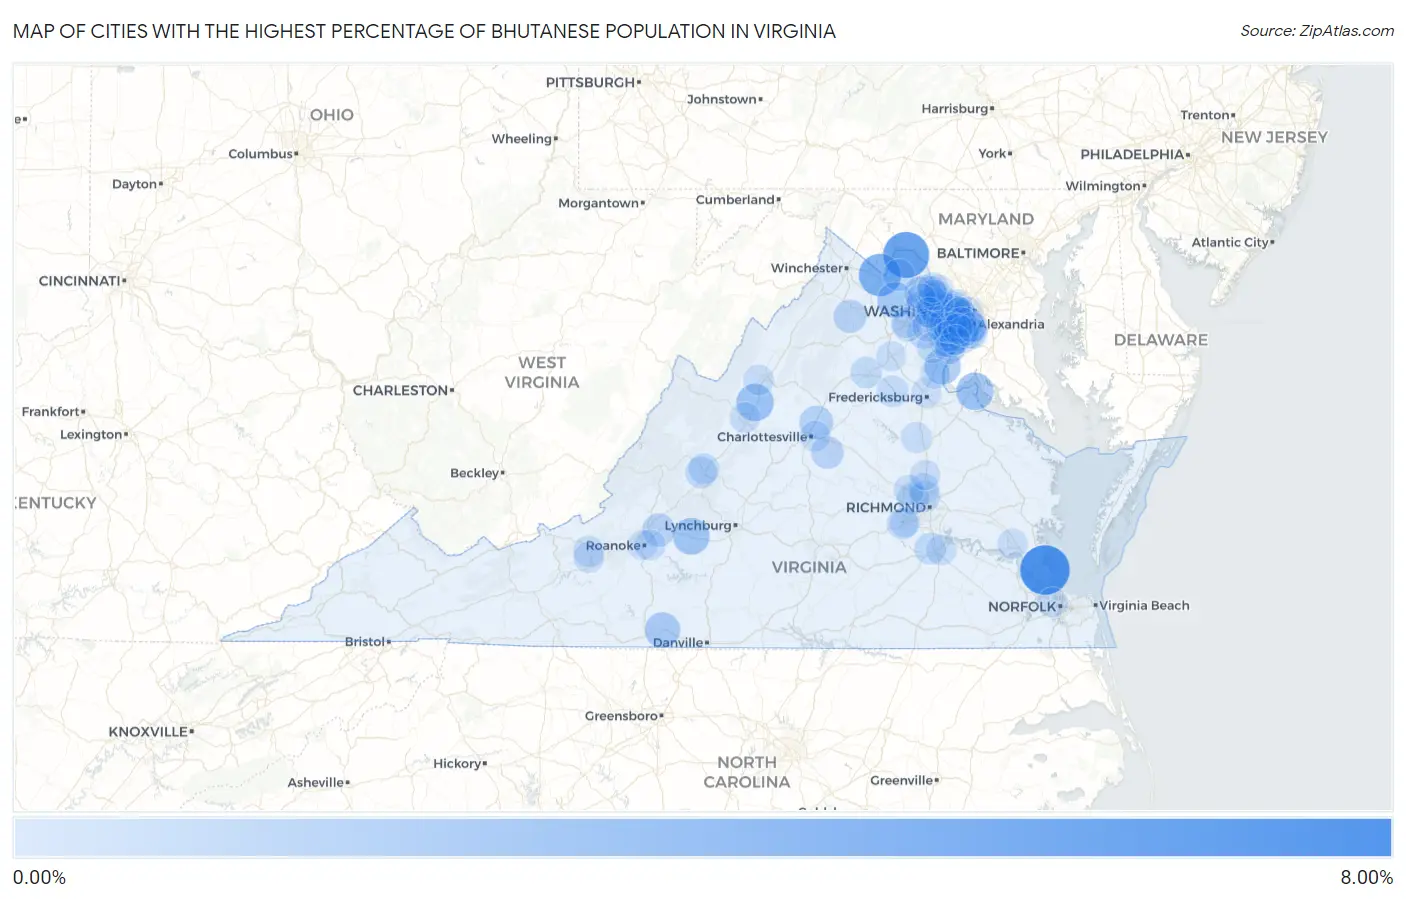
Cities with the Highest Percentage of Bhutanese Population in Virginia
| City | Bhutanese | vs State | vs National | |
| 1. | Bethel Manor | 7.28% | 0.35%(+6.93)#1 | 0.49%(+6.79)#191 |
| 2. | Earlysville | 6.09% | 0.35%(+5.74)#2 | 0.49%(+5.60)#230 |
| 3. | Lovettsville | 5.96% | 0.35%(+5.61)#3 | 0.49%(+5.48)#235 |
| 4. | Shenandoah Retreat | 4.66% | 0.35%(+4.31)#4 | 0.49%(+4.17)#297 |
| 5. | Mount Sidney | 2.91% | 0.35%(+2.56)#5 | 0.49%(+2.42)#472 |
| 6. | Dahlgren Center | 2.90% | 0.35%(+2.55)#6 | 0.49%(+2.42)#473 |
| 7. | Bedford | 2.73% | 0.35%(+2.38)#7 | 0.49%(+2.24)#520 |
| 8. | Quantico Base | 2.55% | 0.35%(+2.20)#8 | 0.49%(+2.06)#561 |
| 9. | Middleburg | 2.33% | 0.35%(+1.98)#9 | 0.49%(+1.85)#625 |
| 10. | Chatmoss | 2.26% | 0.35%(+1.90)#10 | 0.49%(+1.77)#658 |
| 11. | Ravensworth | 2.07% | 0.35%(+1.72)#11 | 0.49%(+1.58)#746 |
| 12. | Hutchison | 1.80% | 0.35%(+1.45)#12 | 0.49%(+1.31)#886 |
| 13. | Dunn Loring | 1.72% | 0.35%(+1.37)#13 | 0.49%(+1.24)#938 |
| 14. | Newington Forest | 1.65% | 0.35%(+1.30)#14 | 0.49%(+1.17)#996 |
| 15. | Hollymead | 1.65% | 0.35%(+1.30)#15 | 0.49%(+1.16)#998 |
| 16. | Floris | 1.62% | 0.35%(+1.27)#16 | 0.49%(+1.13)#1,025 |
| 17. | Chester Gap | 1.50% | 0.35%(+1.15)#17 | 0.49%(+1.01)#1,123 |
| 18. | Blue Ridge | 1.47% | 0.35%(+1.12)#18 | 0.49%(+0.982)#1,146 |
| 19. | Vienna | 1.40% | 0.35%(+1.05)#19 | 0.49%(+0.915)#1,201 |
| 20. | South Riding | 1.34% | 0.35%(+0.989)#20 | 0.49%(+0.853)#1,253 |
| 21. | Kingstowne | 1.32% | 0.35%(+0.966)#21 | 0.49%(+0.829)#1,280 |
| 22. | Laurel Hill | 1.31% | 0.35%(+0.957)#22 | 0.49%(+0.821)#1,290 |
| 23. | Occoquan | 1.31% | 0.35%(+0.955)#23 | 0.49%(+0.818)#1,294 |
| 24. | Lake Monticello | 1.30% | 0.35%(+0.950)#24 | 0.49%(+0.814)#1,304 |
| 25. | Manassas | 1.25% | 0.35%(+0.897)#25 | 0.49%(+0.761)#1,358 |
| 26. | Greenbriar | 1.20% | 0.35%(+0.845)#26 | 0.49%(+0.708)#1,417 |
| 27. | South Run | 1.11% | 0.35%(+0.758)#27 | 0.49%(+0.622)#1,522 |
| 28. | Ashburn | 1.09% | 0.35%(+0.742)#28 | 0.49%(+0.605)#1,534 |
| 29. | Lake Barcroft | 1.08% | 0.35%(+0.725)#29 | 0.49%(+0.589)#1,553 |
| 30. | George Mason | 1.05% | 0.35%(+0.697)#30 | 0.49%(+0.561)#1,595 |
| 31. | Tysons | 1.04% | 0.35%(+0.688)#31 | 0.49%(+0.552)#1,611 |
| 32. | Fort Belvoir | 1.04% | 0.35%(+0.685)#32 | 0.49%(+0.549)#1,614 |
| 33. | Purcellville | 1.03% | 0.35%(+0.679)#33 | 0.49%(+0.543)#1,626 |
| 34. | Kings Park | 1.02% | 0.35%(+0.673)#34 | 0.49%(+0.537)#1,635 |
| 35. | Lexington | 1.02% | 0.35%(+0.670)#35 | 0.49%(+0.533)#1,644 |
| 36. | Broadlands | 1.01% | 0.35%(+0.664)#36 | 0.49%(+0.527)#1,655 |
| 37. | Lake Of The Woods | 0.96% | 0.35%(+0.606)#37 | 0.49%(+0.470)#1,765 |
| 38. | Fair Lakes | 0.94% | 0.35%(+0.591)#38 | 0.49%(+0.454)#1,795 |
| 39. | Culpeper | 0.93% | 0.35%(+0.579)#39 | 0.49%(+0.443)#1,815 |
| 40. | Oakton | 0.93% | 0.35%(+0.577)#40 | 0.49%(+0.441)#1,823 |
| 41. | Ettrick | 0.92% | 0.35%(+0.572)#41 | 0.49%(+0.436)#1,833 |
| 42. | Hybla Valley | 0.92% | 0.35%(+0.571)#42 | 0.49%(+0.435)#1,835 |
| 43. | Franklin Farm | 0.92% | 0.35%(+0.564)#43 | 0.49%(+0.428)#1,848 |
| 44. | Burke Centre | 0.88% | 0.35%(+0.530)#44 | 0.49%(+0.394)#1,931 |
| 45. | Tuckahoe | 0.87% | 0.35%(+0.519)#45 | 0.49%(+0.382)#1,969 |
| 46. | Woodlake | 0.85% | 0.35%(+0.495)#46 | 0.49%(+0.358)#2,018 |
| 47. | Mclean | 0.84% | 0.35%(+0.488)#47 | 0.49%(+0.351)#2,040 |
| 48. | Independent Hill | 0.81% | 0.35%(+0.460)#48 | 0.49%(+0.324)#2,101 |
| 49. | Arlington | 0.81% | 0.35%(+0.455)#49 | 0.49%(+0.319)#2,108 |
| 50. | Lake Ridge | 0.79% | 0.35%(+0.438)#50 | 0.49%(+0.302)#2,159 |
| 51. | Dranesville | 0.77% | 0.35%(+0.422)#51 | 0.49%(+0.286)#2,204 |
| 52. | Lakeside | 0.75% | 0.35%(+0.399)#52 | 0.49%(+0.263)#2,249 |
| 53. | Fairfax Station | 0.75% | 0.35%(+0.398)#53 | 0.49%(+0.262)#2,254 |
| 54. | East Lexington | 0.74% | 0.35%(+0.386)#54 | 0.49%(+0.250)#2,284 |
| 55. | Groveton | 0.73% | 0.35%(+0.374)#55 | 0.49%(+0.238)#2,308 |
| 56. | Lake Land Or | 0.72% | 0.35%(+0.372)#56 | 0.49%(+0.236)#2,316 |
| 57. | Glen Allen | 0.72% | 0.35%(+0.369)#57 | 0.49%(+0.233)#2,322 |
| 58. | Pantops | 0.72% | 0.35%(+0.365)#58 | 0.49%(+0.229)#2,327 |
| 59. | Blacksburg | 0.71% | 0.35%(+0.362)#59 | 0.49%(+0.226)#2,332 |
| 60. | Braddock | 0.71% | 0.35%(+0.356)#60 | 0.49%(+0.220)#2,354 |
| 61. | Gainesville | 0.71% | 0.35%(+0.356)#61 | 0.49%(+0.220)#2,358 |
| 62. | Vinton | 0.67% | 0.35%(+0.320)#62 | 0.49%(+0.184)#2,442 |
| 63. | Kings Park West | 0.66% | 0.35%(+0.305)#63 | 0.49%(+0.169)#2,487 |
| 64. | Idylwood | 0.65% | 0.35%(+0.295)#64 | 0.49%(+0.159)#2,519 |
| 65. | Staunton | 0.65% | 0.35%(+0.294)#65 | 0.49%(+0.158)#2,526 |
| 66. | Crosspointe | 0.64% | 0.35%(+0.290)#66 | 0.49%(+0.153)#2,537 |
| 67. | Haymarket | 0.64% | 0.35%(+0.285)#67 | 0.49%(+0.149)#2,553 |
| 68. | Short Pump | 0.63% | 0.35%(+0.283)#68 | 0.49%(+0.146)#2,565 |
| 69. | Huntington | 0.63% | 0.35%(+0.281)#69 | 0.49%(+0.145)#2,572 |
| 70. | Dayton | 0.63% | 0.35%(+0.276)#70 | 0.49%(+0.139)#2,599 |
| 71. | Alexandria | 0.61% | 0.35%(+0.262)#71 | 0.49%(+0.125)#2,642 |
| 72. | Fort Hunt | 0.60% | 0.35%(+0.249)#72 | 0.49%(+0.112)#2,679 |
| 73. | Leesylvania | 0.60% | 0.35%(+0.246)#73 | 0.49%(+0.109)#2,688 |
| 74. | Merrimac | 0.59% | 0.35%(+0.237)#74 | 0.49%(+0.101)#2,704 |
| 75. | Reston | 0.58% | 0.35%(+0.233)#75 | 0.49%(+0.096)#2,724 |
| 76. | Lowes Island | 0.58% | 0.35%(+0.226)#76 | 0.49%(+0.090)#2,747 |
| 77. | Sterling | 0.58% | 0.35%(+0.225)#77 | 0.49%(+0.089)#2,750 |
| 78. | Woodbridge | 0.57% | 0.35%(+0.224)#78 | 0.49%(+0.087)#2,753 |
| 79. | Brandermill | 0.57% | 0.35%(+0.223)#79 | 0.49%(+0.087)#2,758 |
| 80. | Yorkshire | 0.57% | 0.35%(+0.217)#80 | 0.49%(+0.081)#2,788 |
| 81. | Fort Lee | 0.57% | 0.35%(+0.216)#81 | 0.49%(+0.080)#2,790 |
| 82. | Burke | 0.57% | 0.35%(+0.214)#82 | 0.49%(+0.078)#2,809 |
| 83. | Ashland | 0.56% | 0.35%(+0.213)#83 | 0.49%(+0.077)#2,815 |
| 84. | Williamsburg | 0.56% | 0.35%(+0.204)#84 | 0.49%(+0.068)#2,855 |
| 85. | West Springfield | 0.55% | 0.35%(+0.201)#85 | 0.49%(+0.064)#2,870 |
| 86. | Falls Church | 0.55% | 0.35%(+0.198)#86 | 0.49%(+0.061)#2,874 |
| 87. | Hayfield | 0.55% | 0.35%(+0.196)#87 | 0.49%(+0.059)#2,885 |
| 88. | Lincolnia | 0.55% | 0.35%(+0.194)#88 | 0.49%(+0.058)#2,896 |
| 89. | Belle Haven | 0.53% | 0.35%(+0.184)#89 | 0.49%(+0.047)#2,937 |
| 90. | Falmouth | 0.53% | 0.35%(+0.182)#90 | 0.49%(+0.046)#2,942 |
| 91. | Bealeton | 0.51% | 0.35%(+0.163)#91 | 0.49%(+0.026)#3,020 |
| 92. | Dulles Town Center | 0.51% | 0.35%(+0.159)#92 | 0.49%(+0.022)#3,032 |
| 93. | Loudoun Valley Estates | 0.49% | 0.35%(+0.143)#93 | 0.49%(+0.007)#3,106 |
| 94. | Aquia Harbour | 0.49% | 0.35%(+0.138)#94 | 0.49%(+0.002)#3,138 |
| 95. | Countryside | 0.49% | 0.35%(+0.136)#95 | 0.49%(-0.000)#3,150 |
| 96. | Springfield | 0.45% | 0.35%(+0.103)#96 | 0.49%(-0.033)#3,305 |
| 97. | Chantilly | 0.45% | 0.35%(+0.103)#97 | 0.49%(-0.033)#3,306 |
| 98. | Portsmouth | 0.45% | 0.35%(+0.095)#98 | 0.49%(-0.042)#3,354 |
| 99. | Roanoke | 0.45% | 0.35%(+0.094)#99 | 0.49%(-0.042)#3,356 |
| 100. | Lorton | 0.44% | 0.35%(+0.093)#100 | 0.49%(-0.043)#3,361 |
Common Questions
What are the Top 10 Cities with the Highest Percentage of Bhutanese Population in Virginia?
Top 10 Cities with the Highest Percentage of Bhutanese Population in Virginia are:
#1
7.28%
#2
5.96%
#3
4.66%
#4
2.91%
#5
2.90%
#6
2.73%
#7
2.55%
#8
2.33%
#9
2.26%
#10
2.07%
What city has the Highest Percentage of Bhutanese Population in Virginia?
Bethel Manor has the Highest Percentage of Bhutanese Population in Virginia with 7.28%.
What is the Percentage of Bhutanese Population in the State of Virginia?
Percentage of Bhutanese Population in Virginia is 0.35%.
What is the Percentage of Bhutanese Population in the United States?
Percentage of Bhutanese Population in the United States is 0.49%.