Cities with the Highest Poverty Level Among Married Couples in New Hampshire
RELATED REPORTS & OPTIONS
Highest Poverty | Married Couple
New Hampshire
Compare Cities
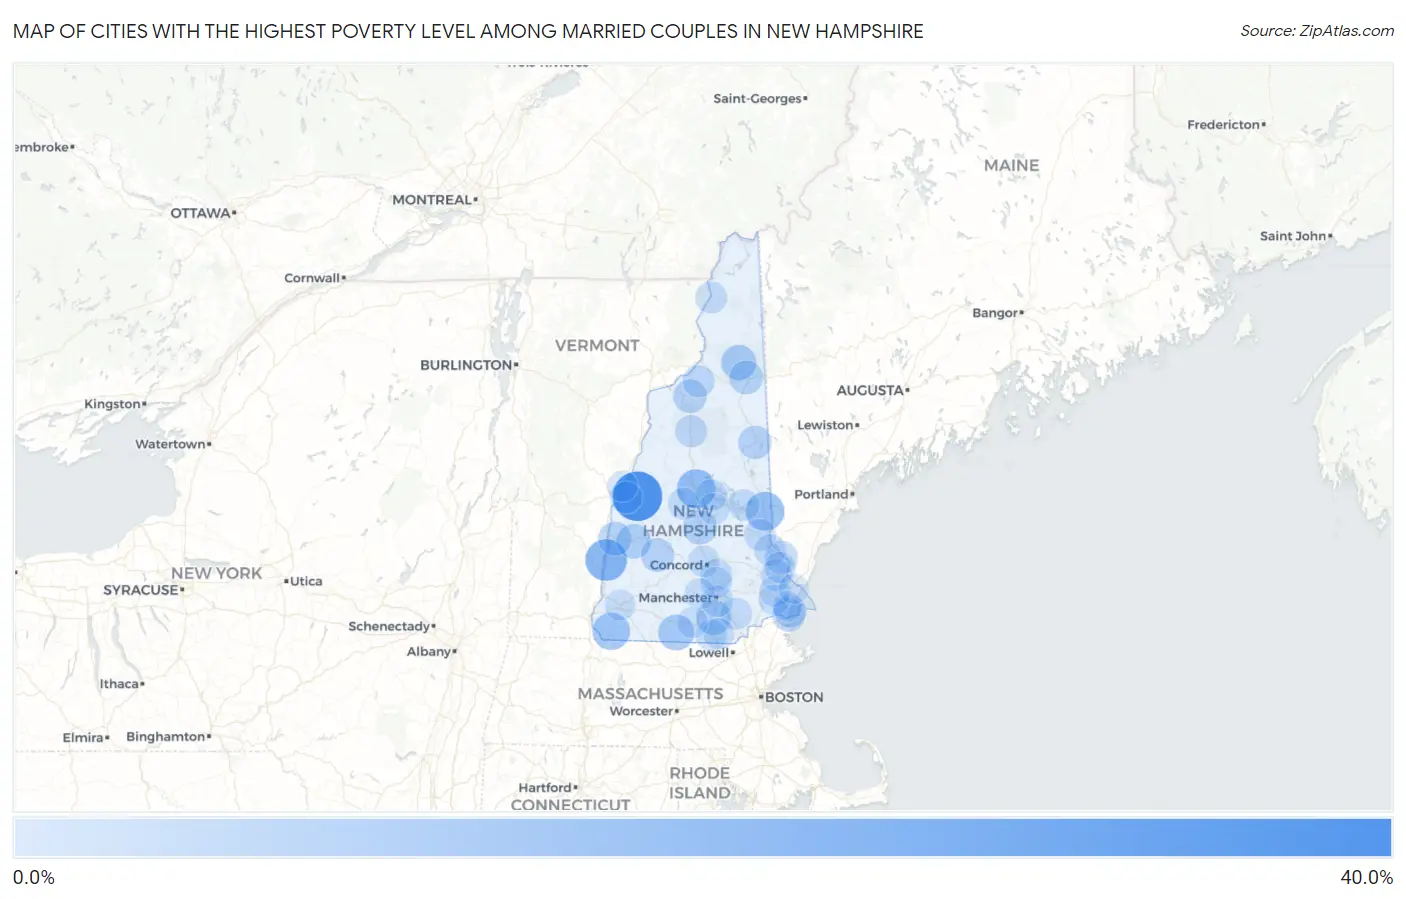
Map of Cities with the Highest Poverty Level Among Married Couples in New Hampshire
0.0%
40.0%
Cities with the Highest Poverty Level Among Married Couples in New Hampshire
| City | Married Couples Poverty | vs State | vs National | |
| 1. | Enfield | 37.6% | 2.1%(+35.6)#1 | 4.5%(+33.2)#715 |
| 2. | Charlestown | 21.9% | 2.1%(+19.8)#2 | 4.5%(+17.5)#1,808 |
| 3. | Ashland | 16.4% | 2.1%(+14.3)#3 | 4.5%(+11.9)#2,744 |
| 4. | Sanbornville | 15.9% | 2.1%(+13.9)#4 | 4.5%(+11.5)#2,860 |
| 5. | Winchester | 13.8% | 2.1%(+11.7)#5 | 4.5%(+9.33)#3,452 |
| 6. | Greenville | 10.9% | 2.1%(+8.82)#6 | 4.5%(+6.43)#4,716 |
| 7. | Berlin | 9.2% | 2.1%(+7.16)#7 | 4.5%(+4.77)#5,769 |
| 8. | East Merrimack | 8.8% | 2.1%(+6.69)#8 | 4.5%(+4.30)#6,153 |
| 9. | Newport | 8.3% | 2.1%(+6.25)#9 | 4.5%(+3.86)#6,493 |
| 10. | Tilton Northfield | 7.4% | 2.1%(+5.32)#10 | 4.5%(+2.94)#7,334 |
| 11. | Claremont | 6.9% | 2.1%(+4.86)#11 | 4.5%(+2.47)#7,839 |
| 12. | Gorham | 6.7% | 2.1%(+4.63)#12 | 4.5%(+2.24)#8,083 |
| 13. | Bradford | 6.7% | 2.1%(+4.59)#13 | 4.5%(+2.20)#8,139 |
| 14. | Bethlehem | 6.5% | 2.1%(+4.45)#14 | 4.5%(+2.06)#8,294 |
| 15. | Conway | 6.2% | 2.1%(+4.16)#15 | 4.5%(+1.78)#8,677 |
| 16. | Seabrook Beach | 5.9% | 2.1%(+3.84)#16 | 4.5%(+1.45)#9,069 |
| 17. | Somersworth | 5.2% | 2.1%(+3.11)#17 | 4.5%(+0.720)#10,177 |
| 18. | Hampton Beach | 4.5% | 2.1%(+2.45)#18 | 4.5%(+0.060)#11,258 |
| 19. | Lincoln | 3.9% | 2.1%(+1.83)#19 | 4.5%(-0.551)#12,377 |
| 20. | Whitefield | 3.7% | 2.1%(+1.58)#20 | 4.5%(-0.803)#12,897 |
| 21. | Lebanon | 3.6% | 2.1%(+1.49)#21 | 4.5%(-0.897)#13,094 |
| 22. | Suncook | 3.3% | 2.1%(+1.26)#22 | 4.5%(-1.12)#13,591 |
| 23. | Bristol | 3.3% | 2.1%(+1.25)#23 | 4.5%(-1.14)#13,642 |
| 24. | Farmington | 3.1% | 2.1%(+1.06)#24 | 4.5%(-1.33)#14,050 |
| 25. | Colebrook | 3.1% | 2.1%(+1.03)#25 | 4.5%(-1.35)#14,122 |
| 26. | Rochester | 3.0% | 2.1%(+0.928)#26 | 4.5%(-1.46)#14,357 |
| 27. | Derry | 2.9% | 2.1%(+0.776)#27 | 4.5%(-1.61)#14,724 |
| 28. | Manchester | 2.7% | 2.1%(+0.642)#28 | 4.5%(-1.74)#15,015 |
| 29. | Wolfeboro | 2.6% | 2.1%(+0.509)#29 | 4.5%(-1.88)#15,338 |
| 30. | Durham | 2.5% | 2.1%(+0.464)#30 | 4.5%(-1.92)#15,463 |
| 31. | Concord | 2.5% | 2.1%(+0.381)#31 | 4.5%(-2.00)#15,651 |
| 32. | Meredith | 2.4% | 2.1%(+0.290)#32 | 4.5%(-2.10)#15,916 |
| 33. | Newfields | 2.4% | 2.1%(+0.277)#33 | 4.5%(-2.11)#15,953 |
| 34. | Dover | 2.4% | 2.1%(+0.276)#34 | 4.5%(-2.11)#15,955 |
| 35. | Nashua | 2.3% | 2.1%(+0.257)#35 | 4.5%(-2.13)#16,000 |
| 36. | Laconia | 2.3% | 2.1%(+0.222)#36 | 4.5%(-2.16)#16,088 |
| 37. | Hudson | 2.1% | 2.1%(-0.010)#37 | 4.5%(-2.40)#16,713 |
| 38. | Hooksett | 1.9% | 2.1%(-0.128)#38 | 4.5%(-2.51)#17,015 |
| 39. | Goffstown | 1.7% | 2.1%(-0.420)#39 | 4.5%(-2.81)#17,717 |
| 40. | Hanover | 1.5% | 2.1%(-0.541)#40 | 4.5%(-2.93)#18,063 |
| 41. | Keene | 1.4% | 2.1%(-0.661)#41 | 4.5%(-3.05)#18,392 |
| 42. | Milford | 1.3% | 2.1%(-0.739)#42 | 4.5%(-3.13)#18,601 |
| 43. | Exeter | 0.72% | 2.1%(-1.35)#43 | 4.5%(-3.74)#20,062 |
| 44. | Hampton | 0.40% | 2.1%(-1.68)#44 | 4.5%(-4.06)#20,491 |
| 45. | Portsmouth | 0.12% | 2.1%(-1.96)#45 | 4.5%(-4.34)#20,623 |
1
Common Questions
What are the Top 10 Cities with the Highest Poverty Level Among Married Couples in New Hampshire?
Top 10 Cities with the Highest Poverty Level Among Married Couples in New Hampshire are:
#1
37.6%
#2
21.9%
#3
16.4%
#4
15.9%
#5
13.8%
#6
10.9%
#7
9.2%
#8
8.8%
#9
8.3%
#10
7.4%
What city has the Highest Poverty Level Among Married Couples in New Hampshire?
Enfield has the Highest Poverty Level Among Married Couples in New Hampshire with 37.6%.
What is the Poverty Level Among Married Couples in the State of New Hampshire?
Poverty Level Among Married Couples in New Hampshire is 2.1%.
What is the Poverty Level Among Married Couples in the United States?
Poverty Level Among Married Couples in the United States is 4.5%.