Cities with the Highest Poverty Level Among Married Couples in North Carolina
RELATED REPORTS & OPTIONS
Highest Poverty | Married Couple
North Carolina
Compare Cities
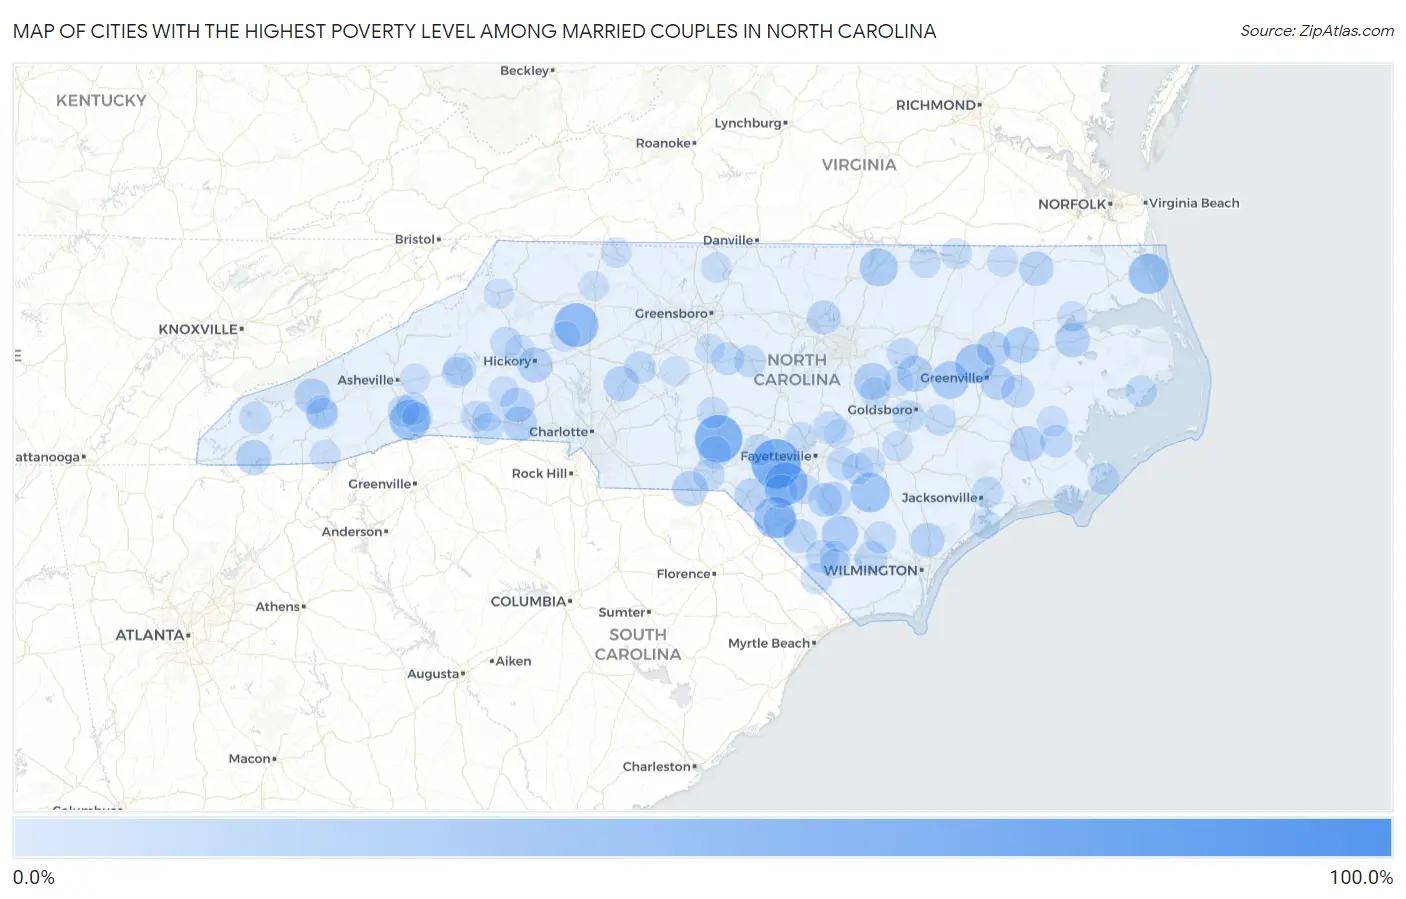
Map of Cities with the Highest Poverty Level Among Married Couples in North Carolina
0.0%
100.0%
Cities with the Highest Poverty Level Among Married Couples in North Carolina
| City | Married Couples Poverty | vs State | vs National | |
| 1. | Long Creek | 100.0% | 4.5%(+95.5)#1 | 4.5%(+95.5)#67 |
| 2. | Silver City | 65.5% | 4.5%(+61.0)#2 | 4.5%(+61.1)#204 |
| 3. | Norman | 60.0% | 4.5%(+55.5)#3 | 4.5%(+55.5)#265 |
| 4. | Love Valley | 50.0% | 4.5%(+45.5)#4 | 4.5%(+45.5)#382 |
| 5. | Shannon | 47.4% | 4.5%(+42.9)#5 | 4.5%(+42.9)#436 |
| 6. | Elrod | 43.5% | 4.5%(+39.0)#6 | 4.5%(+39.0)#524 |
| 7. | Barker Heights | 41.1% | 4.5%(+36.6)#7 | 4.5%(+36.6)#597 |
| 8. | Coinjock | 40.0% | 4.5%(+35.5)#8 | 4.5%(+35.5)#618 |
| 9. | Garland | 38.1% | 4.5%(+33.7)#9 | 4.5%(+33.7)#701 |
| 10. | Chowan Beach | 37.1% | 4.5%(+32.7)#10 | 4.5%(+32.7)#733 |
| 11. | Belvoir | 36.7% | 4.5%(+32.2)#11 | 4.5%(+32.2)#748 |
| 12. | Middleburg | 33.3% | 4.5%(+28.8)#12 | 4.5%(+28.9)#878 |
| 13. | Walstonburg | 32.3% | 4.5%(+27.8)#13 | 4.5%(+27.8)#926 |
| 14. | Wilson S Mills | 30.4% | 4.5%(+25.9)#14 | 4.5%(+25.9)#1,012 |
| 15. | Clarkton | 29.5% | 4.5%(+25.0)#15 | 4.5%(+25.0)#1,058 |
| 16. | Williamston | 29.1% | 4.5%(+24.6)#16 | 4.5%(+24.6)#1,080 |
| 17. | Lucama | 27.8% | 4.5%(+23.3)#17 | 4.5%(+23.4)#1,180 |
| 18. | Cherokee | 27.0% | 4.5%(+22.5)#18 | 4.5%(+22.5)#1,248 |
| 19. | Mcfarlan | 26.7% | 4.5%(+22.2)#19 | 4.5%(+22.2)#1,273 |
| 20. | Hayesville | 26.2% | 4.5%(+21.7)#20 | 4.5%(+21.8)#1,313 |
| 21. | Bridgeton | 26.2% | 4.5%(+21.7)#21 | 4.5%(+21.8)#1,314 |
| 22. | China Grove | 25.9% | 4.5%(+21.5)#22 | 4.5%(+21.5)#1,334 |
| 23. | Brookford | 25.8% | 4.5%(+21.3)#23 | 4.5%(+21.3)#1,347 |
| 24. | Arrowhead Beach | 25.6% | 4.5%(+21.2)#24 | 4.5%(+21.2)#1,364 |
| 25. | Roper | 25.0% | 4.5%(+20.5)#25 | 4.5%(+20.5)#1,409 |
| 26. | Light Oak | 24.8% | 4.5%(+20.3)#26 | 4.5%(+20.3)#1,473 |
| 27. | Simpson | 24.5% | 4.5%(+20.0)#27 | 4.5%(+20.1)#1,489 |
| 28. | Winton | 24.5% | 4.5%(+20.0)#28 | 4.5%(+20.0)#1,495 |
| 29. | Parmele | 23.9% | 4.5%(+19.4)#29 | 4.5%(+19.5)#1,563 |
| 30. | Rocky Point | 23.9% | 4.5%(+19.4)#30 | 4.5%(+19.4)#1,564 |
| 31. | Fallston | 23.7% | 4.5%(+19.3)#31 | 4.5%(+19.3)#1,577 |
| 32. | White Oak | 23.2% | 4.5%(+18.7)#32 | 4.5%(+18.7)#1,641 |
| 33. | Tar Heel | 23.1% | 4.5%(+18.6)#33 | 4.5%(+18.6)#1,654 |
| 34. | Gorman | 23.0% | 4.5%(+18.5)#34 | 4.5%(+18.6)#1,662 |
| 35. | Orrum | 22.2% | 4.5%(+17.7)#35 | 4.5%(+17.8)#1,764 |
| 36. | Raynham | 22.2% | 4.5%(+17.7)#36 | 4.5%(+17.8)#1,778 |
| 37. | East Laurinburg | 22.0% | 4.5%(+17.5)#37 | 4.5%(+17.5)#1,804 |
| 38. | Red Springs | 20.7% | 4.5%(+16.3)#38 | 4.5%(+16.3)#1,937 |
| 39. | Chadbourn | 20.1% | 4.5%(+15.7)#39 | 4.5%(+15.7)#2,017 |
| 40. | Dudley | 20.1% | 4.5%(+15.6)#40 | 4.5%(+15.6)#2,019 |
| 41. | Chocowinity | 20.0% | 4.5%(+15.5)#41 | 4.5%(+15.5)#2,030 |
| 42. | Fruitland | 20.0% | 4.5%(+15.5)#42 | 4.5%(+15.5)#2,089 |
| 43. | Bayboro | 19.6% | 4.5%(+15.2)#43 | 4.5%(+15.2)#2,114 |
| 44. | Bolton | 19.4% | 4.5%(+15.0)#44 | 4.5%(+15.0)#2,143 |
| 45. | Ramseur | 19.4% | 4.5%(+14.9)#45 | 4.5%(+14.9)#2,151 |
| 46. | Ellerbe | 19.0% | 4.5%(+14.5)#46 | 4.5%(+14.6)#2,218 |
| 47. | Linden | 18.5% | 4.5%(+14.0)#47 | 4.5%(+14.1)#2,305 |
| 48. | Kelly | 18.4% | 4.5%(+13.9)#48 | 4.5%(+14.0)#2,320 |
| 49. | Sylva | 18.3% | 4.5%(+13.8)#49 | 4.5%(+13.8)#2,344 |
| 50. | Siler City | 18.1% | 4.5%(+13.6)#50 | 4.5%(+13.7)#2,383 |
| 51. | Mar Mac | 18.1% | 4.5%(+13.6)#51 | 4.5%(+13.6)#2,393 |
| 52. | Autryville | 17.9% | 4.5%(+13.4)#52 | 4.5%(+13.4)#2,440 |
| 53. | East Spencer | 17.8% | 4.5%(+13.3)#53 | 4.5%(+13.3)#2,459 |
| 54. | Mountain Home | 17.7% | 4.5%(+13.2)#54 | 4.5%(+13.2)#2,471 |
| 55. | Robbinsville | 17.5% | 4.5%(+13.1)#55 | 4.5%(+13.1)#2,507 |
| 56. | Marion | 17.4% | 4.5%(+12.9)#56 | 4.5%(+12.9)#2,529 |
| 57. | Gamewell | 17.3% | 4.5%(+12.8)#57 | 4.5%(+12.9)#2,552 |
| 58. | Atlantic | 17.2% | 4.5%(+12.7)#58 | 4.5%(+12.7)#2,572 |
| 59. | La Grange | 16.8% | 4.5%(+12.3)#59 | 4.5%(+12.3)#2,658 |
| 60. | Cordova | 16.7% | 4.5%(+12.2)#60 | 4.5%(+12.2)#2,664 |
| 61. | Webster | 16.7% | 4.5%(+12.2)#61 | 4.5%(+12.2)#2,676 |
| 62. | Cliffside | 16.7% | 4.5%(+12.2)#62 | 4.5%(+12.2)#2,678 |
| 63. | Bailey | 16.5% | 4.5%(+12.0)#63 | 4.5%(+12.1)#2,724 |
| 64. | Engelhard | 16.4% | 4.5%(+12.0)#64 | 4.5%(+12.0)#2,738 |
| 65. | Pumpkin Center | 16.4% | 4.5%(+11.9)#65 | 4.5%(+12.0)#2,739 |
| 66. | Biscoe | 16.4% | 4.5%(+11.9)#66 | 4.5%(+11.9)#2,760 |
| 67. | Roseboro | 16.3% | 4.5%(+11.8)#67 | 4.5%(+11.8)#2,778 |
| 68. | West Marion | 16.1% | 4.5%(+11.7)#68 | 4.5%(+11.7)#2,804 |
| 69. | Ashley Heights | 16.0% | 4.5%(+11.5)#69 | 4.5%(+11.5)#2,837 |
| 70. | Tabor City | 15.9% | 4.5%(+11.4)#70 | 4.5%(+11.4)#2,868 |
| 71. | Whiteville | 15.7% | 4.5%(+11.2)#71 | 4.5%(+11.3)#2,917 |
| 72. | Gaston | 15.2% | 4.5%(+10.7)#72 | 4.5%(+10.8)#3,035 |
| 73. | Littleton | 15.2% | 4.5%(+10.7)#73 | 4.5%(+10.7)#3,054 |
| 74. | Forest City | 15.0% | 4.5%(+10.5)#74 | 4.5%(+10.5)#3,078 |
| 75. | Conway | 14.6% | 4.5%(+10.1)#75 | 4.5%(+10.2)#3,201 |
| 76. | Spring Lake | 14.6% | 4.5%(+10.1)#76 | 4.5%(+10.1)#3,215 |
| 77. | Aurora | 14.3% | 4.5%(+9.80)#77 | 4.5%(+9.82)#3,289 |
| 78. | Smithfield | 14.2% | 4.5%(+9.73)#78 | 4.5%(+9.76)#3,345 |
| 79. | Highlands | 14.2% | 4.5%(+9.68)#79 | 4.5%(+9.70)#3,357 |
| 80. | Toast | 14.1% | 4.5%(+9.64)#80 | 4.5%(+9.67)#3,365 |
| 81. | Faison | 14.1% | 4.5%(+9.60)#81 | 4.5%(+9.62)#3,377 |
| 82. | Wentworth | 13.8% | 4.5%(+9.34)#82 | 4.5%(+9.37)#3,445 |
| 83. | Dana | 13.6% | 4.5%(+9.09)#83 | 4.5%(+9.11)#3,527 |
| 84. | Casar | 13.6% | 4.5%(+9.07)#84 | 4.5%(+9.10)#3,533 |
| 85. | Swannanoa | 13.3% | 4.5%(+8.85)#85 | 4.5%(+8.88)#3,605 |
| 86. | Bonnetsville | 13.3% | 4.5%(+8.85)#86 | 4.5%(+8.87)#3,607 |
| 87. | St Pauls | 13.2% | 4.5%(+8.71)#87 | 4.5%(+8.74)#3,665 |
| 88. | Edenton | 13.1% | 4.5%(+8.60)#88 | 4.5%(+8.62)#3,715 |
| 89. | Hiddenite | 13.0% | 4.5%(+8.56)#89 | 4.5%(+8.58)#3,733 |
| 90. | Ellenboro | 13.0% | 4.5%(+8.51)#90 | 4.5%(+8.53)#3,754 |
| 91. | Beaufort | 12.9% | 4.5%(+8.45)#91 | 4.5%(+8.47)#3,768 |
| 92. | Godwin | 12.9% | 4.5%(+8.42)#92 | 4.5%(+8.44)#3,789 |
| 93. | Elkin | 12.8% | 4.5%(+8.29)#93 | 4.5%(+8.32)#3,839 |
| 94. | Boone | 12.6% | 4.5%(+8.14)#94 | 4.5%(+8.17)#3,880 |
| 95. | Sneads Ferry | 12.5% | 4.5%(+8.04)#95 | 4.5%(+8.06)#3,913 |
| 96. | Sawmills | 12.5% | 4.5%(+8.03)#96 | 4.5%(+8.05)#3,914 |
| 97. | Brunswick | 12.5% | 4.5%(+8.01)#97 | 4.5%(+8.04)#3,921 |
| 98. | Denton | 12.4% | 4.5%(+7.87)#98 | 4.5%(+7.89)#4,013 |
| 99. | Kenly | 12.3% | 4.5%(+7.83)#99 | 4.5%(+7.85)#4,027 |
| 100. | Randleman | 12.3% | 4.5%(+7.80)#100 | 4.5%(+7.83)#4,037 |
Common Questions
What are the Top 10 Cities with the Highest Poverty Level Among Married Couples in North Carolina?
Top 10 Cities with the Highest Poverty Level Among Married Couples in North Carolina are:
#1
65.5%
#2
60.0%
#3
50.0%
#4
47.4%
#5
43.5%
#6
41.1%
#7
40.0%
#8
38.1%
#9
36.7%
#10
33.3%
What city has the Highest Poverty Level Among Married Couples in North Carolina?
Silver City has the Highest Poverty Level Among Married Couples in North Carolina with 65.5%.
What is the Poverty Level Among Married Couples in the State of North Carolina?
Poverty Level Among Married Couples in North Carolina is 4.5%.
What is the Poverty Level Among Married Couples in the United States?
Poverty Level Among Married Couples in the United States is 4.5%.