Cities with the Highest Poverty Level Among Married Couples in Kentucky
RELATED REPORTS & OPTIONS
Highest Poverty | Married Couple
Kentucky
Compare Cities
Map of Cities with the Highest Poverty Level Among Married Couples in Kentucky
0.0%
80.0%
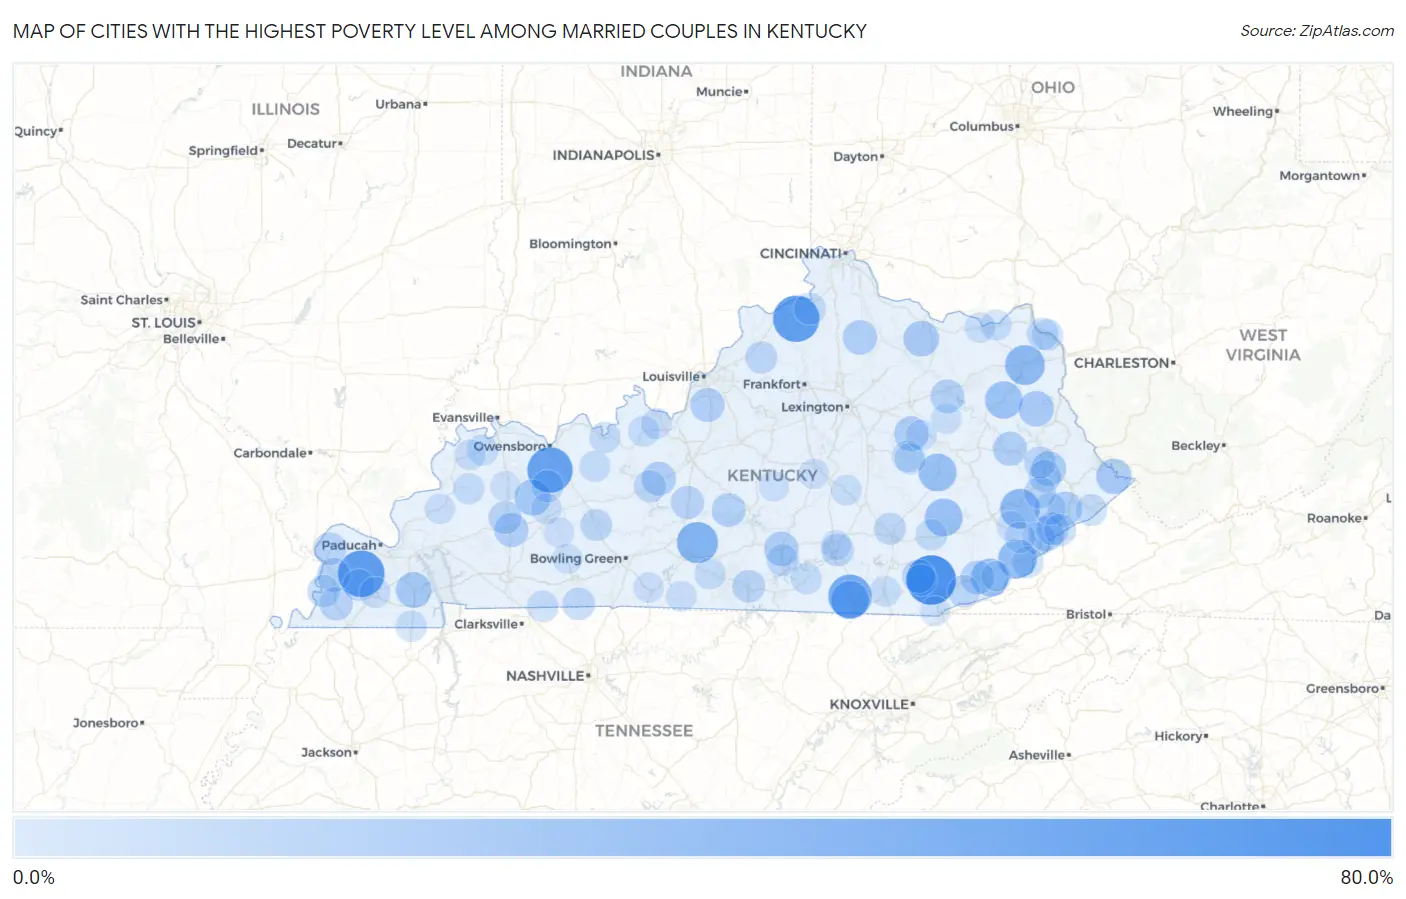
Cities with the Highest Poverty Level Among Married Couples in Kentucky
| City | Married Couples Poverty | vs State | vs National | |
| 1. | Flat Lick | 78.5% | 6.0%(+72.4)#1 | 4.5%(+74.0)#135 |
| 2. | Lowes | 68.9% | 6.0%(+62.8)#2 | 4.5%(+64.4)#172 |
| 3. | Sanders | 67.8% | 6.0%(+61.7)#3 | 4.5%(+63.3)#175 |
| 4. | Utica | 64.3% | 6.0%(+58.2)#4 | 4.5%(+59.8)#211 |
| 5. | Whitley City | 57.8% | 6.0%(+51.7)#5 | 4.5%(+53.3)#291 |
| 6. | Hiseville | 50.0% | 6.0%(+44.0)#6 | 4.5%(+45.5)#386 |
| 7. | Grayson | 45.3% | 6.0%(+39.3)#7 | 4.5%(+40.9)#484 |
| 8. | Hindman | 45.1% | 6.0%(+39.1)#8 | 4.5%(+40.7)#489 |
| 9. | Cumberland | 41.6% | 6.0%(+35.6)#9 | 4.5%(+37.2)#580 |
| 10. | Stearns | 40.3% | 6.0%(+34.3)#10 | 4.5%(+35.9)#610 |
| 11. | Beattyville | 39.4% | 6.0%(+33.3)#11 | 4.5%(+34.9)#659 |
| 12. | Ages | 39.1% | 6.0%(+33.1)#12 | 4.5%(+34.7)#667 |
| 13. | Oneida | 38.6% | 6.0%(+32.6)#13 | 4.5%(+34.2)#680 |
| 14. | Sandy Hook | 37.8% | 6.0%(+31.8)#14 | 4.5%(+33.4)#710 |
| 15. | Sacramento | 33.3% | 6.0%(+27.3)#15 | 4.5%(+28.9)#872 |
| 16. | Hardin | 32.2% | 6.0%(+26.2)#16 | 4.5%(+27.8)#927 |
| 17. | Mays Lick | 31.8% | 6.0%(+25.8)#17 | 4.5%(+27.4)#945 |
| 18. | Blaine | 31.2% | 6.0%(+25.2)#18 | 4.5%(+26.8)#970 |
| 19. | Van Lear | 31.1% | 6.0%(+25.1)#19 | 4.5%(+26.6)#977 |
| 20. | Freeburn | 31.0% | 6.0%(+25.0)#20 | 4.5%(+26.6)#984 |
| 21. | Millstone | 29.8% | 6.0%(+23.7)#21 | 4.5%(+25.3)#1,043 |
| 22. | Allen | 29.6% | 6.0%(+23.6)#22 | 4.5%(+25.2)#1,055 |
| 23. | Clay City | 29.1% | 6.0%(+23.1)#23 | 4.5%(+24.7)#1,077 |
| 24. | Russell Springs | 28.3% | 6.0%(+22.2)#24 | 4.5%(+23.8)#1,136 |
| 25. | Berry | 28.1% | 6.0%(+22.1)#25 | 4.5%(+23.7)#1,153 |
| 26. | Virgie | 27.7% | 6.0%(+21.6)#26 | 4.5%(+23.2)#1,196 |
| 27. | Salyersville | 27.0% | 6.0%(+21.0)#27 | 4.5%(+22.6)#1,240 |
| 28. | Nortonville | 26.8% | 6.0%(+20.8)#28 | 4.5%(+22.4)#1,259 |
| 29. | Big Clifty | 26.7% | 6.0%(+20.6)#29 | 4.5%(+22.2)#1,270 |
| 30. | Brooks | 26.6% | 6.0%(+20.6)#30 | 4.5%(+22.1)#1,277 |
| 31. | Summersville | 26.4% | 6.0%(+20.4)#31 | 4.5%(+22.0)#1,293 |
| 32. | Salt Lick | 25.7% | 6.0%(+19.7)#32 | 4.5%(+21.3)#1,357 |
| 33. | Loyall | 25.6% | 6.0%(+19.6)#33 | 4.5%(+21.2)#1,365 |
| 34. | Bardwell | 25.0% | 6.0%(+19.0)#34 | 4.5%(+20.5)#1,405 |
| 35. | Barbourville | 24.6% | 6.0%(+18.6)#35 | 4.5%(+20.1)#1,484 |
| 36. | Clinton | 24.4% | 6.0%(+18.4)#36 | 4.5%(+20.0)#1,500 |
| 37. | Moseleyville | 24.3% | 6.0%(+18.3)#37 | 4.5%(+19.9)#1,513 |
| 38. | Bonnieville | 23.8% | 6.0%(+17.8)#38 | 4.5%(+19.3)#1,573 |
| 39. | Earlington | 23.8% | 6.0%(+17.7)#39 | 4.5%(+19.3)#1,575 |
| 40. | Whitesburg | 23.6% | 6.0%(+17.5)#40 | 4.5%(+19.1)#1,596 |
| 41. | Fleming Neon | 22.9% | 6.0%(+16.9)#41 | 4.5%(+18.5)#1,671 |
| 42. | Barlow | 22.8% | 6.0%(+16.7)#42 | 4.5%(+18.3)#1,691 |
| 43. | Burkesville | 22.7% | 6.0%(+16.7)#43 | 4.5%(+18.3)#1,694 |
| 44. | Ferguson | 22.1% | 6.0%(+16.1)#44 | 4.5%(+17.7)#1,783 |
| 45. | Adairville | 22.1% | 6.0%(+16.0)#45 | 4.5%(+17.6)#1,793 |
| 46. | Columbus | 21.7% | 6.0%(+15.7)#46 | 4.5%(+17.3)#1,832 |
| 47. | Wheelwright | 21.4% | 6.0%(+15.4)#47 | 4.5%(+17.0)#1,860 |
| 48. | Martin | 21.4% | 6.0%(+15.4)#48 | 4.5%(+17.0)#1,864 |
| 49. | Pathfork | 21.3% | 6.0%(+15.3)#49 | 4.5%(+16.8)#1,876 |
| 50. | Clarkson | 21.2% | 6.0%(+15.2)#50 | 4.5%(+16.7)#1,890 |
| 51. | Wayland | 21.2% | 6.0%(+15.1)#51 | 4.5%(+16.7)#1,895 |
| 52. | Prestonsburg | 20.8% | 6.0%(+14.7)#52 | 4.5%(+16.3)#1,932 |
| 53. | Smithfield | 20.5% | 6.0%(+14.5)#53 | 4.5%(+16.1)#1,983 |
| 54. | Livermore | 20.4% | 6.0%(+14.4)#54 | 4.5%(+15.9)#1,997 |
| 55. | Morgantown | 20.3% | 6.0%(+14.3)#55 | 4.5%(+15.9)#1,999 |
| 56. | East Bernstadt | 20.3% | 6.0%(+14.2)#56 | 4.5%(+15.8)#2,009 |
| 57. | Jenkins | 20.0% | 6.0%(+14.0)#57 | 4.5%(+15.5)#2,027 |
| 58. | Glencoe | 20.0% | 6.0%(+14.0)#58 | 4.5%(+15.5)#2,043 |
| 59. | Fancy Farm | 20.0% | 6.0%(+14.0)#59 | 4.5%(+15.5)#2,046 |
| 60. | Jamestown | 19.8% | 6.0%(+13.7)#60 | 4.5%(+15.3)#2,102 |
| 61. | Wurtland | 19.3% | 6.0%(+13.2)#61 | 4.5%(+14.8)#2,174 |
| 62. | Manchester | 19.0% | 6.0%(+13.0)#62 | 4.5%(+14.6)#2,196 |
| 63. | Elkhorn City | 19.0% | 6.0%(+13.0)#63 | 4.5%(+14.6)#2,197 |
| 64. | Raceland | 18.9% | 6.0%(+12.9)#64 | 4.5%(+14.5)#2,227 |
| 65. | Lynch | 18.9% | 6.0%(+12.8)#65 | 4.5%(+14.4)#2,239 |
| 66. | Artemus | 18.5% | 6.0%(+12.4)#66 | 4.5%(+14.0)#2,309 |
| 67. | Irvine | 18.2% | 6.0%(+12.2)#67 | 4.5%(+13.8)#2,348 |
| 68. | Guthrie | 18.2% | 6.0%(+12.1)#68 | 4.5%(+13.7)#2,355 |
| 69. | Cloverport | 18.1% | 6.0%(+12.0)#69 | 4.5%(+13.6)#2,395 |
| 70. | Clay | 17.9% | 6.0%(+11.9)#70 | 4.5%(+13.5)#2,424 |
| 71. | Hazel | 17.8% | 6.0%(+11.8)#71 | 4.5%(+13.3)#2,450 |
| 72. | Corydon | 17.8% | 6.0%(+11.7)#72 | 4.5%(+13.3)#2,460 |
| 73. | Irvington | 17.7% | 6.0%(+11.7)#73 | 4.5%(+13.3)#2,469 |
| 74. | Ravenna | 17.7% | 6.0%(+11.6)#74 | 4.5%(+13.2)#2,470 |
| 75. | Summer Shade | 17.6% | 6.0%(+11.6)#75 | 4.5%(+13.2)#2,479 |
| 76. | Fordsville | 17.2% | 6.0%(+11.2)#76 | 4.5%(+12.8)#2,561 |
| 77. | Garrison | 17.1% | 6.0%(+11.1)#77 | 4.5%(+12.7)#2,592 |
| 78. | Monticello | 17.1% | 6.0%(+11.0)#78 | 4.5%(+12.6)#2,599 |
| 79. | Mayfield | 17.0% | 6.0%(+11.0)#79 | 4.5%(+12.6)#2,611 |
| 80. | Ekron | 16.7% | 6.0%(+10.6)#80 | 4.5%(+12.2)#2,691 |
| 81. | Blackey | 16.7% | 6.0%(+10.6)#81 | 4.5%(+12.2)#2,699 |
| 82. | South Carrollton | 16.2% | 6.0%(+10.2)#82 | 4.5%(+11.8)#2,789 |
| 83. | Williamsburg | 16.2% | 6.0%(+10.1)#83 | 4.5%(+11.7)#2,802 |
| 84. | Vanceburg | 16.1% | 6.0%(+10.1)#84 | 4.5%(+11.6)#2,815 |
| 85. | Crab Orchard | 16.0% | 6.0%(+10.00)#85 | 4.5%(+11.6)#2,825 |
| 86. | Waverly | 16.0% | 6.0%(+9.96)#86 | 4.5%(+11.5)#2,838 |
| 87. | Fountain Run | 15.8% | 6.0%(+9.75)#87 | 4.5%(+11.3)#2,891 |
| 88. | Stanton | 15.8% | 6.0%(+9.73)#88 | 4.5%(+11.3)#2,908 |
| 89. | Junction City | 15.7% | 6.0%(+9.70)#89 | 4.5%(+11.3)#2,914 |
| 90. | Beechmont | 15.7% | 6.0%(+9.61)#90 | 4.5%(+11.2)#2,929 |
| 91. | Scottsville | 15.6% | 6.0%(+9.59)#91 | 4.5%(+11.2)#2,933 |
| 92. | Marion | 15.2% | 6.0%(+9.19)#92 | 4.5%(+10.8)#3,030 |
| 93. | Bradfordsville | 15.2% | 6.0%(+9.18)#93 | 4.5%(+10.8)#3,037 |
| 94. | Frenchburg | 15.0% | 6.0%(+8.96)#94 | 4.5%(+10.5)#3,082 |
| 95. | Somerset | 14.8% | 6.0%(+8.77)#95 | 4.5%(+10.3)#3,137 |
| 96. | Lewisburg | 14.7% | 6.0%(+8.66)#96 | 4.5%(+10.2)#3,164 |
| 97. | Slaughters | 14.7% | 6.0%(+8.66)#97 | 4.5%(+10.2)#3,170 |
| 98. | Evarts | 14.6% | 6.0%(+8.56)#98 | 4.5%(+10.1)#3,204 |
| 99. | Middlesborough | 14.5% | 6.0%(+8.47)#99 | 4.5%(+10.0)#3,230 |
| 100. | Vicco | 14.3% | 6.0%(+8.24)#100 | 4.5%(+9.82)#3,296 |
Common Questions
What are the Top 10 Cities with the Highest Poverty Level Among Married Couples in Kentucky?
Top 10 Cities with the Highest Poverty Level Among Married Couples in Kentucky are:
#1
78.5%
#2
68.9%
#3
67.8%
#4
64.3%
#5
57.8%
#6
50.0%
#7
45.3%
#8
45.1%
#9
41.6%
#10
40.3%
What city has the Highest Poverty Level Among Married Couples in Kentucky?
Flat Lick has the Highest Poverty Level Among Married Couples in Kentucky with 78.5%.
What is the Poverty Level Among Married Couples in the State of Kentucky?
Poverty Level Among Married Couples in Kentucky is 6.0%.
What is the Poverty Level Among Married Couples in the United States?
Poverty Level Among Married Couples in the United States is 4.5%.