Cities with the Highest Poverty Level Among Married Couples in New Mexico
RELATED REPORTS & OPTIONS
Highest Poverty | Married Couple
New Mexico
Compare Cities
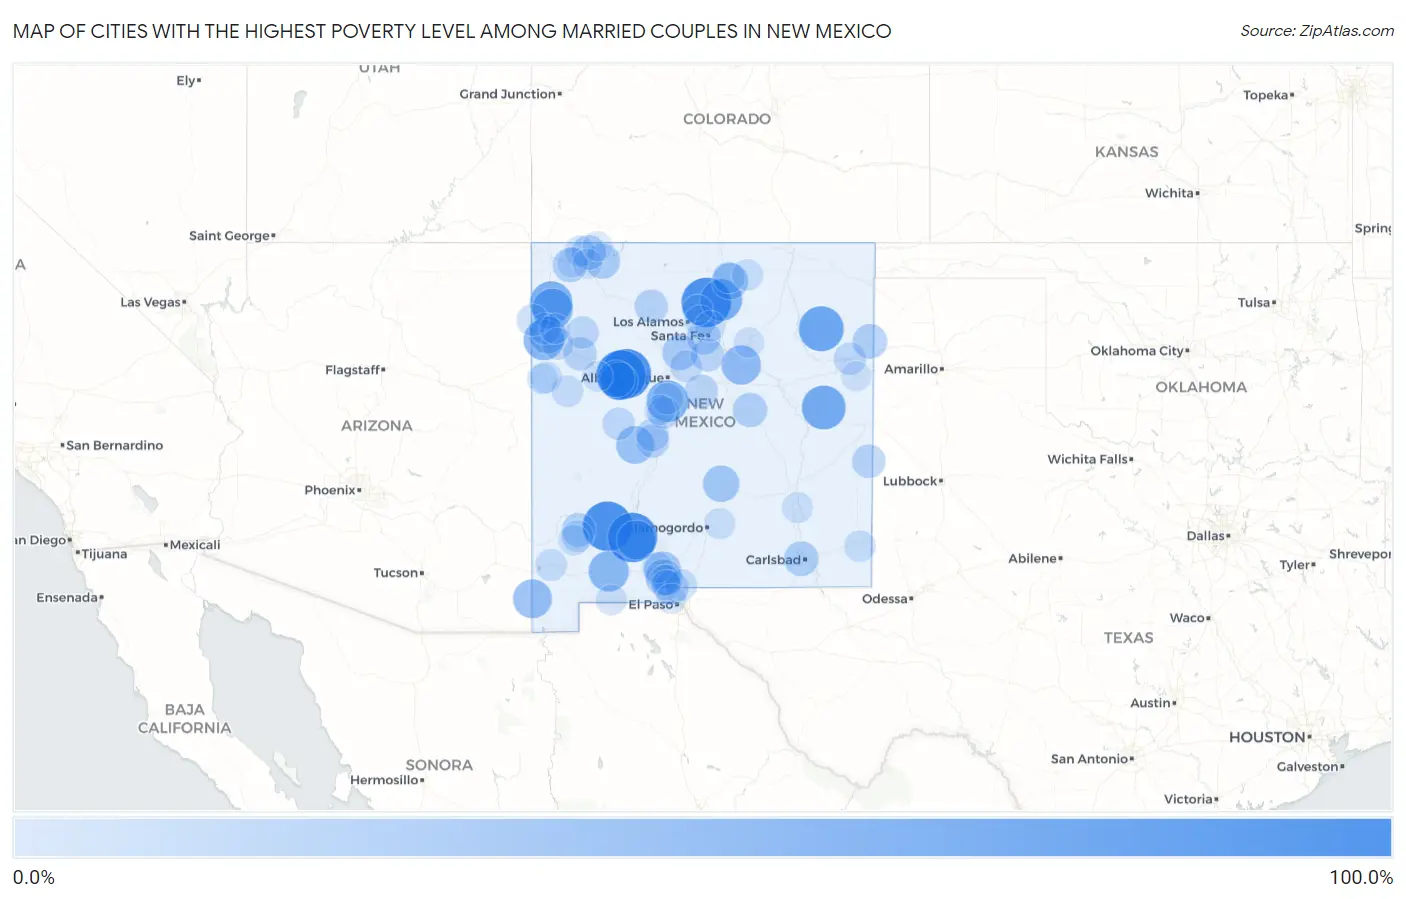
Map of Cities with the Highest Poverty Level Among Married Couples in New Mexico
0.0%
100.0%
Cities with the Highest Poverty Level Among Married Couples in New Mexico
| City | Married Couples Poverty | vs State | vs National | |
| 1. | Paguate | 100.0% | 7.7%(+92.3)#1 | 4.5%(+95.5)#10 |
| 2. | Lybrook | 100.0% | 7.7%(+92.3)#2 | 4.5%(+95.5)#16 |
| 3. | Velarde | 100.0% | 7.7%(+92.3)#3 | 4.5%(+95.5)#18 |
| 4. | Encinal | 100.0% | 7.7%(+92.3)#4 | 4.5%(+95.5)#24 |
| 5. | Kingston | 100.0% | 7.7%(+92.3)#5 | 4.5%(+95.5)#62 |
| 6. | Garfield | 100.0% | 7.7%(+92.3)#6 | 4.5%(+95.5)#65 |
| 7. | Encantado | 100.0% | 7.7%(+92.3)#7 | 4.5%(+95.5)#66 |
| 8. | Ojo Encino | 85.1% | 7.7%(+77.3)#8 | 4.5%(+80.6)#115 |
| 9. | Mosquero | 80.0% | 7.7%(+72.3)#9 | 4.5%(+75.5)#132 |
| 10. | House | 75.0% | 7.7%(+67.3)#10 | 4.5%(+70.5)#149 |
| 11. | Sheep Springs | 69.0% | 7.7%(+61.2)#11 | 4.5%(+64.5)#171 |
| 12. | Borrego Pass | 66.7% | 7.7%(+58.9)#12 | 4.5%(+62.2)#190 |
| 13. | Picuris Pueblo | 66.7% | 7.7%(+58.9)#13 | 4.5%(+62.2)#191 |
| 14. | Monterey Park | 66.3% | 7.7%(+58.6)#14 | 4.5%(+61.9)#201 |
| 15. | Naschitti | 61.7% | 7.7%(+54.0)#15 | 4.5%(+57.2)#242 |
| 16. | Haystack | 61.5% | 7.7%(+53.8)#16 | 4.5%(+57.1)#248 |
| 17. | Rock Springs | 60.3% | 7.7%(+52.6)#17 | 4.5%(+55.9)#260 |
| 18. | Ventura | 60.3% | 7.7%(+52.6)#18 | 4.5%(+55.9)#261 |
| 19. | Manuelito | 60.0% | 7.7%(+52.3)#19 | 4.5%(+55.5)#271 |
| 20. | Villanueva | 56.0% | 7.7%(+48.3)#20 | 4.5%(+51.5)#308 |
| 21. | Salem | 55.8% | 7.7%(+48.1)#21 | 4.5%(+51.4)#312 |
| 22. | Rodeo | 54.2% | 7.7%(+46.4)#22 | 4.5%(+49.7)#334 |
| 23. | Seama | 50.0% | 7.7%(+42.3)#23 | 4.5%(+45.5)#377 |
| 24. | Candy Kitchen | 50.0% | 7.7%(+42.3)#24 | 4.5%(+45.5)#390 |
| 25. | La Bajada | 50.0% | 7.7%(+42.3)#25 | 4.5%(+45.5)#403 |
| 26. | Magdalena | 49.5% | 7.7%(+41.8)#26 | 4.5%(+45.1)#405 |
| 27. | Twin Lakes | 47.5% | 7.7%(+39.8)#27 | 4.5%(+43.1)#432 |
| 28. | Pinedale | 47.1% | 7.7%(+39.3)#28 | 4.5%(+42.6)#442 |
| 29. | University Park | 46.2% | 7.7%(+38.4)#29 | 4.5%(+41.7)#460 |
| 30. | North Acomita Village | 46.2% | 7.7%(+38.4)#30 | 4.5%(+41.7)#464 |
| 31. | Sagar | 45.6% | 7.7%(+37.9)#31 | 4.5%(+41.2)#481 |
| 32. | Nogal | 44.4% | 7.7%(+36.7)#32 | 4.5%(+40.0)#502 |
| 33. | Taos Pueblo | 44.0% | 7.7%(+36.2)#33 | 4.5%(+39.5)#515 |
| 34. | San Miguel | 43.8% | 7.7%(+36.1)#34 | 4.5%(+39.3)#518 |
| 35. | Dona Ana | 42.9% | 7.7%(+35.2)#35 | 4.5%(+38.4)#534 |
| 36. | San Felipe Pueblo | 39.6% | 7.7%(+31.9)#36 | 4.5%(+35.1)#649 |
| 37. | Blanco | 38.3% | 7.7%(+30.5)#37 | 4.5%(+33.8)#694 |
| 38. | Happy Valley | 37.1% | 7.7%(+29.4)#38 | 4.5%(+32.7)#734 |
| 39. | Nara Visa | 36.7% | 7.7%(+28.9)#39 | 4.5%(+32.2)#749 |
| 40. | Ojo Amarillo | 36.1% | 7.7%(+28.4)#40 | 4.5%(+31.6)#767 |
| 41. | North Light Plant | 35.8% | 7.7%(+28.0)#41 | 4.5%(+31.3)#776 |
| 42. | Vaughn | 35.7% | 7.7%(+28.0)#42 | 4.5%(+31.3)#777 |
| 43. | Williams Acres | 35.1% | 7.7%(+27.3)#43 | 4.5%(+30.6)#801 |
| 44. | Agua Fria | 34.8% | 7.7%(+27.1)#44 | 4.5%(+30.3)#810 |
| 45. | Anthony | 34.4% | 7.7%(+26.7)#45 | 4.5%(+29.9)#830 |
| 46. | Las Tusas | 34.1% | 7.7%(+26.4)#46 | 4.5%(+29.7)#840 |
| 47. | Pinos Altos | 33.3% | 7.7%(+25.6)#47 | 4.5%(+28.9)#880 |
| 48. | Causey | 31.8% | 7.7%(+24.1)#48 | 4.5%(+27.4)#942 |
| 49. | La Jara | 31.7% | 7.7%(+24.0)#49 | 4.5%(+27.3)#947 |
| 50. | Thoreau | 31.7% | 7.7%(+23.9)#50 | 4.5%(+27.2)#949 |
| 51. | Mcintosh | 31.2% | 7.7%(+23.5)#51 | 4.5%(+26.7)#974 |
| 52. | Galisteo | 30.6% | 7.7%(+22.8)#52 | 4.5%(+26.1)#1,009 |
| 53. | Lemitar | 30.2% | 7.7%(+22.4)#53 | 4.5%(+25.7)#1,021 |
| 54. | Alamillo | 29.2% | 7.7%(+21.4)#54 | 4.5%(+24.7)#1,075 |
| 55. | Logan | 27.6% | 7.7%(+19.9)#55 | 4.5%(+23.2)#1,200 |
| 56. | Crownpoint | 27.6% | 7.7%(+19.9)#56 | 4.5%(+23.1)#1,204 |
| 57. | Alamo | 27.3% | 7.7%(+19.5)#57 | 4.5%(+22.8)#1,220 |
| 58. | Madrone | 27.3% | 7.7%(+19.5)#58 | 4.5%(+22.8)#1,226 |
| 59. | Gamerco | 26.6% | 7.7%(+18.9)#59 | 4.5%(+22.2)#1,276 |
| 60. | La Madera | 25.3% | 7.7%(+17.6)#60 | 4.5%(+20.9)#1,385 |
| 61. | Nakaibito | 25.0% | 7.7%(+17.3)#61 | 4.5%(+20.5)#1,425 |
| 62. | Crestview | 25.0% | 7.7%(+17.3)#62 | 4.5%(+20.5)#1,426 |
| 63. | Navajo | 24.8% | 7.7%(+17.1)#63 | 4.5%(+20.4)#1,467 |
| 64. | Church Rock | 24.7% | 7.7%(+17.0)#64 | 4.5%(+20.3)#1,474 |
| 65. | Mount Taylor | 24.5% | 7.7%(+16.8)#65 | 4.5%(+20.1)#1,491 |
| 66. | Rosedale | 24.5% | 7.7%(+16.7)#66 | 4.5%(+20.0)#1,493 |
| 67. | Pinehill | 24.4% | 7.7%(+16.6)#67 | 4.5%(+19.9)#1,503 |
| 68. | Lordsburg | 24.3% | 7.7%(+16.6)#68 | 4.5%(+19.9)#1,515 |
| 69. | Chaparral | 24.3% | 7.7%(+16.5)#69 | 4.5%(+19.8)#1,522 |
| 70. | Black Rock | 24.0% | 7.7%(+16.3)#70 | 4.5%(+19.6)#1,545 |
| 71. | El Rancho | 24.0% | 7.7%(+16.2)#71 | 4.5%(+19.5)#1,555 |
| 72. | El Cerro Mission | 23.7% | 7.7%(+16.0)#72 | 4.5%(+19.3)#1,580 |
| 73. | Arroyo Seco | 23.7% | 7.7%(+16.0)#73 | 4.5%(+19.2)#1,581 |
| 74. | Monument | 23.6% | 7.7%(+15.9)#74 | 4.5%(+19.2)#1,589 |
| 75. | Torreon Cdp Sandoval County | 23.3% | 7.7%(+15.5)#75 | 4.5%(+18.8)#1,635 |
| 76. | Vado | 23.1% | 7.7%(+15.4)#76 | 4.5%(+18.6)#1,647 |
| 77. | Valle Vista | 22.7% | 7.7%(+15.0)#77 | 4.5%(+18.3)#1,696 |
| 78. | Eagle Nest | 22.2% | 7.7%(+14.5)#78 | 4.5%(+17.8)#1,751 |
| 79. | La Plata | 21.9% | 7.7%(+14.1)#79 | 4.5%(+17.4)#1,818 |
| 80. | Cloudcroft | 21.7% | 7.7%(+14.0)#80 | 4.5%(+17.2)#1,833 |
| 81. | Dexter | 21.6% | 7.7%(+13.9)#81 | 4.5%(+17.2)#1,841 |
| 82. | Columbus | 21.1% | 7.7%(+13.3)#82 | 4.5%(+16.6)#1,898 |
| 83. | Tyrone | 21.0% | 7.7%(+13.2)#83 | 4.5%(+16.5)#1,909 |
| 84. | Sundance | 20.9% | 7.7%(+13.2)#84 | 4.5%(+16.5)#1,911 |
| 85. | Iyanbito | 20.7% | 7.7%(+13.0)#85 | 4.5%(+16.3)#1,940 |
| 86. | Fairacres | 20.6% | 7.7%(+12.9)#86 | 4.5%(+16.2)#1,960 |
| 87. | Zuni Pueblo | 20.6% | 7.7%(+12.9)#87 | 4.5%(+16.1)#1,963 |
| 88. | Upper Fruitland | 20.0% | 7.7%(+12.3)#88 | 4.5%(+15.5)#2,029 |
| 89. | Pueblitos | 20.0% | 7.7%(+12.3)#89 | 4.5%(+15.5)#2,040 |
| 90. | Chupadero | 20.0% | 7.7%(+12.3)#90 | 4.5%(+15.5)#2,048 |
| 91. | Las Vegas | 20.0% | 7.7%(+12.2)#91 | 4.5%(+15.5)#2,088 |
| 92. | La Mesa | 19.8% | 7.7%(+12.1)#92 | 4.5%(+15.4)#2,098 |
| 93. | San Rafael | 19.7% | 7.7%(+12.0)#93 | 4.5%(+15.3)#2,108 |
| 94. | Hernandez | 19.4% | 7.7%(+11.7)#94 | 4.5%(+15.0)#2,142 |
| 95. | Brimhall Nizhoni | 19.1% | 7.7%(+11.4)#95 | 4.5%(+14.7)#2,187 |
| 96. | Chamberino | 18.9% | 7.7%(+11.1)#96 | 4.5%(+14.4)#2,238 |
| 97. | Sunland Park | 18.7% | 7.7%(+11.0)#97 | 4.5%(+14.3)#2,270 |
| 98. | San Jon | 18.5% | 7.7%(+10.8)#98 | 4.5%(+14.1)#2,303 |
| 99. | Lee Acres | 18.4% | 7.7%(+10.6)#99 | 4.5%(+13.9)#2,330 |
| 100. | Cedar Hill | 18.3% | 7.7%(+10.6)#100 | 4.5%(+13.8)#2,339 |
Common Questions
What are the Top 10 Cities with the Highest Poverty Level Among Married Couples in New Mexico?
Top 10 Cities with the Highest Poverty Level Among Married Couples in New Mexico are:
#1
100.0%
#2
100.0%
#3
100.0%
#4
100.0%
#5
100.0%
#6
80.0%
#7
75.0%
#8
69.0%
#9
66.7%
#10
66.3%
What city has the Highest Poverty Level Among Married Couples in New Mexico?
Paguate has the Highest Poverty Level Among Married Couples in New Mexico with 100.0%.
What is the Poverty Level Among Married Couples in the State of New Mexico?
Poverty Level Among Married Couples in New Mexico is 7.7%.
What is the Poverty Level Among Married Couples in the United States?
Poverty Level Among Married Couples in the United States is 4.5%.