Cities with the Highest Poverty Level Among Married Couples in Tennessee
RELATED REPORTS & OPTIONS
Highest Poverty | Married Couple
Tennessee
Compare Cities
Map of Cities with the Highest Poverty Level Among Married Couples in Tennessee
0.0%
100.0%
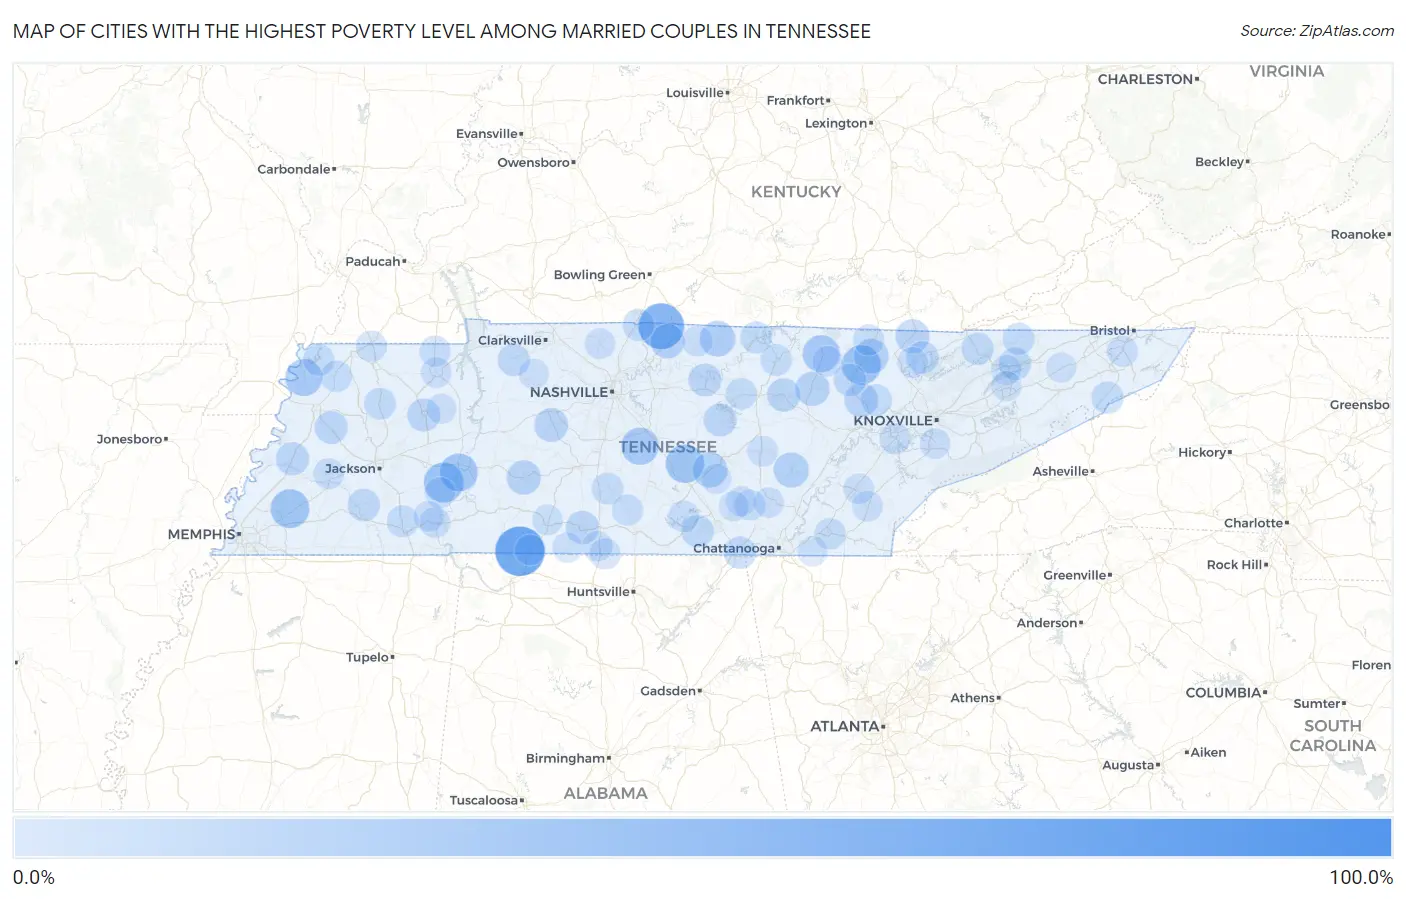
Cities with the Highest Poverty Level Among Married Couples in Tennessee
| City | Married Couples Poverty | vs State | vs National | |
| 1. | Morris Chapel | 100.0% | 4.9%(+95.1)#1 | 4.5%(+95.5)#26 |
| 2. | Sequatchie | 81.2% | 4.9%(+76.3)#2 | 4.5%(+76.7)#126 |
| 3. | Iron City | 78.3% | 4.9%(+73.4)#3 | 4.5%(+73.8)#138 |
| 4. | Fairfield | 64.9% | 4.9%(+60.0)#4 | 4.5%(+60.4)#208 |
| 5. | Greenvale | 57.4% | 4.9%(+52.5)#5 | 4.5%(+52.9)#299 |
| 6. | Essary Springs | 53.8% | 4.9%(+49.0)#6 | 4.5%(+49.4)#338 |
| 7. | Nixon | 53.2% | 4.9%(+48.3)#7 | 4.5%(+48.7)#349 |
| 8. | Farner | 46.2% | 4.9%(+41.3)#8 | 4.5%(+41.7)#467 |
| 9. | Scotts Hill | 44.0% | 4.9%(+39.1)#9 | 4.5%(+39.5)#514 |
| 10. | Robbins | 41.9% | 4.9%(+37.1)#10 | 4.5%(+37.5)#572 |
| 11. | Gallaway | 39.5% | 4.9%(+34.7)#11 | 4.5%(+35.1)#653 |
| 12. | Lakewood Park | 39.1% | 4.9%(+34.3)#12 | 4.5%(+34.7)#666 |
| 13. | Decaturville | 37.1% | 4.9%(+32.2)#13 | 4.5%(+32.6)#735 |
| 14. | Rockvale | 34.9% | 4.9%(+30.0)#14 | 4.5%(+30.4)#808 |
| 15. | Jamestown | 34.6% | 4.9%(+29.7)#15 | 4.5%(+30.1)#820 |
| 16. | Ridgely | 33.8% | 4.9%(+28.9)#16 | 4.5%(+29.3)#852 |
| 17. | Red Boiling Springs | 29.2% | 4.9%(+24.4)#17 | 4.5%(+24.8)#1,070 |
| 18. | Briceville | 28.3% | 4.9%(+23.4)#18 | 4.5%(+23.8)#1,135 |
| 19. | Pikeville | 27.3% | 4.9%(+22.5)#19 | 4.5%(+22.9)#1,219 |
| 20. | Morrison | 27.2% | 4.9%(+22.3)#20 | 4.5%(+22.7)#1,234 |
| 21. | Huntsville | 26.4% | 4.9%(+21.6)#21 | 4.5%(+22.0)#1,290 |
| 22. | Walnut Grove Cdp Hardin County | 25.9% | 4.9%(+21.0)#22 | 4.5%(+21.4)#1,343 |
| 23. | Hickman | 25.3% | 4.9%(+20.4)#23 | 4.5%(+20.9)#1,386 |
| 24. | Bransford | 25.0% | 4.9%(+20.1)#24 | 4.5%(+20.5)#1,434 |
| 25. | Clarkrange | 24.7% | 4.9%(+19.8)#25 | 4.5%(+20.2)#1,475 |
| 26. | Griffith Creek | 24.4% | 4.9%(+19.6)#26 | 4.5%(+20.0)#1,497 |
| 27. | Hohenwald | 24.3% | 4.9%(+19.4)#27 | 4.5%(+19.8)#1,517 |
| 28. | Jellico | 23.3% | 4.9%(+18.4)#28 | 4.5%(+18.8)#1,633 |
| 29. | Wartburg | 22.6% | 4.9%(+17.7)#29 | 4.5%(+18.1)#1,714 |
| 30. | Bon Aqua Junction | 22.4% | 4.9%(+17.5)#30 | 4.5%(+17.9)#1,735 |
| 31. | Monterey | 21.2% | 4.9%(+16.3)#31 | 4.5%(+16.7)#1,893 |
| 32. | Pulaski | 21.0% | 4.9%(+16.1)#32 | 4.5%(+16.5)#1,906 |
| 33. | Henning | 20.7% | 4.9%(+15.9)#33 | 4.5%(+16.3)#1,939 |
| 34. | Huntingdon | 20.2% | 4.9%(+15.4)#34 | 4.5%(+15.8)#2,012 |
| 35. | South Carthage | 20.0% | 4.9%(+15.1)#35 | 4.5%(+15.5)#2,028 |
| 36. | Friendship | 20.0% | 4.9%(+15.1)#36 | 4.5%(+15.5)#2,032 |
| 37. | Smithville | 19.8% | 4.9%(+15.0)#37 | 4.5%(+15.4)#2,099 |
| 38. | Fincastle | 18.6% | 4.9%(+13.8)#38 | 4.5%(+14.2)#2,278 |
| 39. | Toone | 18.6% | 4.9%(+13.8)#39 | 4.5%(+14.2)#2,279 |
| 40. | Sunbright | 18.5% | 4.9%(+13.6)#40 | 4.5%(+14.0)#2,308 |
| 41. | Rocky Top | 18.2% | 4.9%(+13.3)#41 | 4.5%(+13.7)#2,353 |
| 42. | Cowan | 18.1% | 4.9%(+13.2)#42 | 4.5%(+13.6)#2,387 |
| 43. | Mooresburg | 18.1% | 4.9%(+13.2)#43 | 4.5%(+13.6)#2,392 |
| 44. | New Hope | 17.8% | 4.9%(+12.9)#44 | 4.5%(+13.3)#2,458 |
| 45. | Tazewell | 17.7% | 4.9%(+12.9)#45 | 4.5%(+13.3)#2,468 |
| 46. | Cumberland City | 17.6% | 4.9%(+12.8)#46 | 4.5%(+13.2)#2,476 |
| 47. | Bogota | 17.4% | 4.9%(+12.5)#47 | 4.5%(+12.9)#2,539 |
| 48. | Banner Hill | 17.1% | 4.9%(+12.3)#48 | 4.5%(+12.7)#2,594 |
| 49. | Celina | 17.1% | 4.9%(+12.2)#49 | 4.5%(+12.6)#2,604 |
| 50. | Bradford | 16.7% | 4.9%(+11.8)#50 | 4.5%(+12.2)#2,666 |
| 51. | Mitchellville | 16.7% | 4.9%(+11.8)#51 | 4.5%(+12.2)#2,694 |
| 52. | Sneedville | 16.3% | 4.9%(+11.5)#52 | 4.5%(+11.9)#2,762 |
| 53. | Bethel Springs | 16.2% | 4.9%(+11.3)#53 | 4.5%(+11.7)#2,803 |
| 54. | Samburg | 15.5% | 4.9%(+10.7)#54 | 4.5%(+11.1)#2,969 |
| 55. | Lewisburg | 15.5% | 4.9%(+10.6)#55 | 4.5%(+11.0)#2,978 |
| 56. | Livingston | 15.4% | 4.9%(+10.5)#56 | 4.5%(+10.9)#3,009 |
| 57. | Obion | 15.2% | 4.9%(+10.3)#57 | 4.5%(+10.7)#3,047 |
| 58. | Petros | 14.7% | 4.9%(+9.79)#58 | 4.5%(+10.2)#3,187 |
| 59. | Baxter | 14.6% | 4.9%(+9.72)#59 | 4.5%(+10.1)#3,205 |
| 60. | East Cleveland | 14.5% | 4.9%(+9.68)#60 | 4.5%(+10.1)#3,217 |
| 61. | Lenoir City | 14.3% | 4.9%(+9.42)#61 | 4.5%(+9.82)#3,275 |
| 62. | Chewalla | 14.3% | 4.9%(+9.42)#62 | 4.5%(+9.82)#3,316 |
| 63. | Estill Springs | 13.9% | 4.9%(+9.03)#63 | 4.5%(+9.43)#3,424 |
| 64. | Puryear | 13.9% | 4.9%(+9.02)#64 | 4.5%(+9.43)#3,425 |
| 65. | Bon Air | 13.8% | 4.9%(+8.93)#65 | 4.5%(+9.33)#3,455 |
| 66. | Petersburg | 13.7% | 4.9%(+8.86)#66 | 4.5%(+9.26)#3,479 |
| 67. | Oneida | 13.6% | 4.9%(+8.70)#67 | 4.5%(+9.10)#3,529 |
| 68. | South Fulton | 13.5% | 4.9%(+8.63)#68 | 4.5%(+9.03)#3,562 |
| 69. | Hilham | 13.5% | 4.9%(+8.62)#69 | 4.5%(+9.02)#3,572 |
| 70. | Ardmore | 13.4% | 4.9%(+8.50)#70 | 4.5%(+8.90)#3,604 |
| 71. | Palmer | 13.1% | 4.9%(+8.25)#71 | 4.5%(+8.65)#3,697 |
| 72. | Brownsville | 13.0% | 4.9%(+8.14)#72 | 4.5%(+8.54)#3,752 |
| 73. | Crump | 13.0% | 4.9%(+8.11)#73 | 4.5%(+8.51)#3,763 |
| 74. | Paris | 12.8% | 4.9%(+7.95)#74 | 4.5%(+8.36)#3,829 |
| 75. | Sardis | 12.6% | 4.9%(+7.78)#75 | 4.5%(+8.18)#3,877 |
| 76. | Etowah | 12.6% | 4.9%(+7.72)#76 | 4.5%(+8.12)#3,895 |
| 77. | Bluff City | 12.5% | 4.9%(+7.63)#77 | 4.5%(+8.04)#3,918 |
| 78. | St Joseph | 12.5% | 4.9%(+7.63)#78 | 4.5%(+8.04)#3,923 |
| 79. | Lawrenceburg | 12.3% | 4.9%(+7.46)#79 | 4.5%(+7.86)#4,026 |
| 80. | Adamsville | 12.2% | 4.9%(+7.33)#80 | 4.5%(+7.73)#4,070 |
| 81. | La Follette | 12.2% | 4.9%(+7.33)#81 | 4.5%(+7.73)#4,077 |
| 82. | Athens | 12.1% | 4.9%(+7.27)#82 | 4.5%(+7.67)#4,105 |
| 83. | Elkton | 12.1% | 4.9%(+7.25)#83 | 4.5%(+7.66)#4,115 |
| 84. | Springfield | 12.1% | 4.9%(+7.19)#84 | 4.5%(+7.59)#4,150 |
| 85. | Spencer | 12.0% | 4.9%(+7.13)#85 | 4.5%(+7.54)#4,166 |
| 86. | Dunlap | 11.8% | 4.9%(+6.98)#86 | 4.5%(+7.39)#4,244 |
| 87. | Lafayette | 11.8% | 4.9%(+6.92)#87 | 4.5%(+7.33)#4,263 |
| 88. | Allardt | 11.6% | 4.9%(+6.74)#88 | 4.5%(+7.15)#4,359 |
| 89. | Eagleton Village | 11.5% | 4.9%(+6.63)#89 | 4.5%(+7.04)#4,404 |
| 90. | Bean Station | 11.4% | 4.9%(+6.54)#90 | 4.5%(+6.95)#4,443 |
| 91. | Minor Hill | 11.4% | 4.9%(+6.53)#91 | 4.5%(+6.93)#4,449 |
| 92. | Morristown | 11.4% | 4.9%(+6.51)#92 | 4.5%(+6.91)#4,454 |
| 93. | Gruetli Laager | 11.3% | 4.9%(+6.45)#93 | 4.5%(+6.86)#4,476 |
| 94. | Baileyton | 11.1% | 4.9%(+6.24)#94 | 4.5%(+6.65)#4,569 |
| 95. | Viola | 11.1% | 4.9%(+6.24)#95 | 4.5%(+6.65)#4,606 |
| 96. | Kahite | 11.0% | 4.9%(+6.11)#96 | 4.5%(+6.52)#4,662 |
| 97. | Hollow Rock | 10.8% | 4.9%(+5.97)#97 | 4.5%(+6.37)#4,744 |
| 98. | Slayden | 10.8% | 4.9%(+5.94)#98 | 4.5%(+6.35)#4,760 |
| 99. | Coalmont | 10.8% | 4.9%(+5.93)#99 | 4.5%(+6.33)#4,763 |
| 100. | Apison | 10.7% | 4.9%(+5.84)#100 | 4.5%(+6.25)#4,818 |
Common Questions
What are the Top 10 Cities with the Highest Poverty Level Among Married Couples in Tennessee?
Top 10 Cities with the Highest Poverty Level Among Married Couples in Tennessee are:
#1
78.3%
#2
64.9%
#3
44.0%
#4
41.9%
#5
39.5%
#6
39.1%
#7
37.1%
#8
34.9%
#9
34.6%
#10
33.8%
What city has the Highest Poverty Level Among Married Couples in Tennessee?
Iron City has the Highest Poverty Level Among Married Couples in Tennessee with 78.3%.
What is the Poverty Level Among Married Couples in the State of Tennessee?
Poverty Level Among Married Couples in Tennessee is 4.9%.
What is the Poverty Level Among Married Couples in the United States?
Poverty Level Among Married Couples in the United States is 4.5%.