Cities with the Highest Poverty Level Among Married Couples in Maryland
RELATED REPORTS & OPTIONS
Highest Poverty | Married Couple
Maryland
Compare Cities
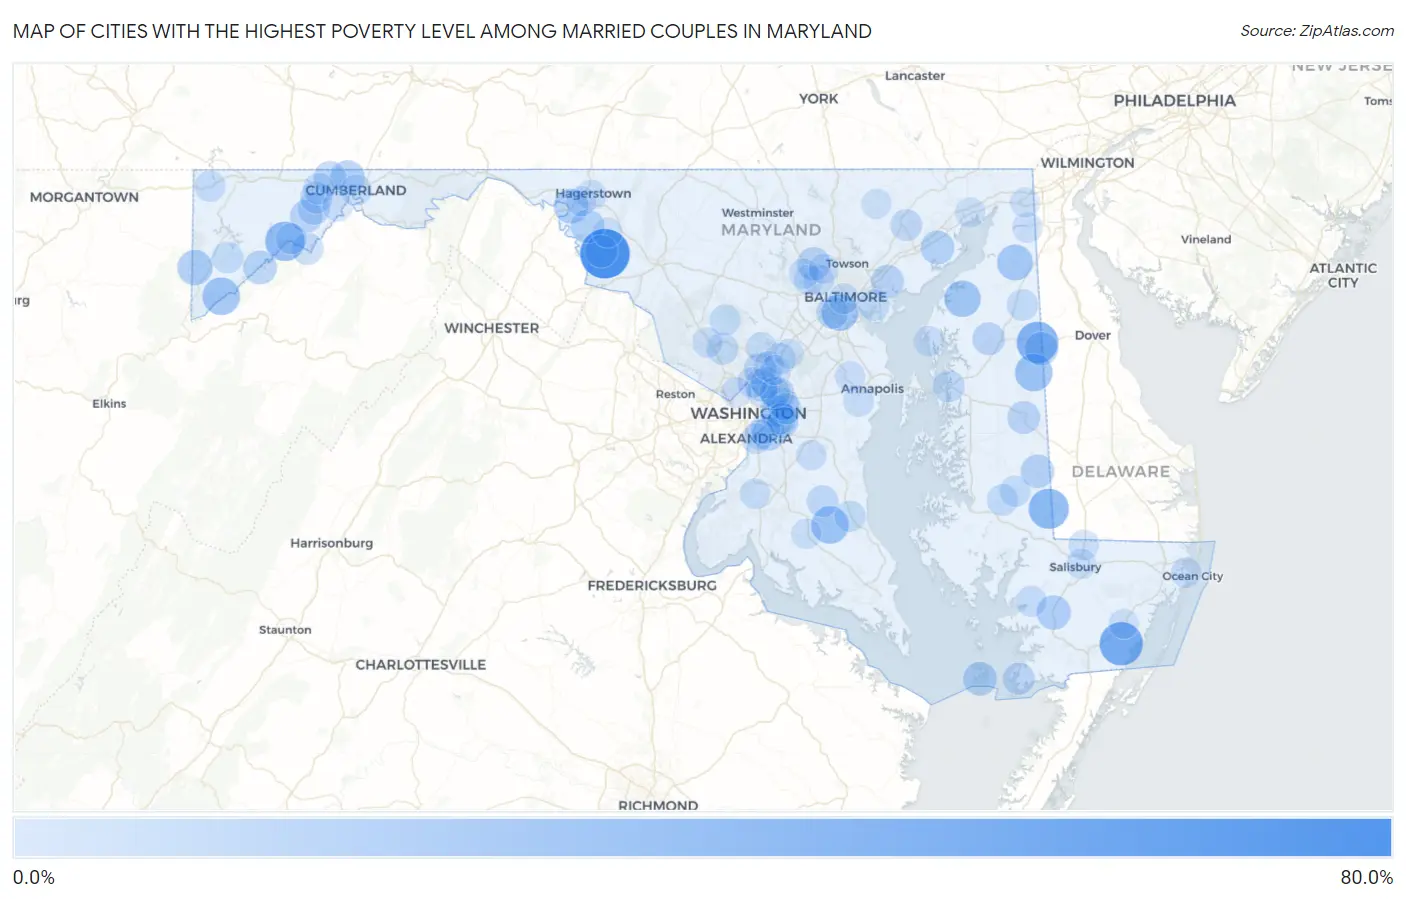
Map of Cities with the Highest Poverty Level Among Married Couples in Maryland
0.0%
80.0%
Cities with the Highest Poverty Level Among Married Couples in Maryland
| City | Married Couples Poverty | vs State | vs National | |
| 1. | Rohrersville | 61.8% | 3.0%(+58.7)#1 | 4.5%(+57.3)#241 |
| 2. | Girdletree | 42.9% | 3.0%(+39.8)#2 | 4.5%(+38.4)#542 |
| 3. | Templeville | 37.5% | 3.0%(+34.5)#3 | 4.5%(+33.0)#720 |
| 4. | Galestown | 33.3% | 3.0%(+30.3)#4 | 4.5%(+28.9)#888 |
| 5. | Bloomington | 31.2% | 3.0%(+28.2)#5 | 4.5%(+26.8)#968 |
| 6. | Gorman | 25.7% | 3.0%(+22.6)#6 | 4.5%(+21.2)#1,361 |
| 7. | Goldsboro | 25.6% | 3.0%(+22.6)#7 | 4.5%(+21.2)#1,368 |
| 8. | Benedict | 25.6% | 3.0%(+22.6)#8 | 4.5%(+21.2)#1,371 |
| 9. | Baltimore Highlands | 23.1% | 3.0%(+20.1)#9 | 4.5%(+18.6)#1,646 |
| 10. | Butlertown | 22.3% | 3.0%(+19.3)#10 | 4.5%(+17.9)#1,739 |
| 11. | Cecilton | 20.7% | 3.0%(+17.6)#11 | 4.5%(+16.2)#1,951 |
| 12. | Crellin | 18.8% | 3.0%(+15.7)#12 | 4.5%(+14.3)#2,260 |
| 13. | Williamsport | 17.6% | 3.0%(+14.6)#13 | 4.5%(+13.2)#2,486 |
| 14. | Corriganville | 16.4% | 3.0%(+13.4)#14 | 4.5%(+11.9)#2,748 |
| 15. | Princess Anne | 16.2% | 3.0%(+13.2)#15 | 4.5%(+11.8)#2,784 |
| 16. | Smith Island | 15.4% | 3.0%(+12.4)#16 | 4.5%(+10.9)#3,001 |
| 17. | Capitol Heights | 14.8% | 3.0%(+11.7)#17 | 4.5%(+10.3)#3,144 |
| 18. | Perryman | 14.8% | 3.0%(+11.7)#18 | 4.5%(+10.3)#3,145 |
| 19. | Tilghmanton | 14.7% | 3.0%(+11.7)#19 | 4.5%(+10.3)#3,156 |
| 20. | Kitzmiller | 14.6% | 3.0%(+11.6)#20 | 4.5%(+10.1)#3,210 |
| 21. | East Riverdale | 14.5% | 3.0%(+11.4)#21 | 4.5%(+10.0)#3,243 |
| 22. | Marydel | 14.3% | 3.0%(+11.3)#22 | 4.5%(+9.82)#3,313 |
| 23. | Marlow Heights | 14.2% | 3.0%(+11.2)#23 | 4.5%(+9.79)#3,340 |
| 24. | Federalsburg | 13.9% | 3.0%(+10.9)#24 | 4.5%(+9.47)#3,416 |
| 25. | Garrison | 13.7% | 3.0%(+10.6)#25 | 4.5%(+9.19)#3,494 |
| 26. | Middle River | 12.8% | 3.0%(+9.80)#26 | 4.5%(+8.37)#3,817 |
| 27. | Langley Park | 12.6% | 3.0%(+9.58)#27 | 4.5%(+8.15)#3,885 |
| 28. | Denton | 12.1% | 3.0%(+9.11)#28 | 4.5%(+7.67)#4,103 |
| 29. | Church Hill | 12.0% | 3.0%(+9.01)#29 | 4.5%(+7.58)#4,156 |
| 30. | Lonaconing | 12.0% | 3.0%(+8.95)#30 | 4.5%(+7.51)#4,191 |
| 31. | Mount Savage | 12.0% | 3.0%(+8.95)#31 | 4.5%(+7.51)#4,192 |
| 32. | Mount Briar | 11.5% | 3.0%(+8.51)#32 | 4.5%(+7.08)#4,392 |
| 33. | Fairmount Heights | 11.5% | 3.0%(+8.48)#33 | 4.5%(+7.04)#4,402 |
| 34. | Lansdowne | 10.9% | 3.0%(+7.90)#34 | 4.5%(+6.47)#4,694 |
| 35. | Midland | 10.8% | 3.0%(+7.74)#35 | 4.5%(+6.31)#4,771 |
| 36. | Shaft | 10.2% | 3.0%(+7.20)#36 | 4.5%(+5.77)#5,113 |
| 37. | White Oak | 10.1% | 3.0%(+7.11)#37 | 4.5%(+5.68)#5,164 |
| 38. | Landover | 10.1% | 3.0%(+7.06)#38 | 4.5%(+5.62)#5,185 |
| 39. | Crisfield | 10.1% | 3.0%(+7.04)#39 | 4.5%(+5.61)#5,197 |
| 40. | Mccoole | 9.7% | 3.0%(+6.69)#40 | 4.5%(+5.26)#5,444 |
| 41. | Queenstown | 9.5% | 3.0%(+6.46)#41 | 4.5%(+5.03)#5,589 |
| 42. | Derwood | 9.5% | 3.0%(+6.46)#42 | 4.5%(+5.03)#5,590 |
| 43. | Aquasco | 9.4% | 3.0%(+6.42)#43 | 4.5%(+4.98)#5,622 |
| 44. | Bel Air | 9.0% | 3.0%(+5.93)#44 | 4.5%(+4.49)#6,003 |
| 45. | Frostburg | 8.7% | 3.0%(+5.67)#45 | 4.5%(+4.23)#6,181 |
| 46. | Deer Park | 8.6% | 3.0%(+5.61)#46 | 4.5%(+4.18)#6,239 |
| 47. | Dundalk | 8.5% | 3.0%(+5.49)#47 | 4.5%(+4.06)#6,303 |
| 48. | Adelphi | 8.5% | 3.0%(+5.46)#48 | 4.5%(+4.02)#6,335 |
| 49. | Konterra | 8.4% | 3.0%(+5.41)#49 | 4.5%(+3.98)#6,370 |
| 50. | Walker Mill | 8.3% | 3.0%(+5.29)#50 | 4.5%(+3.86)#6,495 |
| 51. | Flower Hill | 8.1% | 3.0%(+5.09)#51 | 4.5%(+3.66)#6,647 |
| 52. | Millington | 8.1% | 3.0%(+5.08)#52 | 4.5%(+3.65)#6,661 |
| 53. | East New Market | 7.9% | 3.0%(+4.91)#53 | 4.5%(+3.47)#6,799 |
| 54. | Woodlawn Cdp Baltimore County | 7.8% | 3.0%(+4.75)#54 | 4.5%(+3.32)#6,948 |
| 55. | District Heights | 7.7% | 3.0%(+4.65)#55 | 4.5%(+3.22)#7,075 |
| 56. | Cumberland | 7.6% | 3.0%(+4.59)#56 | 4.5%(+3.16)#7,111 |
| 57. | Prince Frederick | 7.6% | 3.0%(+4.54)#57 | 4.5%(+3.11)#7,154 |
| 58. | Mount Vernon | 7.5% | 3.0%(+4.48)#58 | 4.5%(+3.05)#7,207 |
| 59. | Hurlock | 7.4% | 3.0%(+4.36)#59 | 4.5%(+2.92)#7,345 |
| 60. | Laytonsville | 7.2% | 3.0%(+4.15)#60 | 4.5%(+2.72)#7,535 |
| 61. | Summerfield | 7.2% | 3.0%(+4.15)#61 | 4.5%(+2.72)#7,537 |
| 62. | Chillum | 7.2% | 3.0%(+4.12)#62 | 4.5%(+2.69)#7,558 |
| 63. | Friendsville | 7.0% | 3.0%(+4.01)#63 | 4.5%(+2.58)#7,723 |
| 64. | Westernport | 6.9% | 3.0%(+3.91)#64 | 4.5%(+2.48)#7,835 |
| 65. | Spencerville | 6.8% | 3.0%(+3.82)#65 | 4.5%(+2.39)#7,933 |
| 66. | Riverdale Park | 6.6% | 3.0%(+3.59)#66 | 4.5%(+2.16)#8,181 |
| 67. | Woodlawn Cdp Prince George S County | 6.4% | 3.0%(+3.36)#67 | 4.5%(+1.93)#8,466 |
| 68. | Edgewater | 6.4% | 3.0%(+3.32)#68 | 4.5%(+1.89)#8,522 |
| 69. | Lochearn | 6.3% | 3.0%(+3.31)#69 | 4.5%(+1.88)#8,539 |
| 70. | Glassmanor | 6.2% | 3.0%(+3.20)#70 | 4.5%(+1.77)#8,684 |
| 71. | Silver Spring | 6.2% | 3.0%(+3.12)#71 | 4.5%(+1.69)#8,778 |
| 72. | Baltimore | 6.1% | 3.0%(+3.10)#72 | 4.5%(+1.67)#8,808 |
| 73. | Bensville | 6.1% | 3.0%(+3.08)#73 | 4.5%(+1.65)#8,830 |
| 74. | Rock Hall | 6.0% | 3.0%(+2.93)#74 | 4.5%(+1.50)#9,008 |
| 75. | Gaithersburg | 5.9% | 3.0%(+2.91)#75 | 4.5%(+1.48)#9,029 |
| 76. | Croom | 5.9% | 3.0%(+2.89)#76 | 4.5%(+1.46)#9,054 |
| 77. | Forest Heights | 5.9% | 3.0%(+2.85)#77 | 4.5%(+1.42)#9,097 |
| 78. | Delmar | 5.8% | 3.0%(+2.78)#78 | 4.5%(+1.35)#9,225 |
| 79. | West Ocean City | 5.8% | 3.0%(+2.78)#79 | 4.5%(+1.35)#9,227 |
| 80. | Calverton | 5.8% | 3.0%(+2.78)#80 | 4.5%(+1.34)#9,230 |
| 81. | Milford Mill | 5.7% | 3.0%(+2.69)#81 | 4.5%(+1.25)#9,346 |
| 82. | Friendship Heights Village | 5.5% | 3.0%(+2.50)#82 | 4.5%(+1.07)#9,621 |
| 83. | Hagerstown | 5.5% | 3.0%(+2.46)#83 | 4.5%(+1.03)#9,677 |
| 84. | Chesapeake City | 5.4% | 3.0%(+2.36)#84 | 4.5%(+0.927)#9,842 |
| 85. | Crownsville | 5.3% | 3.0%(+2.27)#85 | 4.5%(+0.841)#9,981 |
| 86. | Cedar Heights | 5.3% | 3.0%(+2.25)#86 | 4.5%(+0.819)#10,013 |
| 87. | Salisbury | 5.2% | 3.0%(+2.21)#87 | 4.5%(+0.775)#10,097 |
| 88. | Randallstown | 5.2% | 3.0%(+2.20)#88 | 4.5%(+0.765)#10,110 |
| 89. | Cresaptown | 5.1% | 3.0%(+2.10)#89 | 4.5%(+0.666)#10,240 |
| 90. | Charlotte Hall | 5.1% | 3.0%(+2.07)#90 | 4.5%(+0.634)#10,292 |
| 91. | Jarrettsville | 5.0% | 3.0%(+2.00)#91 | 4.5%(+0.567)#10,384 |
| 92. | Beltsville | 5.0% | 3.0%(+1.96)#92 | 4.5%(+0.531)#10,468 |
| 93. | Perryville | 4.9% | 3.0%(+1.90)#93 | 4.5%(+0.465)#10,561 |
| 94. | Elkton | 4.9% | 3.0%(+1.87)#94 | 4.5%(+0.439)#10,602 |
| 95. | Pikesville | 4.9% | 3.0%(+1.85)#95 | 4.5%(+0.415)#10,639 |
| 96. | Halfway | 4.8% | 3.0%(+1.73)#96 | 4.5%(+0.292)#10,859 |
| 97. | Boonsboro | 4.7% | 3.0%(+1.70)#97 | 4.5%(+0.262)#10,882 |
| 98. | Hillcrest Heights | 4.6% | 3.0%(+1.58)#98 | 4.5%(+0.144)#11,090 |
| 99. | Laurel | 4.6% | 3.0%(+1.53)#99 | 4.5%(+0.102)#11,166 |
| 100. | Snow Hill | 4.6% | 3.0%(+1.53)#100 | 4.5%(+0.101)#11,169 |
Common Questions
What are the Top 10 Cities with the Highest Poverty Level Among Married Couples in Maryland?
Top 10 Cities with the Highest Poverty Level Among Married Couples in Maryland are:
#1
61.8%
#2
42.9%
#3
37.5%
#4
33.3%
#5
31.2%
#6
25.7%
#7
25.6%
#8
25.6%
#9
23.1%
#10
22.3%
What city has the Highest Poverty Level Among Married Couples in Maryland?
Rohrersville has the Highest Poverty Level Among Married Couples in Maryland with 61.8%.
What is the Poverty Level Among Married Couples in the State of Maryland?
Poverty Level Among Married Couples in Maryland is 3.0%.
What is the Poverty Level Among Married Couples in the United States?
Poverty Level Among Married Couples in the United States is 4.5%.