Cities with the Highest Poverty Level Among Married Couples in Wyoming
RELATED REPORTS & OPTIONS
Highest Poverty | Married Couple
Wyoming
Compare Cities
Map of Cities with the Highest Poverty Level Among Married Couples in Wyoming
0.0%
80.0%
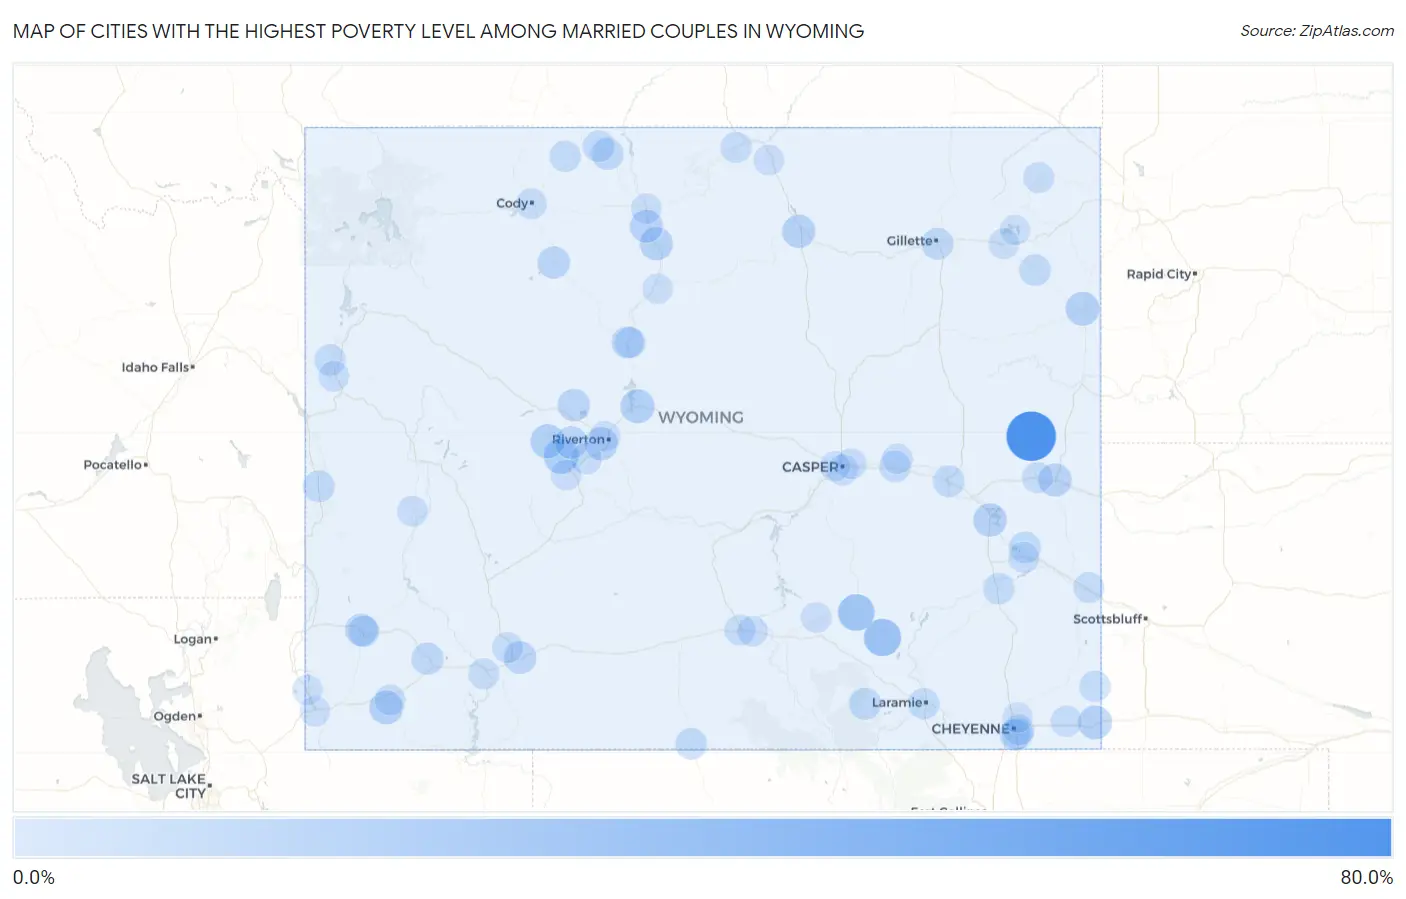
Cities with the Highest Poverty Level Among Married Couples in Wyoming
| City | Married Couples Poverty | vs State | vs National | |
| 1. | Lance Creek | 75.0% | 3.6%(+71.4)#1 | 4.5%(+70.5)#150 |
| 2. | Rock River | 26.5% | 3.6%(+22.9)#2 | 4.5%(+22.0)#1,286 |
| 3. | Medicine Bow | 23.7% | 3.6%(+20.1)#3 | 4.5%(+19.2)#1,582 |
| 4. | Boulder Flats | 18.0% | 3.6%(+14.4)#4 | 4.5%(+13.5)#2,406 |
| 5. | Fort Washakie | 14.4% | 3.6%(+10.8)#5 | 4.5%(+9.94)#3,258 |
| 6. | Shoshoni | 13.8% | 3.6%(+10.3)#6 | 4.5%(+9.37)#3,446 |
| 7. | Newcastle | 13.2% | 3.6%(+9.66)#7 | 4.5%(+8.77)#3,655 |
| 8. | Pine Bluffs | 12.9% | 3.6%(+9.32)#8 | 4.5%(+8.43)#3,793 |
| 9. | Mountain View | 12.6% | 3.6%(+9.02)#9 | 4.5%(+8.13)#3,891 |
| 10. | Glendo | 12.2% | 3.6%(+8.67)#10 | 4.5%(+7.78)#4,058 |
| 11. | Buffalo | 11.2% | 3.6%(+7.62)#11 | 4.5%(+6.74)#4,534 |
| 12. | Manderson | 11.1% | 3.6%(+7.54)#12 | 4.5%(+6.65)#4,602 |
| 13. | Lusk | 11.1% | 3.6%(+7.49)#13 | 4.5%(+6.60)#4,630 |
| 14. | Arapahoe | 11.0% | 3.6%(+7.45)#14 | 4.5%(+6.57)#4,641 |
| 15. | Basin | 9.9% | 3.6%(+6.36)#15 | 4.5%(+5.47)#5,306 |
| 16. | Rock Springs | 9.2% | 3.6%(+5.66)#16 | 4.5%(+4.78)#5,767 |
| 17. | Ethete | 9.1% | 3.6%(+5.52)#17 | 4.5%(+4.63)#5,868 |
| 18. | Kemmerer | 8.3% | 3.6%(+4.73)#18 | 4.5%(+3.84)#6,503 |
| 19. | Meeteetse | 8.1% | 3.6%(+4.55)#19 | 4.5%(+3.66)#6,644 |
| 20. | Pavillion | 7.8% | 3.6%(+4.27)#20 | 4.5%(+3.38)#6,901 |
| 21. | Lovell | 7.1% | 3.6%(+3.57)#21 | 4.5%(+2.68)#7,567 |
| 22. | Granger | 7.0% | 3.6%(+3.44)#22 | 4.5%(+2.56)#7,753 |
| 23. | Thermopolis | 6.4% | 3.6%(+2.87)#23 | 4.5%(+1.98)#8,407 |
| 24. | Gillette | 6.2% | 3.6%(+2.58)#24 | 4.5%(+1.69)#8,763 |
| 25. | Centennial | 6.1% | 3.6%(+2.55)#25 | 4.5%(+1.66)#8,821 |
| 26. | Douglas | 5.7% | 3.6%(+2.15)#26 | 4.5%(+1.26)#9,339 |
| 27. | Hartville | 5.6% | 3.6%(+1.98)#27 | 4.5%(+1.09)#9,605 |
| 28. | Afton | 5.5% | 3.6%(+1.94)#28 | 4.5%(+1.05)#9,643 |
| 29. | Upton | 5.4% | 3.6%(+1.81)#29 | 4.5%(+0.919)#9,858 |
| 30. | Cowley | 5.1% | 3.6%(+1.49)#30 | 4.5%(+0.601)#10,341 |
| 31. | Fox Farm College | 5.0% | 3.6%(+1.42)#31 | 4.5%(+0.538)#10,416 |
| 32. | Baggs | 4.9% | 3.6%(+1.34)#32 | 4.5%(+0.456)#10,575 |
| 33. | Glenrock | 4.9% | 3.6%(+1.28)#33 | 4.5%(+0.398)#10,661 |
| 34. | Wheatland | 4.5% | 3.6%(+0.907)#34 | 4.5%(+0.020)#11,315 |
| 35. | Moose Wilson Road | 4.3% | 3.6%(+0.693)#35 | 4.5%(-0.194)#11,679 |
| 36. | Diamondville | 4.2% | 3.6%(+0.650)#36 | 4.5%(-0.237)#11,764 |
| 37. | Laramie | 4.1% | 3.6%(+0.546)#37 | 4.5%(-0.341)#11,961 |
| 38. | Powell | 4.1% | 3.6%(+0.495)#38 | 4.5%(-0.392)#12,065 |
| 39. | Albin | 3.7% | 3.6%(+0.083)#39 | 4.5%(-0.803)#12,901 |
| 40. | Hudson | 3.6% | 3.6%(+0.029)#40 | 4.5%(-0.858)#13,006 |
| 41. | Burns | 3.6% | 3.6%(+0.029)#41 | 4.5%(-0.858)#13,008 |
| 42. | South Greeley | 3.6% | 3.6%(-0.022)#42 | 4.5%(-0.909)#13,126 |
| 43. | East Thermopolis | 3.2% | 3.6%(-0.349)#43 | 4.5%(-1.24)#13,859 |
| 44. | Guernsey | 3.2% | 3.6%(-0.375)#44 | 4.5%(-1.26)#13,912 |
| 45. | Green River | 3.1% | 3.6%(-0.426)#45 | 4.5%(-1.31)#14,021 |
| 46. | Rawlins | 3.1% | 3.6%(-0.450)#46 | 4.5%(-1.34)#14,058 |
| 47. | Casper | 3.1% | 3.6%(-0.473)#47 | 4.5%(-1.36)#14,128 |
| 48. | Manville | 3.0% | 3.6%(-0.545)#48 | 4.5%(-1.43)#14,298 |
| 49. | Dayton | 2.9% | 3.6%(-0.668)#49 | 4.5%(-1.55)#14,592 |
| 50. | Cody | 2.7% | 3.6%(-0.854)#50 | 4.5%(-1.74)#15,013 |
| 51. | Hulett | 2.7% | 3.6%(-0.908)#51 | 4.5%(-1.80)#15,152 |
| 52. | North Rock Springs | 2.5% | 3.6%(-1.06)#52 | 4.5%(-1.95)#15,534 |
| 53. | Lyman | 2.5% | 3.6%(-1.08)#53 | 4.5%(-1.97)#15,588 |
| 54. | Torrington | 2.5% | 3.6%(-1.09)#54 | 4.5%(-1.98)#15,606 |
| 55. | Cheyenne | 2.3% | 3.6%(-1.31)#55 | 4.5%(-2.20)#16,183 |
| 56. | Moorcroft | 2.0% | 3.6%(-1.56)#56 | 4.5%(-2.45)#16,837 |
| 57. | Marbleton | 2.0% | 3.6%(-1.61)#57 | 4.5%(-2.50)#16,968 |
| 58. | South Park | 2.0% | 3.6%(-1.62)#58 | 4.5%(-2.51)#16,997 |
| 59. | Sinclair | 1.9% | 3.6%(-1.72)#59 | 4.5%(-2.61)#17,232 |
| 60. | Sheridan | 1.7% | 3.6%(-1.86)#60 | 4.5%(-2.75)#17,593 |
| 61. | Evansville | 1.7% | 3.6%(-1.86)#61 | 4.5%(-2.75)#17,596 |
| 62. | Rolling Hills | 1.6% | 3.6%(-1.99)#62 | 4.5%(-2.87)#17,920 |
| 63. | Greybull | 1.5% | 3.6%(-2.08)#63 | 4.5%(-2.96)#18,157 |
| 64. | Riverton | 1.4% | 3.6%(-2.17)#64 | 4.5%(-3.06)#18,414 |
| 65. | Lander | 1.4% | 3.6%(-2.20)#65 | 4.5%(-3.09)#18,502 |
| 66. | Hanna | 1.4% | 3.6%(-2.21)#66 | 4.5%(-3.10)#18,528 |
| 67. | La Grange | 1.3% | 3.6%(-2.29)#67 | 4.5%(-3.18)#18,749 |
| 68. | Evanston | 1.1% | 3.6%(-2.44)#68 | 4.5%(-3.33)#19,127 |
| 69. | Worland | 1.1% | 3.6%(-2.51)#69 | 4.5%(-3.40)#19,285 |
| 70. | Bear River | 0.93% | 3.6%(-2.65)#70 | 4.5%(-3.54)#19,611 |
| 71. | Ranchettes | 0.82% | 3.6%(-2.75)#71 | 4.5%(-3.64)#19,825 |
| 72. | Pine Haven | 0.81% | 3.6%(-2.77)#72 | 4.5%(-3.66)#19,866 |
| 73. | Mills | 0.52% | 3.6%(-3.05)#73 | 4.5%(-3.94)#20,366 |
1
2Common Questions
What are the Top 10 Cities with the Highest Poverty Level Among Married Couples in Wyoming?
Top 10 Cities with the Highest Poverty Level Among Married Couples in Wyoming are:
#1
75.0%
#2
26.5%
#3
23.7%
#4
18.0%
#5
14.4%
#6
13.8%
#7
13.2%
#8
12.9%
#9
12.6%
#10
12.2%
What city has the Highest Poverty Level Among Married Couples in Wyoming?
Lance Creek has the Highest Poverty Level Among Married Couples in Wyoming with 75.0%.
What is the Poverty Level Among Married Couples in the State of Wyoming?
Poverty Level Among Married Couples in Wyoming is 3.6%.
What is the Poverty Level Among Married Couples in the United States?
Poverty Level Among Married Couples in the United States is 4.5%.