Cities with the Highest Poverty Level Among Married Couples in Mississippi
RELATED REPORTS & OPTIONS
Highest Poverty | Married Couple
Mississippi
Compare Cities
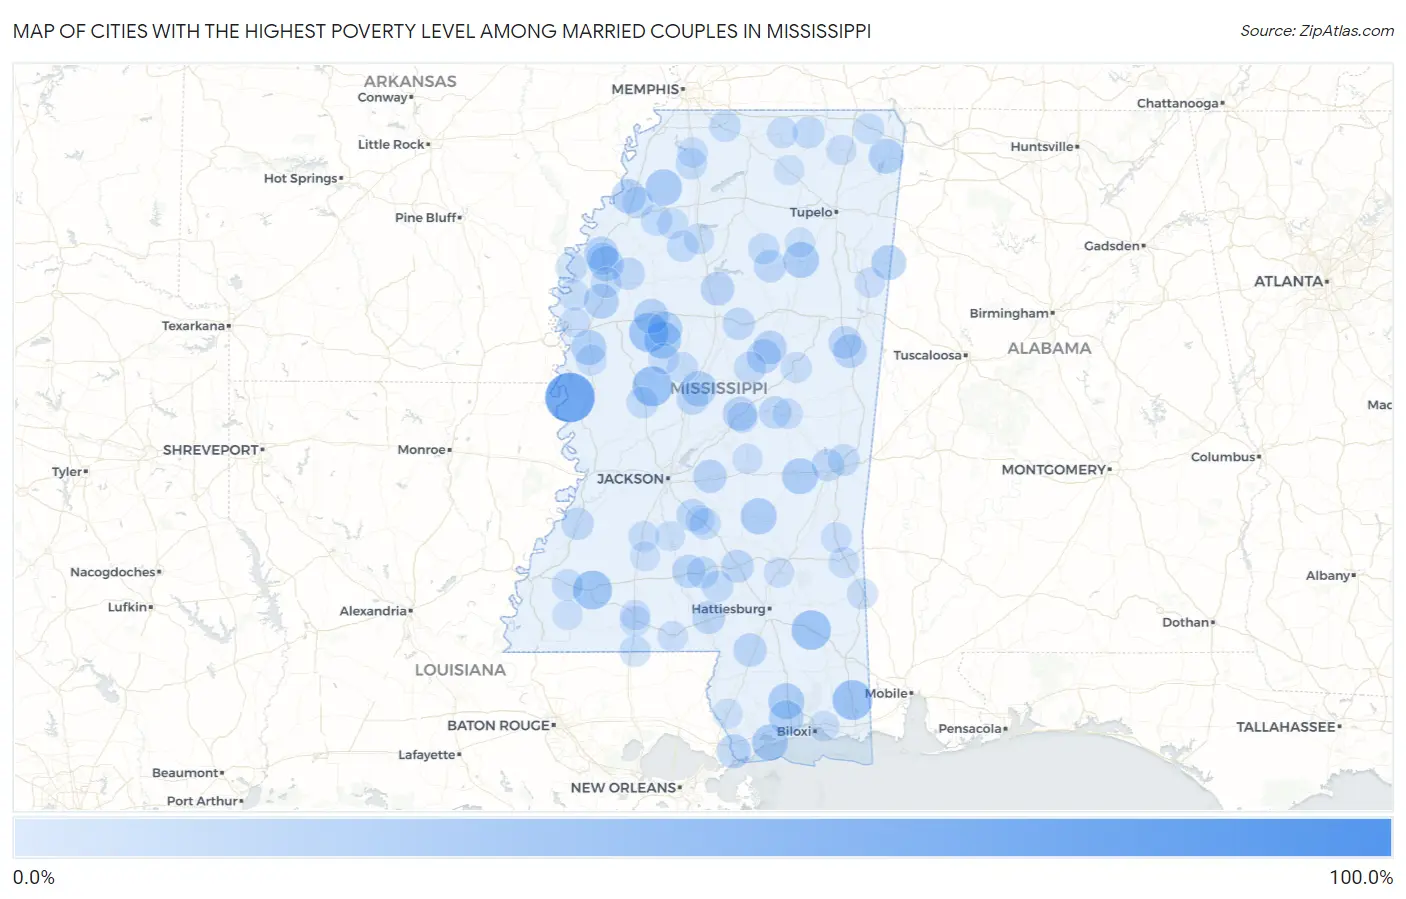
Map of Cities with the Highest Poverty Level Among Married Couples in Mississippi
0.0%
100.0%
Cities with the Highest Poverty Level Among Married Couples in Mississippi
| City | Married Couples Poverty | vs State | vs National | |
| 1. | Symonds | 100.0% | 6.0%(+94.0)#1 | 4.5%(+95.5)#93 |
| 2. | Bovina | 78.3% | 6.0%(+72.3)#2 | 4.5%(+73.8)#136 |
| 3. | Mayersville | 75.0% | 6.0%(+69.0)#3 | 4.5%(+70.5)#148 |
| 4. | Eden | 42.9% | 6.0%(+36.9)#4 | 4.5%(+38.4)#538 |
| 5. | Wade | 41.8% | 6.0%(+35.8)#5 | 4.5%(+37.4)#574 |
| 6. | Beaumont | 40.2% | 6.0%(+34.2)#6 | 4.5%(+35.7)#613 |
| 7. | Morgan City | 40.0% | 6.0%(+34.0)#7 | 4.5%(+35.5)#621 |
| 8. | Bude | 39.4% | 6.0%(+33.4)#8 | 4.5%(+34.9)#656 |
| 9. | Agricola | 35.0% | 6.0%(+29.0)#9 | 4.5%(+30.6)#802 |
| 10. | Cruger | 33.3% | 6.0%(+27.3)#10 | 4.5%(+28.9)#875 |
| 11. | Sledge | 30.8% | 6.0%(+24.8)#11 | 4.5%(+26.3)#992 |
| 12. | Sylvarena | 30.0% | 6.0%(+24.0)#12 | 4.5%(+25.5)#1,032 |
| 13. | Saucier | 29.6% | 6.0%(+23.6)#13 | 4.5%(+25.2)#1,054 |
| 14. | Henderson Point | 29.6% | 6.0%(+23.6)#14 | 4.5%(+25.2)#1,056 |
| 15. | Hickory | 29.4% | 6.0%(+23.4)#15 | 4.5%(+24.9)#1,062 |
| 16. | Houston | 29.2% | 6.0%(+23.2)#16 | 4.5%(+24.7)#1,073 |
| 17. | De Soto | 28.2% | 6.0%(+22.2)#17 | 4.5%(+23.7)#1,145 |
| 18. | Goodman | 27.0% | 6.0%(+21.0)#18 | 4.5%(+22.6)#1,241 |
| 19. | Arcola | 26.3% | 6.0%(+20.3)#19 | 4.5%(+21.9)#1,304 |
| 20. | Paden | 26.3% | 6.0%(+20.3)#20 | 4.5%(+21.9)#1,310 |
| 21. | Gattman | 25.9% | 6.0%(+19.9)#21 | 4.5%(+21.5)#1,341 |
| 22. | Shaw | 25.7% | 6.0%(+19.7)#22 | 4.5%(+21.3)#1,355 |
| 23. | Itta Bena | 25.3% | 6.0%(+19.3)#23 | 4.5%(+20.8)#1,388 |
| 24. | Mound Bayou | 25.2% | 6.0%(+19.2)#24 | 4.5%(+20.7)#1,394 |
| 25. | Sidon | 25.0% | 6.0%(+19.0)#25 | 4.5%(+20.5)#1,429 |
| 26. | Lyman | 24.7% | 6.0%(+18.7)#26 | 4.5%(+20.2)#1,477 |
| 27. | Redwater | 23.6% | 6.0%(+17.6)#27 | 4.5%(+19.2)#1,591 |
| 28. | Coahoma | 23.5% | 6.0%(+17.5)#28 | 4.5%(+19.1)#1,606 |
| 29. | Pearlington | 23.4% | 6.0%(+17.4)#29 | 4.5%(+18.9)#1,623 |
| 30. | Shelby | 23.3% | 6.0%(+17.3)#30 | 4.5%(+18.8)#1,631 |
| 31. | Mccool | 23.1% | 6.0%(+17.1)#31 | 4.5%(+18.6)#1,656 |
| 32. | Eudora | 23.0% | 6.0%(+17.0)#32 | 4.5%(+18.6)#1,664 |
| 33. | Brooksville | 21.9% | 6.0%(+15.9)#33 | 4.5%(+17.4)#1,810 |
| 34. | Weir | 21.8% | 6.0%(+15.8)#34 | 4.5%(+17.3)#1,824 |
| 35. | Elliott | 21.7% | 6.0%(+15.7)#35 | 4.5%(+17.2)#1,835 |
| 36. | Pelahatchie | 21.7% | 6.0%(+15.7)#36 | 4.5%(+17.2)#1,836 |
| 37. | Lumberton | 21.2% | 6.0%(+15.2)#37 | 4.5%(+16.8)#1,882 |
| 38. | Silver Creek | 20.8% | 6.0%(+14.8)#38 | 4.5%(+16.4)#1,926 |
| 39. | Columbia | 20.0% | 6.0%(+14.0)#39 | 4.5%(+15.6)#2,023 |
| 40. | Crawford | 19.8% | 6.0%(+13.7)#40 | 4.5%(+15.3)#2,105 |
| 41. | Collins | 19.2% | 6.0%(+13.2)#41 | 4.5%(+14.7)#2,184 |
| 42. | Pearl River | 18.3% | 6.0%(+12.2)#42 | 4.5%(+13.8)#2,347 |
| 43. | Winstonville | 18.2% | 6.0%(+12.2)#43 | 4.5%(+13.7)#2,369 |
| 44. | Derma | 18.1% | 6.0%(+12.1)#44 | 4.5%(+13.6)#2,388 |
| 45. | Drew | 17.8% | 6.0%(+11.8)#45 | 4.5%(+13.3)#2,456 |
| 46. | Port Gibson | 17.6% | 6.0%(+11.6)#46 | 4.5%(+13.1)#2,494 |
| 47. | Nellieburg | 17.3% | 6.0%(+11.3)#47 | 4.5%(+12.9)#2,546 |
| 48. | Kilmichael | 17.3% | 6.0%(+11.3)#48 | 4.5%(+12.8)#2,557 |
| 49. | Braxton | 17.2% | 6.0%(+11.2)#49 | 4.5%(+12.8)#2,566 |
| 50. | Pickens | 17.2% | 6.0%(+11.2)#50 | 4.5%(+12.8)#2,570 |
| 51. | Ethel | 17.0% | 6.0%(+11.0)#51 | 4.5%(+12.5)#2,620 |
| 52. | Marion | 16.6% | 6.0%(+10.6)#52 | 4.5%(+12.1)#2,716 |
| 53. | Prentiss | 16.0% | 6.0%(+9.96)#53 | 4.5%(+11.5)#2,853 |
| 54. | Falkner | 15.9% | 6.0%(+9.90)#54 | 4.5%(+11.4)#2,865 |
| 55. | Yazoo City | 15.6% | 6.0%(+9.63)#55 | 4.5%(+11.2)#2,931 |
| 56. | Roxie | 15.5% | 6.0%(+9.51)#56 | 4.5%(+11.1)#2,966 |
| 57. | Senatobia | 15.4% | 6.0%(+9.40)#57 | 4.5%(+10.9)#2,985 |
| 58. | Jonestown | 15.4% | 6.0%(+9.38)#58 | 4.5%(+10.9)#2,994 |
| 59. | Bassfield | 15.2% | 6.0%(+9.21)#59 | 4.5%(+10.8)#3,038 |
| 60. | Byhalia | 15.0% | 6.0%(+8.98)#60 | 4.5%(+10.5)#3,092 |
| 61. | Rosedale | 14.9% | 6.0%(+8.93)#61 | 4.5%(+10.5)#3,100 |
| 62. | Bruce | 14.9% | 6.0%(+8.91)#62 | 4.5%(+10.5)#3,107 |
| 63. | Mendenhall | 14.8% | 6.0%(+8.83)#63 | 4.5%(+10.4)#3,125 |
| 64. | Charleston | 14.6% | 6.0%(+8.62)#64 | 4.5%(+10.2)#3,198 |
| 65. | Osyka | 14.5% | 6.0%(+8.51)#65 | 4.5%(+10.1)#3,225 |
| 66. | Lambert | 14.4% | 6.0%(+8.39)#66 | 4.5%(+9.93)#3,263 |
| 67. | Benoit | 13.8% | 6.0%(+7.75)#67 | 4.5%(+9.29)#3,472 |
| 68. | Hollandale | 13.7% | 6.0%(+7.74)#68 | 4.5%(+9.28)#3,474 |
| 69. | Louisville | 13.7% | 6.0%(+7.69)#69 | 4.5%(+9.23)#3,488 |
| 70. | Crowder | 13.5% | 6.0%(+7.48)#70 | 4.5%(+9.02)#3,569 |
| 71. | Ashland | 13.4% | 6.0%(+7.43)#71 | 4.5%(+8.97)#3,585 |
| 72. | Lexington | 13.3% | 6.0%(+7.33)#72 | 4.5%(+8.87)#3,609 |
| 73. | Hazlehurst | 13.2% | 6.0%(+7.18)#73 | 4.5%(+8.72)#3,666 |
| 74. | Oakland | 13.2% | 6.0%(+7.15)#74 | 4.5%(+8.70)#3,679 |
| 75. | Randolph | 13.1% | 6.0%(+7.10)#75 | 4.5%(+8.64)#3,707 |
| 76. | Waynesboro | 13.1% | 6.0%(+7.09)#76 | 4.5%(+8.63)#3,708 |
| 77. | State Line | 13.0% | 6.0%(+7.04)#77 | 4.5%(+8.58)#3,725 |
| 78. | Cleveland | 13.0% | 6.0%(+6.99)#78 | 4.5%(+8.53)#3,755 |
| 79. | Glen | 13.0% | 6.0%(+6.98)#79 | 4.5%(+8.53)#3,760 |
| 80. | Tchula | 12.8% | 6.0%(+6.84)#80 | 4.5%(+8.38)#3,811 |
| 81. | Carthage | 12.7% | 6.0%(+6.68)#81 | 4.5%(+8.23)#3,857 |
| 82. | Gulf Hills | 12.6% | 6.0%(+6.59)#82 | 4.5%(+8.13)#3,892 |
| 83. | Shubuta | 12.2% | 6.0%(+6.24)#83 | 4.5%(+7.78)#4,055 |
| 84. | Mccomb | 12.1% | 6.0%(+6.08)#84 | 4.5%(+7.63)#4,135 |
| 85. | Philadelphia | 12.1% | 6.0%(+6.06)#85 | 4.5%(+7.60)#4,146 |
| 86. | Tylertown | 11.9% | 6.0%(+5.89)#86 | 4.5%(+7.43)#4,219 |
| 87. | Coldwater | 11.8% | 6.0%(+5.76)#87 | 4.5%(+7.30)#4,274 |
| 88. | Hamilton | 11.6% | 6.0%(+5.62)#88 | 4.5%(+7.17)#4,351 |
| 89. | Hillsboro | 11.5% | 6.0%(+5.53)#89 | 4.5%(+7.08)#4,382 |
| 90. | Ellisville | 11.5% | 6.0%(+5.51)#90 | 4.5%(+7.05)#4,399 |
| 91. | Jumpertown | 11.4% | 6.0%(+5.42)#91 | 4.5%(+6.97)#4,432 |
| 92. | Metcalfe | 11.3% | 6.0%(+5.30)#92 | 4.5%(+6.84)#4,488 |
| 93. | Summit | 11.3% | 6.0%(+5.25)#93 | 4.5%(+6.79)#4,510 |
| 94. | Myrtle | 11.1% | 6.0%(+5.11)#94 | 4.5%(+6.65)#4,561 |
| 95. | Crosby | 11.1% | 6.0%(+5.11)#95 | 4.5%(+6.65)#4,585 |
| 96. | Picayune | 11.0% | 6.0%(+5.00)#96 | 4.5%(+6.54)#4,645 |
| 97. | Georgetown | 10.8% | 6.0%(+4.81)#97 | 4.5%(+6.35)#4,755 |
| 98. | New Houlka | 10.7% | 6.0%(+4.66)#98 | 4.5%(+6.20)#4,837 |
| 99. | Beauregard | 10.4% | 6.0%(+4.44)#99 | 4.5%(+5.99)#4,973 |
| 100. | D Lo | 10.4% | 6.0%(+4.41)#100 | 4.5%(+5.95)#5,004 |
Common Questions
What are the Top 10 Cities with the Highest Poverty Level Among Married Couples in Mississippi?
Top 10 Cities with the Highest Poverty Level Among Married Couples in Mississippi are:
#1
75.0%
#2
42.9%
#3
41.8%
#4
40.2%
#5
40.0%
#6
39.4%
#7
33.3%
#8
30.8%
#9
30.0%
#10
29.6%
What city has the Highest Poverty Level Among Married Couples in Mississippi?
Mayersville has the Highest Poverty Level Among Married Couples in Mississippi with 75.0%.
What is the Poverty Level Among Married Couples in the State of Mississippi?
Poverty Level Among Married Couples in Mississippi is 6.0%.
What is the Poverty Level Among Married Couples in the United States?
Poverty Level Among Married Couples in the United States is 4.5%.