Cities with the Highest Poverty Level Among Married Couples in Montana
RELATED REPORTS & OPTIONS
Highest Poverty | Married Couple
Montana
Compare Cities
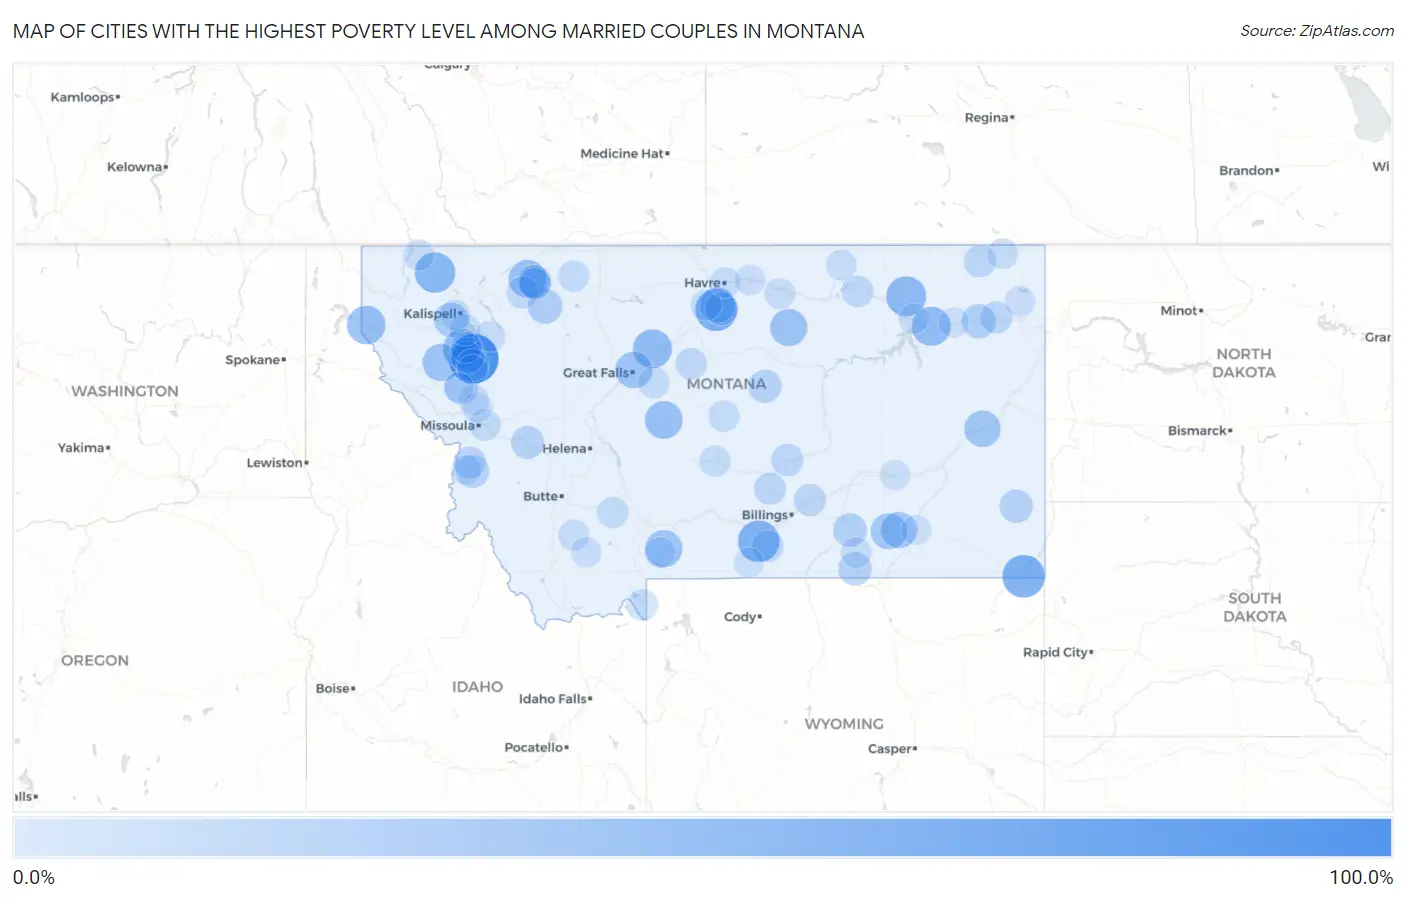
Map of Cities with the Highest Poverty Level Among Married Couples in Montana
0.0%
100.0%
Cities with the Highest Poverty Level Among Married Couples in Montana
| City | Married Couples Poverty | vs State | vs National | |
| 1. | Turtle Lake | 100.0% | 3.9%(+96.1)#1 | 4.5%(+95.5)#45 |
| 2. | Camrose Colony | 100.0% | 3.9%(+96.1)#2 | 4.5%(+95.5)#68 |
| 3. | Turner Colony | 100.0% | 3.9%(+96.1)#3 | 4.5%(+95.5)#73 |
| 4. | Eagle Creek Colony | 100.0% | 3.9%(+96.1)#4 | 4.5%(+95.5)#80 |
| 5. | Pleasant Valley Colony | 100.0% | 3.9%(+96.1)#5 | 4.5%(+95.5)#85 |
| 6. | Sage Creek Colony | 100.0% | 3.9%(+96.1)#6 | 4.5%(+95.5)#96 |
| 7. | Surprise Creek Colony | 100.0% | 3.9%(+96.1)#7 | 4.5%(+95.5)#104 |
| 8. | Moccasin | 92.9% | 3.9%(+88.9)#8 | 4.5%(+88.4)#108 |
| 9. | Riverview Colony | 83.8% | 3.9%(+79.8)#9 | 4.5%(+79.3)#118 |
| 10. | Alzada | 66.7% | 3.9%(+62.7)#10 | 4.5%(+62.2)#199 |
| 11. | St Pierre | 64.0% | 3.9%(+60.1)#11 | 4.5%(+59.5)#215 |
| 12. | Norris | 63.6% | 3.9%(+59.7)#12 | 4.5%(+59.2)#221 |
| 13. | Boyd | 62.5% | 3.9%(+58.6)#13 | 4.5%(+58.0)#233 |
| 14. | New Miami Colony | 61.3% | 3.9%(+57.3)#14 | 4.5%(+56.8)#251 |
| 15. | Stryker | 57.1% | 3.9%(+53.2)#15 | 4.5%(+52.7)#303 |
| 16. | St Marie | 54.2% | 3.9%(+50.2)#16 | 4.5%(+49.7)#333 |
| 17. | Frazer | 50.0% | 3.9%(+46.1)#17 | 4.5%(+45.5)#378 |
| 18. | Nibbe | 50.0% | 3.9%(+46.1)#18 | 4.5%(+45.5)#383 |
| 19. | Carter | 50.0% | 3.9%(+46.1)#19 | 4.5%(+45.5)#388 |
| 20. | Big Arm | 48.9% | 3.9%(+45.0)#20 | 4.5%(+44.5)#412 |
| 21. | Heron | 47.6% | 3.9%(+43.6)#21 | 4.5%(+43.1)#431 |
| 22. | Starr School | 44.4% | 3.9%(+40.5)#22 | 4.5%(+40.0)#498 |
| 23. | Neihart | 44.4% | 3.9%(+40.5)#23 | 4.5%(+40.0)#504 |
| 24. | Camas | 42.9% | 3.9%(+38.9)#24 | 4.5%(+38.4)#551 |
| 25. | Emigrant | 42.4% | 3.9%(+38.4)#25 | 4.5%(+37.9)#557 |
| 26. | Lodge Pole | 41.7% | 3.9%(+37.7)#26 | 4.5%(+37.2)#577 |
| 27. | Black Eagle | 39.3% | 3.9%(+35.3)#27 | 4.5%(+34.8)#662 |
| 28. | Fallon | 38.5% | 3.9%(+34.5)#28 | 4.5%(+34.0)#685 |
| 29. | Rimrock Colony | 37.5% | 3.9%(+33.6)#29 | 4.5%(+33.0)#722 |
| 30. | Birch Creek Colony | 37.5% | 3.9%(+33.6)#30 | 4.5%(+33.0)#723 |
| 31. | Muddy | 37.0% | 3.9%(+33.1)#31 | 4.5%(+32.6)#736 |
| 32. | Lame Deer | 36.9% | 3.9%(+33.0)#32 | 4.5%(+32.5)#739 |
| 33. | Azure | 33.3% | 3.9%(+29.4)#33 | 4.5%(+28.9)#873 |
| 34. | Kila | 30.6% | 3.9%(+26.7)#34 | 4.5%(+26.2)#1,003 |
| 35. | Jette | 30.6% | 3.9%(+26.6)#35 | 4.5%(+26.1)#1,008 |
| 36. | Heart Butte | 30.3% | 3.9%(+26.4)#36 | 4.5%(+25.8)#1,013 |
| 37. | Poplar | 28.2% | 3.9%(+24.3)#37 | 4.5%(+23.7)#1,144 |
| 38. | Crow Agency | 25.8% | 3.9%(+21.8)#38 | 4.5%(+21.3)#1,349 |
| 39. | Wyola | 25.0% | 3.9%(+21.1)#39 | 4.5%(+20.5)#1,421 |
| 40. | Old Agency | 25.0% | 3.9%(+21.1)#40 | 4.5%(+20.5)#1,447 |
| 41. | Ekalaka | 24.5% | 3.9%(+20.6)#41 | 4.5%(+20.1)#1,490 |
| 42. | Roy | 24.0% | 3.9%(+20.1)#42 | 4.5%(+19.5)#1,551 |
| 43. | Browning | 23.5% | 3.9%(+19.6)#43 | 4.5%(+19.1)#1,599 |
| 44. | Corvallis | 23.5% | 3.9%(+19.5)#44 | 4.5%(+19.0)#1,617 |
| 45. | Drummond | 22.7% | 3.9%(+18.8)#45 | 4.5%(+18.3)#1,700 |
| 46. | North Browning | 22.7% | 3.9%(+18.7)#46 | 4.5%(+18.2)#1,703 |
| 47. | Parker School | 22.6% | 3.9%(+18.6)#47 | 4.5%(+18.1)#1,717 |
| 48. | Rapelje | 22.2% | 3.9%(+18.3)#48 | 4.5%(+17.8)#1,762 |
| 49. | Kerr | 21.4% | 3.9%(+17.5)#49 | 4.5%(+17.0)#1,866 |
| 50. | Pine Creek | 20.7% | 3.9%(+16.7)#50 | 4.5%(+16.2)#1,945 |
| 51. | Camp Three | 20.0% | 3.9%(+16.1)#51 | 4.5%(+15.5)#2,056 |
| 52. | Pendroy | 20.0% | 3.9%(+16.1)#52 | 4.5%(+15.5)#2,086 |
| 53. | Pablo | 19.6% | 3.9%(+15.7)#53 | 4.5%(+15.1)#2,118 |
| 54. | Brockton | 19.0% | 3.9%(+15.1)#54 | 4.5%(+14.6)#2,201 |
| 55. | Flaxville | 19.0% | 3.9%(+15.1)#55 | 4.5%(+14.6)#2,213 |
| 56. | Victor | 18.9% | 3.9%(+14.9)#56 | 4.5%(+14.4)#2,237 |
| 57. | Fromberg | 18.7% | 3.9%(+14.7)#57 | 4.5%(+14.2)#2,274 |
| 58. | Worden | 18.5% | 3.9%(+14.6)#58 | 4.5%(+14.1)#2,297 |
| 59. | Broadview | 18.4% | 3.9%(+14.5)#59 | 4.5%(+14.0)#2,323 |
| 60. | East Glacier Park Village | 18.2% | 3.9%(+14.2)#60 | 4.5%(+13.7)#2,362 |
| 61. | Saco | 17.4% | 3.9%(+13.4)#61 | 4.5%(+12.9)#2,535 |
| 62. | Geraldine | 17.0% | 3.9%(+13.0)#62 | 4.5%(+12.5)#2,621 |
| 63. | Belt | 16.7% | 3.9%(+12.7)#63 | 4.5%(+12.2)#2,673 |
| 64. | Willow Creek | 16.0% | 3.9%(+12.1)#64 | 4.5%(+11.5)#2,843 |
| 65. | South Browning | 16.0% | 3.9%(+12.0)#65 | 4.5%(+11.5)#2,851 |
| 66. | Bonner West Riverside | 15.5% | 3.9%(+11.6)#66 | 4.5%(+11.0)#2,970 |
| 67. | Lakeside | 15.5% | 3.9%(+11.5)#67 | 4.5%(+11.0)#2,973 |
| 68. | West Yellowstone | 15.2% | 3.9%(+11.2)#68 | 4.5%(+10.7)#3,043 |
| 69. | Moore | 15.1% | 3.9%(+11.1)#69 | 4.5%(+10.6)#3,067 |
| 70. | Harlowton | 14.8% | 3.9%(+10.9)#70 | 4.5%(+10.4)#3,129 |
| 71. | Rocky Boy West | 14.3% | 3.9%(+10.3)#71 | 4.5%(+9.82)#3,281 |
| 72. | Landusky | 14.3% | 3.9%(+10.3)#72 | 4.5%(+9.82)#3,336 |
| 73. | Cut Bank | 14.1% | 3.9%(+10.2)#73 | 4.5%(+9.65)#3,369 |
| 74. | Lindisfarne | 13.6% | 3.9%(+9.67)#74 | 4.5%(+9.15)#3,517 |
| 75. | Batavia | 13.6% | 3.9%(+9.66)#75 | 4.5%(+9.14)#3,520 |
| 76. | Twin Bridges | 13.3% | 3.9%(+9.39)#76 | 4.5%(+8.87)#3,623 |
| 77. | Eureka | 13.2% | 3.9%(+9.22)#77 | 4.5%(+8.70)#3,675 |
| 78. | Arlee | 13.2% | 3.9%(+9.22)#78 | 4.5%(+8.70)#3,677 |
| 79. | Lodge Grass | 13.0% | 3.9%(+9.10)#79 | 4.5%(+8.58)#3,729 |
| 80. | Fort Belknap Agency | 12.6% | 3.9%(+8.70)#80 | 4.5%(+8.18)#3,876 |
| 81. | Whitewater | 12.5% | 3.9%(+8.56)#81 | 4.5%(+8.04)#3,958 |
| 82. | Essex | 12.5% | 3.9%(+8.56)#82 | 4.5%(+8.04)#3,965 |
| 83. | Outlook | 12.5% | 3.9%(+8.56)#83 | 4.5%(+8.04)#3,967 |
| 84. | Ronan | 12.3% | 3.9%(+8.36)#84 | 4.5%(+7.84)#4,032 |
| 85. | Havre North | 12.2% | 3.9%(+8.30)#85 | 4.5%(+7.78)#4,054 |
| 86. | Swan Lake | 12.2% | 3.9%(+8.30)#86 | 4.5%(+7.78)#4,057 |
| 87. | South Glastonbury | 12.1% | 3.9%(+8.13)#87 | 4.5%(+7.61)#4,143 |
| 88. | Pinnacle | 11.8% | 3.9%(+7.82)#88 | 4.5%(+7.30)#4,302 |
| 89. | Froid | 11.5% | 3.9%(+7.60)#89 | 4.5%(+7.08)#4,390 |
| 90. | Chinook | 11.3% | 3.9%(+7.32)#90 | 4.5%(+6.80)#4,505 |
| 91. | Alder | 11.1% | 3.9%(+7.17)#91 | 4.5%(+6.65)#4,605 |
| 92. | North Harlem Colony | 11.1% | 3.9%(+7.17)#92 | 4.5%(+6.65)#4,618 |
| 93. | Forsyth | 10.6% | 3.9%(+6.62)#93 | 4.5%(+6.10)#4,906 |
| 94. | Pinesdale | 10.5% | 3.9%(+6.58)#94 | 4.5%(+6.06)#4,912 |
| 95. | Wolf Point | 10.4% | 3.9%(+6.46)#95 | 4.5%(+5.94)#5,014 |
| 96. | Ashland | 10.4% | 3.9%(+6.44)#96 | 4.5%(+5.92)#5,024 |
| 97. | Nashua | 10.2% | 3.9%(+6.26)#97 | 4.5%(+5.74)#5,125 |
| 98. | Evaro | 10.1% | 3.9%(+6.17)#98 | 4.5%(+5.65)#5,175 |
| 99. | Dixon | 10.0% | 3.9%(+6.06)#99 | 4.5%(+5.54)#5,250 |
| 100. | Red Lodge | 10.0% | 3.9%(+6.01)#100 | 4.5%(+5.49)#5,298 |
Common Questions
What are the Top 10 Cities with the Highest Poverty Level Among Married Couples in Montana?
Top 10 Cities with the Highest Poverty Level Among Married Couples in Montana are:
What city has the Highest Poverty Level Among Married Couples in Montana?
Turtle Lake has the Highest Poverty Level Among Married Couples in Montana with 100.0%.
What is the Poverty Level Among Married Couples in the State of Montana?
Poverty Level Among Married Couples in Montana is 3.9%.
What is the Poverty Level Among Married Couples in the United States?
Poverty Level Among Married Couples in the United States is 4.5%.