Cities with the Highest Poverty Level Among Married Couples in Massachusetts
RELATED REPORTS & OPTIONS
Highest Poverty | Married Couple
Massachusetts
Compare Cities
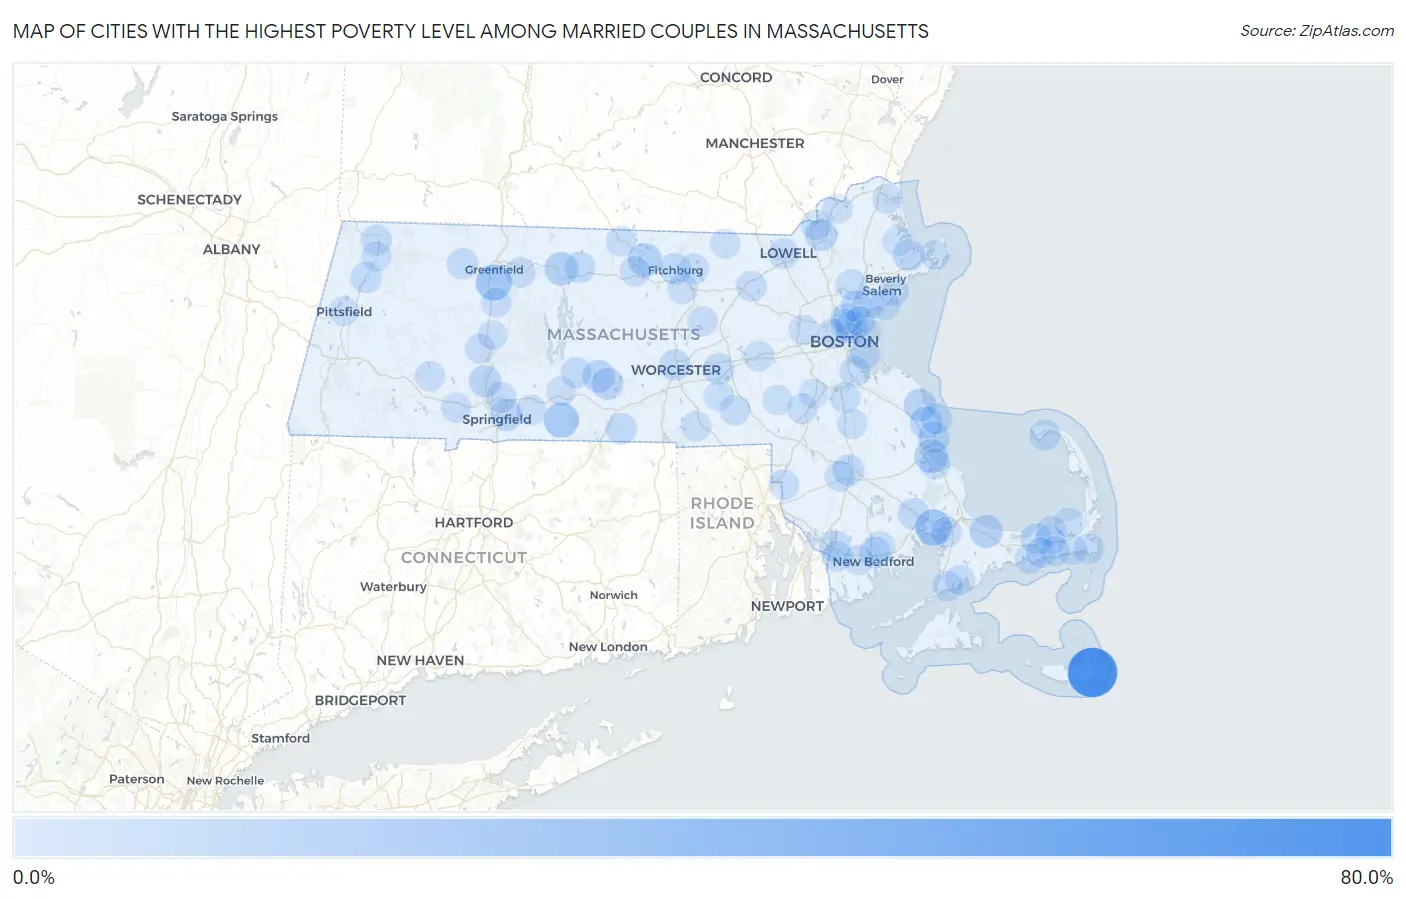
Map of Cities with the Highest Poverty Level Among Married Couples in Massachusetts
0.0%
80.0%
Cities with the Highest Poverty Level Among Married Couples in Massachusetts
| City | Married Couples Poverty | vs State | vs National | |
| 1. | Siasconset | 66.7% | 3.0%(+63.7)#1 | 4.5%(+62.2)#189 |
| 2. | Onset | 22.2% | 3.0%(+19.2)#2 | 4.5%(+17.7)#1,781 |
| 3. | Deerfield | 21.7% | 3.0%(+18.7)#3 | 4.5%(+17.2)#1,834 |
| 4. | Monson Center | 18.4% | 3.0%(+15.5)#4 | 4.5%(+14.0)#2,315 |
| 5. | South Ashburnham | 14.0% | 3.0%(+11.0)#5 | 4.5%(+9.54)#3,399 |
| 6. | North Plymouth | 14.0% | 3.0%(+11.0)#6 | 4.5%(+9.49)#3,408 |
| 7. | Orange | 13.4% | 3.0%(+10.4)#7 | 4.5%(+8.94)#3,591 |
| 8. | East Sandwich | 12.2% | 3.0%(+9.19)#8 | 4.5%(+7.70)#4,093 |
| 9. | Oak Bluffs | 10.9% | 3.0%(+7.89)#9 | 4.5%(+6.39)#4,737 |
| 10. | Marshfield Hills | 10.7% | 3.0%(+7.69)#10 | 4.5%(+6.19)#4,847 |
| 11. | West Brookfield | 10.6% | 3.0%(+7.66)#11 | 4.5%(+6.17)#4,865 |
| 12. | Marshfield | 10.0% | 3.0%(+7.07)#12 | 4.5%(+5.58)#5,210 |
| 13. | Chelsea | 9.2% | 3.0%(+6.20)#13 | 4.5%(+4.71)#5,817 |
| 14. | Holyoke | 9.1% | 3.0%(+6.15)#14 | 4.5%(+4.65)#5,857 |
| 15. | Lawrence | 9.1% | 3.0%(+6.09)#15 | 4.5%(+4.60)#5,942 |
| 16. | Brookfield | 8.8% | 3.0%(+5.82)#16 | 4.5%(+4.32)#6,139 |
| 17. | Springfield | 8.7% | 3.0%(+5.74)#17 | 4.5%(+4.25)#6,178 |
| 18. | Essex | 8.5% | 3.0%(+5.58)#18 | 4.5%(+4.08)#6,294 |
| 19. | West Wareham | 8.0% | 3.0%(+5.01)#19 | 4.5%(+3.52)#6,769 |
| 20. | Duxbury | 7.9% | 3.0%(+4.90)#20 | 4.5%(+3.41)#6,873 |
| 21. | Fitchburg | 7.3% | 3.0%(+4.36)#21 | 4.5%(+2.87)#7,402 |
| 22. | Worcester | 7.2% | 3.0%(+4.19)#22 | 4.5%(+2.69)#7,554 |
| 23. | Cheshire | 7.1% | 3.0%(+4.18)#23 | 4.5%(+2.68)#7,589 |
| 24. | Everett | 7.1% | 3.0%(+4.17)#24 | 4.5%(+2.68)#7,628 |
| 25. | Westborough | 7.1% | 3.0%(+4.16)#25 | 4.5%(+2.67)#7,632 |
| 26. | Malden | 7.1% | 3.0%(+4.13)#26 | 4.5%(+2.64)#7,651 |
| 27. | Fall River | 7.1% | 3.0%(+4.13)#27 | 4.5%(+2.64)#7,652 |
| 28. | Southbridge Town | 6.9% | 3.0%(+3.97)#28 | 4.5%(+2.48)#7,834 |
| 29. | Raynham Center | 6.9% | 3.0%(+3.89)#29 | 4.5%(+2.40)#7,924 |
| 30. | New Bedford | 6.8% | 3.0%(+3.86)#30 | 4.5%(+2.37)#7,953 |
| 31. | Athol | 6.4% | 3.0%(+3.44)#31 | 4.5%(+1.94)#8,452 |
| 32. | Shelburne Falls | 6.4% | 3.0%(+3.41)#32 | 4.5%(+1.91)#8,495 |
| 33. | Saugus | 6.3% | 3.0%(+3.38)#33 | 4.5%(+1.88)#8,536 |
| 34. | Ocean Bluff Brant Rock | 6.1% | 3.0%(+3.11)#34 | 4.5%(+1.62)#8,858 |
| 35. | Lynnfield | 6.1% | 3.0%(+3.09)#35 | 4.5%(+1.60)#8,874 |
| 36. | Ware | 6.0% | 3.0%(+3.06)#36 | 4.5%(+1.57)#8,932 |
| 37. | Boston | 5.9% | 3.0%(+2.96)#37 | 4.5%(+1.46)#9,048 |
| 38. | Quincy | 5.8% | 3.0%(+2.84)#38 | 4.5%(+1.35)#9,226 |
| 39. | Yarmouth Port | 5.8% | 3.0%(+2.84)#39 | 4.5%(+1.34)#9,232 |
| 40. | Provincetown | 5.7% | 3.0%(+2.73)#40 | 4.5%(+1.24)#9,391 |
| 41. | Lynn | 5.6% | 3.0%(+2.63)#41 | 4.5%(+1.14)#9,501 |
| 42. | North Adams | 5.5% | 3.0%(+2.56)#42 | 4.5%(+1.07)#9,627 |
| 43. | Greenfield | 5.4% | 3.0%(+2.48)#43 | 4.5%(+0.983)#9,745 |
| 44. | Chicopee | 5.4% | 3.0%(+2.43)#44 | 4.5%(+0.940)#9,822 |
| 45. | Methuen Town | 5.3% | 3.0%(+2.35)#45 | 4.5%(+0.852)#9,972 |
| 46. | Cedar Crest | 5.3% | 3.0%(+2.33)#46 | 4.5%(+0.831)#9,998 |
| 47. | Revere | 5.1% | 3.0%(+2.11)#47 | 4.5%(+0.613)#10,325 |
| 48. | Lowell | 5.0% | 3.0%(+2.02)#48 | 4.5%(+0.526)#10,479 |
| 49. | East Dennis | 4.9% | 3.0%(+1.89)#49 | 4.5%(+0.400)#10,656 |
| 50. | Taunton | 4.8% | 3.0%(+1.86)#50 | 4.5%(+0.368)#10,713 |
| 51. | West Chatham | 4.8% | 3.0%(+1.84)#51 | 4.5%(+0.344)#10,754 |
| 52. | Plymouth | 4.8% | 3.0%(+1.82)#52 | 4.5%(+0.328)#10,772 |
| 53. | Bourne | 4.8% | 3.0%(+1.81)#53 | 4.5%(+0.313)#10,802 |
| 54. | South Dennis | 4.7% | 3.0%(+1.73)#54 | 4.5%(+0.240)#10,916 |
| 55. | Lunenburg | 4.7% | 3.0%(+1.68)#55 | 4.5%(+0.189)#10,996 |
| 56. | Randolph Town | 4.6% | 3.0%(+1.67)#56 | 4.5%(+0.176)#11,042 |
| 57. | Falmouth | 4.6% | 3.0%(+1.65)#57 | 4.5%(+0.155)#11,071 |
| 58. | Acushnet Center | 4.6% | 3.0%(+1.64)#58 | 4.5%(+0.143)#11,091 |
| 59. | West Yarmouth | 4.6% | 3.0%(+1.64)#59 | 4.5%(+0.143)#11,096 |
| 60. | North Westport | 4.6% | 3.0%(+1.60)#60 | 4.5%(+0.109)#11,156 |
| 61. | Gardner | 4.4% | 3.0%(+1.44)#61 | 4.5%(-0.056)#11,444 |
| 62. | Hopedale | 4.4% | 3.0%(+1.41)#62 | 4.5%(-0.086)#11,493 |
| 63. | Littleton Common | 4.3% | 3.0%(+1.37)#63 | 4.5%(-0.128)#11,590 |
| 64. | Millers Falls | 4.2% | 3.0%(+1.24)#64 | 4.5%(-0.251)#11,785 |
| 65. | North Seekonk | 4.2% | 3.0%(+1.20)#65 | 4.5%(-0.295)#11,845 |
| 66. | Framingham | 4.1% | 3.0%(+1.16)#66 | 4.5%(-0.335)#11,941 |
| 67. | South Yarmouth | 4.0% | 3.0%(+1.07)#67 | 4.5%(-0.424)#12,117 |
| 68. | Walpole | 4.0% | 3.0%(+1.01)#68 | 4.5%(-0.480)#12,232 |
| 69. | Smith Mills | 3.9% | 3.0%(+0.913)#69 | 4.5%(-0.581)#12,434 |
| 70. | Adams | 3.9% | 3.0%(+0.910)#70 | 4.5%(-0.584)#12,439 |
| 71. | Leominster | 3.8% | 3.0%(+0.878)#71 | 4.5%(-0.616)#12,489 |
| 72. | Brockton | 3.8% | 3.0%(+0.869)#72 | 4.5%(-0.625)#12,549 |
| 73. | Winchendon | 3.8% | 3.0%(+0.792)#73 | 4.5%(-0.703)#12,692 |
| 74. | Westfield | 3.7% | 3.0%(+0.762)#74 | 4.5%(-0.732)#12,753 |
| 75. | Clinton | 3.7% | 3.0%(+0.684)#75 | 4.5%(-0.810)#12,911 |
| 76. | Huntington | 3.6% | 3.0%(+0.583)#76 | 4.5%(-0.912)#13,136 |
| 77. | Waltham | 3.5% | 3.0%(+0.569)#77 | 4.5%(-0.925)#13,157 |
| 78. | East Falmouth | 3.5% | 3.0%(+0.540)#78 | 4.5%(-0.954)#13,221 |
| 79. | Cambridge | 3.5% | 3.0%(+0.534)#79 | 4.5%(-0.960)#13,231 |
| 80. | Northampton | 3.5% | 3.0%(+0.486)#80 | 4.5%(-1.01)#13,321 |
| 81. | Millis Clicquot | 3.4% | 3.0%(+0.462)#81 | 4.5%(-1.03)#13,410 |
| 82. | Harwich Port | 3.4% | 3.0%(+0.461)#82 | 4.5%(-1.03)#13,411 |
| 83. | South Deerfield | 3.4% | 3.0%(+0.417)#83 | 4.5%(-1.08)#13,491 |
| 84. | Salem | 3.4% | 3.0%(+0.388)#84 | 4.5%(-1.11)#13,553 |
| 85. | Newburyport | 3.3% | 3.0%(+0.298)#85 | 4.5%(-1.20)#13,762 |
| 86. | East Douglas | 3.2% | 3.0%(+0.246)#86 | 4.5%(-1.25)#13,885 |
| 87. | Wilbraham | 3.1% | 3.0%(+0.171)#87 | 4.5%(-1.32)#14,039 |
| 88. | Dennis Port | 3.0% | 3.0%(+0.063)#88 | 4.5%(-1.43)#14,282 |
| 89. | Brewster | 3.0% | 3.0%(+0.057)#89 | 4.5%(-1.44)#14,310 |
| 90. | Haverhill | 3.0% | 3.0%(+0.042)#90 | 4.5%(-1.45)#14,337 |
| 91. | Upton | 3.0% | 3.0%(+0.041)#91 | 4.5%(-1.45)#14,342 |
| 92. | Pepperell | 2.9% | 3.0%(-0.040)#92 | 4.5%(-1.53)#14,548 |
| 93. | Norwood | 2.9% | 3.0%(-0.053)#93 | 4.5%(-1.55)#14,568 |
| 94. | Winthrop Town | 2.9% | 3.0%(-0.091)#94 | 4.5%(-1.59)#14,651 |
| 95. | Ipswich | 2.9% | 3.0%(-0.099)#95 | 4.5%(-1.59)#14,668 |
| 96. | Gloucester | 2.9% | 3.0%(-0.100)#96 | 4.5%(-1.59)#14,671 |
| 97. | Swampscott | 2.9% | 3.0%(-0.102)#97 | 4.5%(-1.60)#14,677 |
| 98. | Pittsfield | 2.7% | 3.0%(-0.289)#98 | 4.5%(-1.78)#15,124 |
| 99. | Palmer Town | 2.7% | 3.0%(-0.305)#99 | 4.5%(-1.80)#15,163 |
| 100. | Hatfield | 2.6% | 3.0%(-0.404)#100 | 4.5%(-1.90)#15,384 |
Common Questions
What are the Top 10 Cities with the Highest Poverty Level Among Married Couples in Massachusetts?
Top 10 Cities with the Highest Poverty Level Among Married Couples in Massachusetts are:
#1
66.7%
#2
22.2%
#3
21.7%
#4
18.4%
#5
14.0%
#6
14.0%
#7
13.4%
#8
12.2%
#9
10.7%
#10
10.6%
What city has the Highest Poverty Level Among Married Couples in Massachusetts?
Siasconset has the Highest Poverty Level Among Married Couples in Massachusetts with 66.7%.
What is the Poverty Level Among Married Couples in the State of Massachusetts?
Poverty Level Among Married Couples in Massachusetts is 3.0%.
What is the Poverty Level Among Married Couples in the United States?
Poverty Level Among Married Couples in the United States is 4.5%.