Cities with the Highest Poverty Level Among Married Couples in Michigan
RELATED REPORTS & OPTIONS
Highest Poverty | Married Couple
Michigan
Compare Cities
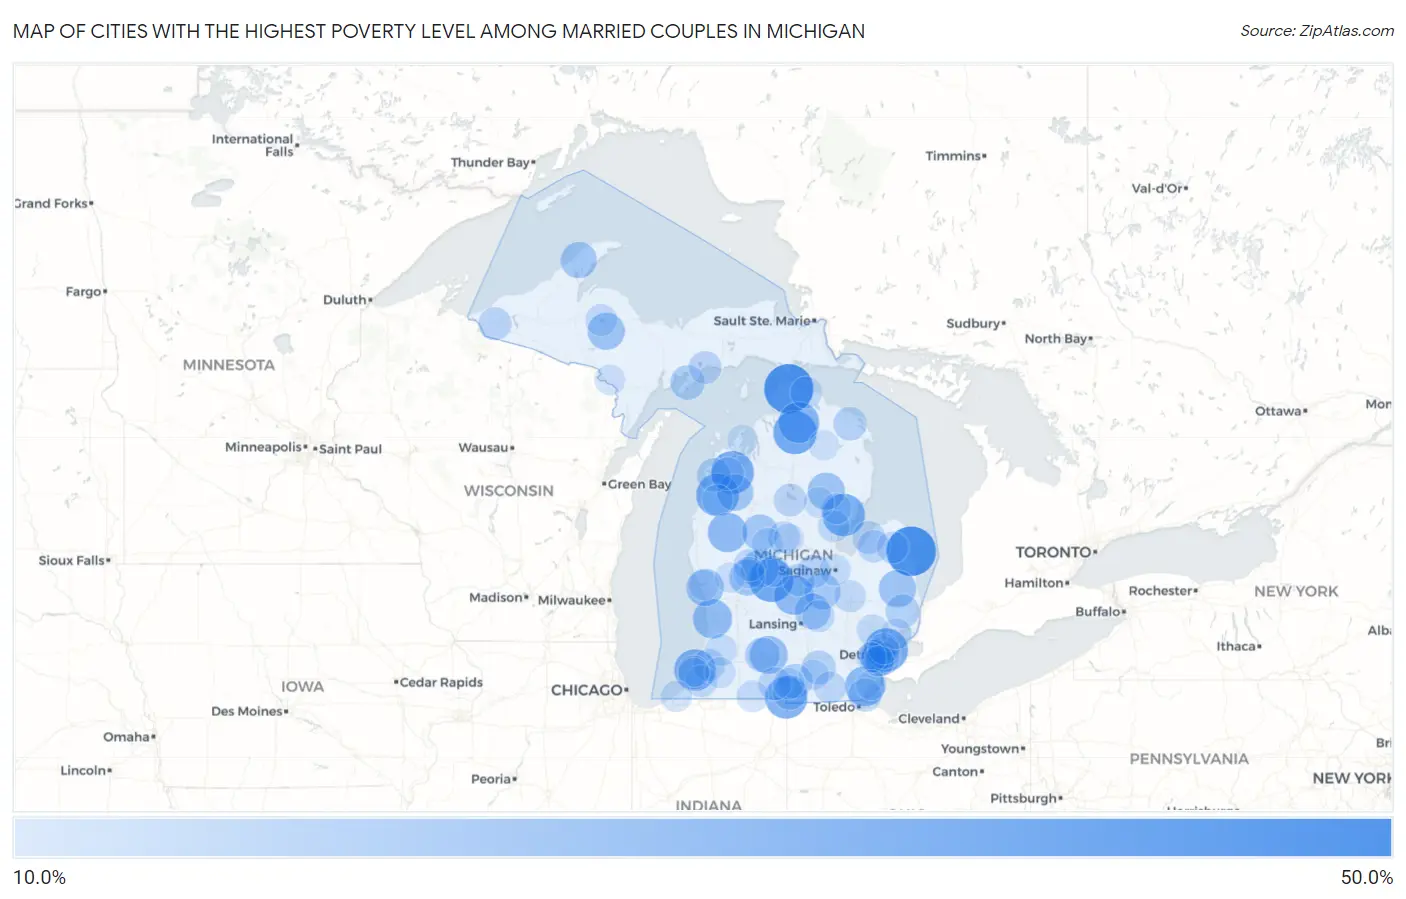
Map of Cities with the Highest Poverty Level Among Married Couples in Michigan
0.0%
50.0%
Cities with the Highest Poverty Level Among Married Couples in Michigan
| City | Married Couples Poverty | vs State | vs National | |
| 1. | Forestville | 40.5% | 4.2%(+36.3)#1 | 4.5%(+36.0)#605 |
| 2. | Carp Lake | 40.0% | 4.2%(+35.8)#2 | 4.5%(+35.5)#616 |
| 3. | Mears | 37.9% | 4.2%(+33.8)#3 | 4.5%(+33.5)#706 |
| 4. | Rockland | 36.4% | 4.2%(+32.2)#4 | 4.5%(+31.9)#757 |
| 5. | Stanton | 31.9% | 4.2%(+27.7)#5 | 4.5%(+27.4)#938 |
| 6. | Vanderbilt | 31.0% | 4.2%(+26.8)#6 | 4.5%(+26.5)#986 |
| 7. | Hamtramck | 30.9% | 4.2%(+26.7)#7 | 4.5%(+26.4)#991 |
| 8. | Interlochen | 30.3% | 4.2%(+26.1)#8 | 4.5%(+25.8)#1,018 |
| 9. | Kaleva | 29.9% | 4.2%(+25.7)#9 | 4.5%(+25.4)#1,038 |
| 10. | Twining | 29.4% | 4.2%(+25.2)#10 | 4.5%(+24.9)#1,063 |
| 11. | Montgomery | 29.3% | 4.2%(+25.1)#11 | 4.5%(+24.8)#1,067 |
| 12. | Benton Heights | 28.0% | 4.2%(+23.9)#12 | 4.5%(+23.6)#1,165 |
| 13. | Elm Hall | 27.6% | 4.2%(+23.4)#13 | 4.5%(+23.1)#1,207 |
| 14. | Wolverine | 27.0% | 4.2%(+22.9)#14 | 4.5%(+22.6)#1,243 |
| 15. | West Monroe | 25.8% | 4.2%(+21.6)#15 | 4.5%(+21.3)#1,352 |
| 16. | Maple Rapids | 25.0% | 4.2%(+20.8)#16 | 4.5%(+20.5)#1,406 |
| 17. | Lake Gogebic | 25.0% | 4.2%(+20.8)#17 | 4.5%(+20.5)#1,439 |
| 18. | Baldwin | 24.7% | 4.2%(+20.5)#18 | 4.5%(+20.2)#1,480 |
| 19. | Beechwood | 24.4% | 4.2%(+20.2)#19 | 4.5%(+19.9)#1,501 |
| 20. | Brownlee Park | 22.6% | 4.2%(+18.4)#20 | 4.5%(+18.1)#1,712 |
| 21. | Cannonsburg | 22.4% | 4.2%(+18.2)#21 | 4.5%(+18.0)#1,732 |
| 22. | Lakeview | 22.1% | 4.2%(+17.9)#22 | 4.5%(+17.6)#1,788 |
| 23. | Muskegon Heights | 21.8% | 4.2%(+17.7)#23 | 4.5%(+17.4)#1,820 |
| 24. | Rose City | 21.4% | 4.2%(+17.3)#24 | 4.5%(+17.0)#1,863 |
| 25. | Melvin | 21.4% | 4.2%(+17.3)#25 | 4.5%(+17.0)#1,868 |
| 26. | Republic | 21.3% | 4.2%(+17.1)#26 | 4.5%(+16.8)#1,878 |
| 27. | Lakeport | 21.0% | 4.2%(+16.9)#27 | 4.5%(+16.6)#1,903 |
| 28. | Mesick | 20.5% | 4.2%(+16.3)#28 | 4.5%(+16.0)#1,988 |
| 29. | Calumet | 20.0% | 4.2%(+15.8)#29 | 4.5%(+15.5)#2,031 |
| 30. | Oakley | 20.0% | 4.2%(+15.8)#30 | 4.5%(+15.5)#2,051 |
| 31. | Pierson | 20.0% | 4.2%(+15.8)#31 | 4.5%(+15.5)#2,061 |
| 32. | Evart | 19.8% | 4.2%(+15.6)#32 | 4.5%(+15.3)#2,103 |
| 33. | Laingsburg | 19.4% | 4.2%(+15.2)#33 | 4.5%(+14.9)#2,152 |
| 34. | Melvindale | 18.1% | 4.2%(+13.9)#34 | 4.5%(+13.6)#2,390 |
| 35. | Springfield | 17.6% | 4.2%(+13.4)#35 | 4.5%(+13.1)#2,490 |
| 36. | Jonesville | 17.6% | 4.2%(+13.4)#36 | 4.5%(+13.1)#2,503 |
| 37. | Dearborn | 17.6% | 4.2%(+13.4)#37 | 4.5%(+13.1)#2,504 |
| 38. | Reading | 17.5% | 4.2%(+13.3)#38 | 4.5%(+13.0)#2,521 |
| 39. | Garden | 17.4% | 4.2%(+13.2)#39 | 4.5%(+12.9)#2,534 |
| 40. | Napoleon | 16.4% | 4.2%(+12.2)#40 | 4.5%(+11.9)#2,746 |
| 41. | Memphis | 16.3% | 4.2%(+12.1)#41 | 4.5%(+11.8)#2,780 |
| 42. | Benzonia | 16.2% | 4.2%(+12.1)#42 | 4.5%(+11.8)#2,782 |
| 43. | River Rouge | 16.1% | 4.2%(+12.0)#43 | 4.5%(+11.7)#2,811 |
| 44. | Posen | 15.8% | 4.2%(+11.6)#44 | 4.5%(+11.3)#2,892 |
| 45. | Luna Pier | 15.4% | 4.2%(+11.2)#45 | 4.5%(+10.9)#3,010 |
| 46. | Merrill | 15.3% | 4.2%(+11.2)#46 | 4.5%(+10.9)#3,012 |
| 47. | Dearborn Heights | 15.1% | 4.2%(+10.9)#47 | 4.5%(+10.7)#3,058 |
| 48. | Wakefield | 15.1% | 4.2%(+10.9)#48 | 4.5%(+10.6)#3,061 |
| 49. | Coldwater | 15.1% | 4.2%(+10.9)#49 | 4.5%(+10.6)#3,063 |
| 50. | Bay Port | 15.0% | 4.2%(+10.8)#50 | 4.5%(+10.5)#3,084 |
| 51. | Houghton Lake | 14.9% | 4.2%(+10.8)#51 | 4.5%(+10.5)#3,101 |
| 52. | Bendon | 14.9% | 4.2%(+10.8)#52 | 4.5%(+10.5)#3,106 |
| 53. | Manistique | 14.9% | 4.2%(+10.7)#53 | 4.5%(+10.4)#3,112 |
| 54. | Cambria | 14.6% | 4.2%(+10.5)#54 | 4.5%(+10.2)#3,194 |
| 55. | Ithaca | 14.5% | 4.2%(+10.3)#55 | 4.5%(+10.0)#3,232 |
| 56. | Detroit | 14.4% | 4.2%(+10.2)#56 | 4.5%(+9.94)#3,259 |
| 57. | Morley | 14.3% | 4.2%(+10.1)#57 | 4.5%(+9.82)#3,284 |
| 58. | Owendale | 14.3% | 4.2%(+10.1)#58 | 4.5%(+9.82)#3,300 |
| 59. | Farwell | 14.2% | 4.2%(+9.99)#59 | 4.5%(+9.69)#3,361 |
| 60. | Hartford | 14.1% | 4.2%(+9.90)#60 | 4.5%(+9.60)#3,381 |
| 61. | Adrian | 13.8% | 4.2%(+9.67)#61 | 4.5%(+9.38)#3,444 |
| 62. | Cheboygan | 13.6% | 4.2%(+9.40)#62 | 4.5%(+9.10)#3,530 |
| 63. | Beecher | 13.5% | 4.2%(+9.38)#63 | 4.5%(+9.09)#3,540 |
| 64. | Eau Claire | 13.5% | 4.2%(+9.32)#64 | 4.5%(+9.02)#3,570 |
| 65. | Michigamme | 13.5% | 4.2%(+9.30)#65 | 4.5%(+9.00)#3,579 |
| 66. | Ubly | 13.4% | 4.2%(+9.21)#66 | 4.5%(+8.91)#3,600 |
| 67. | Standish | 13.3% | 4.2%(+9.13)#67 | 4.5%(+8.83)#3,646 |
| 68. | Perry | 13.3% | 4.2%(+9.12)#68 | 4.5%(+8.82)#3,649 |
| 69. | Ewen | 13.3% | 4.2%(+9.09)#69 | 4.5%(+8.79)#3,653 |
| 70. | Sturgis | 13.1% | 4.2%(+8.94)#70 | 4.5%(+8.64)#3,705 |
| 71. | Fair Plain | 12.9% | 4.2%(+8.69)#71 | 4.5%(+8.40)#3,806 |
| 72. | Tower | 12.9% | 4.2%(+8.69)#72 | 4.5%(+8.40)#3,809 |
| 73. | Bloomingdale | 12.8% | 4.2%(+8.66)#73 | 4.5%(+8.36)#3,822 |
| 74. | Pontiac | 12.8% | 4.2%(+8.65)#74 | 4.5%(+8.35)#3,830 |
| 75. | Barryton | 12.7% | 4.2%(+8.53)#75 | 4.5%(+8.24)#3,854 |
| 76. | Edmore | 12.7% | 4.2%(+8.51)#76 | 4.5%(+8.21)#3,865 |
| 77. | Howard City | 12.6% | 4.2%(+8.43)#77 | 4.5%(+8.13)#3,890 |
| 78. | Benton Harbor | 12.5% | 4.2%(+8.38)#78 | 4.5%(+8.09)#3,906 |
| 79. | New Buffalo | 12.5% | 4.2%(+8.38)#79 | 4.5%(+8.08)#3,908 |
| 80. | Saginaw | 12.5% | 4.2%(+8.37)#80 | 4.5%(+8.07)#3,911 |
| 81. | Allen | 12.5% | 4.2%(+8.34)#81 | 4.5%(+8.04)#3,941 |
| 82. | Brethren | 12.2% | 4.2%(+8.00)#82 | 4.5%(+7.70)#4,090 |
| 83. | Prescott | 12.1% | 4.2%(+7.96)#83 | 4.5%(+7.66)#4,117 |
| 84. | Highland Park | 12.0% | 4.2%(+7.83)#84 | 4.5%(+7.53)#4,186 |
| 85. | Mount Clemens | 12.0% | 4.2%(+7.83)#85 | 4.5%(+7.53)#4,187 |
| 86. | Decatur | 11.9% | 4.2%(+7.71)#86 | 4.5%(+7.42)#4,227 |
| 87. | Mohawk | 11.9% | 4.2%(+7.70)#87 | 4.5%(+7.40)#4,238 |
| 88. | West Branch | 11.7% | 4.2%(+7.53)#88 | 4.5%(+7.23)#4,320 |
| 89. | Naubinway | 11.5% | 4.2%(+7.37)#89 | 4.5%(+7.08)#4,395 |
| 90. | Pittsford | 11.5% | 4.2%(+7.31)#90 | 4.5%(+7.01)#4,415 |
| 91. | Norway | 11.4% | 4.2%(+7.25)#91 | 4.5%(+6.95)#4,442 |
| 92. | Clare | 11.4% | 4.2%(+7.25)#92 | 4.5%(+6.95)#4,444 |
| 93. | Omena | 11.4% | 4.2%(+7.20)#93 | 4.5%(+6.90)#4,460 |
| 94. | Muskegon | 11.3% | 4.2%(+7.13)#94 | 4.5%(+6.83)#4,494 |
| 95. | Grant | 11.3% | 4.2%(+7.09)#95 | 4.5%(+6.79)#4,511 |
| 96. | Cement City | 11.3% | 4.2%(+7.09)#96 | 4.5%(+6.79)#4,513 |
| 97. | Lincoln Park | 11.2% | 4.2%(+7.06)#97 | 4.5%(+6.77)#4,521 |
| 98. | Atlanta | 11.1% | 4.2%(+6.95)#98 | 4.5%(+6.65)#4,565 |
| 99. | Inkster | 10.9% | 4.2%(+6.78)#99 | 4.5%(+6.48)#4,682 |
| 100. | Woodland Beach | 10.9% | 4.2%(+6.76)#100 | 4.5%(+6.46)#4,698 |
Common Questions
What are the Top 10 Cities with the Highest Poverty Level Among Married Couples in Michigan?
Top 10 Cities with the Highest Poverty Level Among Married Couples in Michigan are:
#1
40.5%
#2
40.0%
#3
31.9%
#4
31.0%
#5
30.9%
#6
30.3%
#7
29.9%
#8
29.4%
#9
29.3%
#10
28.0%
What city has the Highest Poverty Level Among Married Couples in Michigan?
Forestville has the Highest Poverty Level Among Married Couples in Michigan with 40.5%.
What is the Poverty Level Among Married Couples in the State of Michigan?
Poverty Level Among Married Couples in Michigan is 4.2%.
What is the Poverty Level Among Married Couples in the United States?
Poverty Level Among Married Couples in the United States is 4.5%.