Cities with the Highest Poverty Level Among Married Couples in Utah
RELATED REPORTS & OPTIONS
Highest Poverty | Married Couple
Utah
Compare Cities
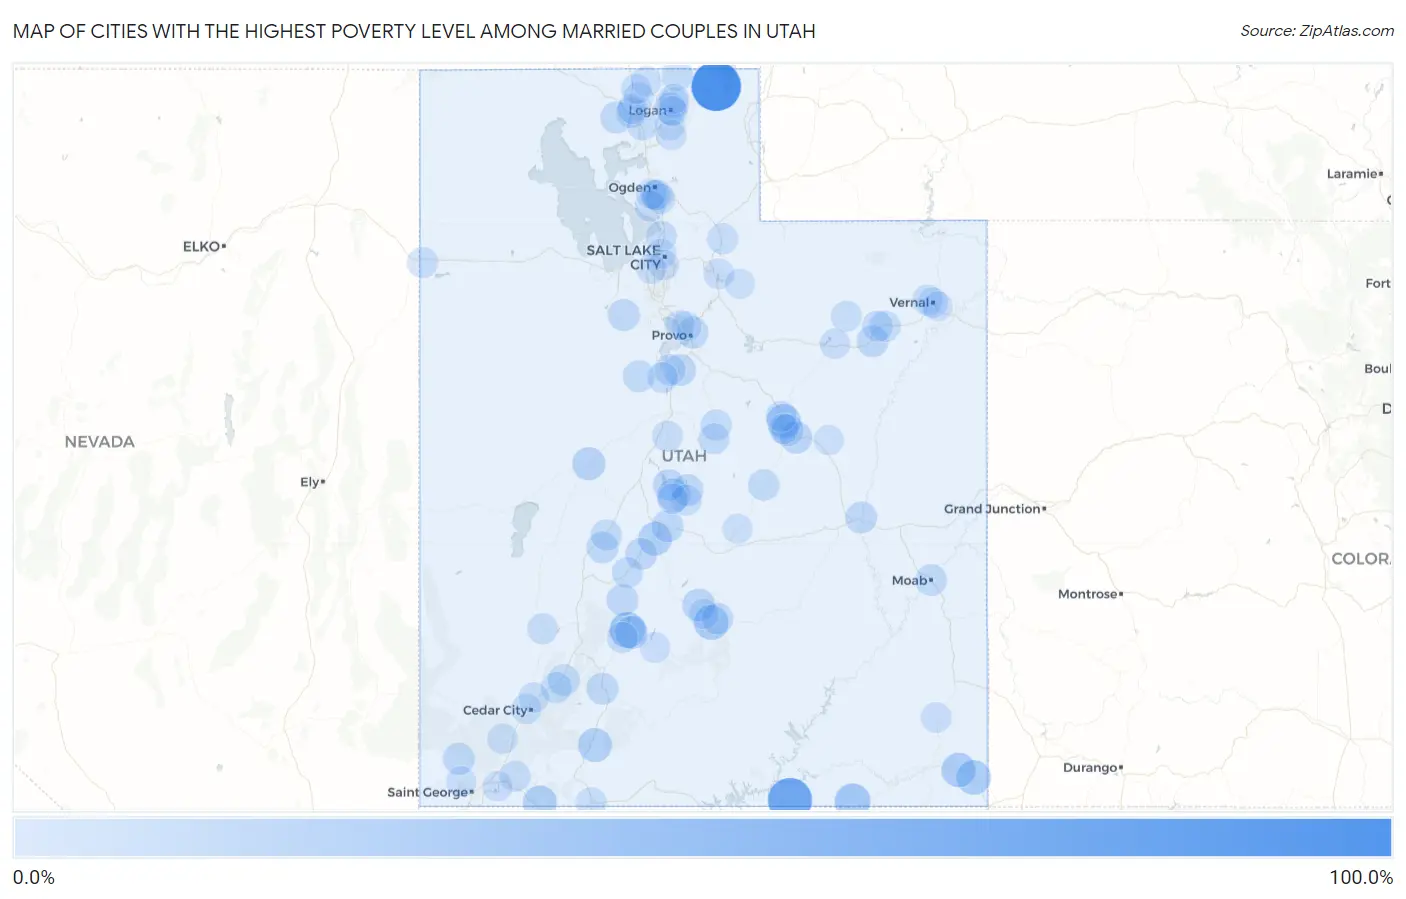
Map of Cities with the Highest Poverty Level Among Married Couples in Utah
0.0%
100.0%
Cities with the Highest Poverty Level Among Married Couples in Utah
| City | Married Couples Poverty | vs State | vs National | |
| 1. | Garden | 100.0% | 3.8%(+96.2)#1 | 4.5%(+95.5)#47 |
| 2. | Navajo Mountain | 72.7% | 3.8%(+69.0)#2 | 4.5%(+68.3)#157 |
| 3. | Junction | 31.4% | 3.8%(+27.7)#3 | 4.5%(+27.0)#958 |
| 4. | Oljato Monument Valley | 30.9% | 3.8%(+27.2)#4 | 4.5%(+26.4)#988 |
| 5. | Teasdale | 25.9% | 3.8%(+22.2)#5 | 4.5%(+21.5)#1,339 |
| 6. | Aneth | 25.0% | 3.8%(+21.2)#6 | 4.5%(+20.5)#1,416 |
| 7. | Montezuma Creek | 25.0% | 3.8%(+21.2)#7 | 4.5%(+20.5)#1,419 |
| 8. | Spring Glen | 24.3% | 3.8%(+20.5)#8 | 4.5%(+19.8)#1,520 |
| 9. | Alton | 22.4% | 3.8%(+18.7)#9 | 4.5%(+18.0)#1,728 |
| 10. | Hildale | 22.1% | 3.8%(+18.3)#10 | 4.5%(+17.6)#1,790 |
| 11. | Sigurd | 21.7% | 3.8%(+18.0)#11 | 4.5%(+17.3)#1,830 |
| 12. | Gunnison | 18.8% | 3.8%(+15.0)#12 | 4.5%(+14.3)#2,245 |
| 13. | Delta | 18.7% | 3.8%(+14.9)#13 | 4.5%(+14.2)#2,275 |
| 14. | Kingston | 17.2% | 3.8%(+13.4)#14 | 4.5%(+12.7)#2,578 |
| 15. | Lyman | 16.4% | 3.8%(+12.6)#15 | 4.5%(+11.9)#2,749 |
| 16. | Wellington | 14.7% | 3.8%(+10.9)#16 | 4.5%(+10.2)#3,175 |
| 17. | Price | 13.5% | 3.8%(+9.78)#17 | 4.5%(+9.07)#3,545 |
| 18. | Ophir | 13.3% | 3.8%(+9.58)#18 | 4.5%(+8.87)#3,639 |
| 19. | Provo | 13.1% | 3.8%(+9.38)#19 | 4.5%(+8.67)#3,690 |
| 20. | Spring Lake | 13.0% | 3.8%(+9.29)#20 | 4.5%(+8.58)#3,728 |
| 21. | Thatcher | 13.0% | 3.8%(+9.27)#21 | 4.5%(+8.56)#3,746 |
| 22. | Marysvale | 13.0% | 3.8%(+9.23)#22 | 4.5%(+8.53)#3,759 |
| 23. | Salina | 12.9% | 3.8%(+9.15)#23 | 4.5%(+8.44)#3,774 |
| 24. | Veyo | 12.9% | 3.8%(+9.13)#24 | 4.5%(+8.42)#3,798 |
| 25. | Myton | 12.8% | 3.8%(+9.01)#25 | 4.5%(+8.30)#3,843 |
| 26. | Sterling | 12.5% | 3.8%(+8.75)#26 | 4.5%(+8.04)#3,931 |
| 27. | Kanosh | 12.4% | 3.8%(+8.64)#27 | 4.5%(+7.93)#4,006 |
| 28. | Panguitch | 12.4% | 3.8%(+8.61)#28 | 4.5%(+7.90)#4,010 |
| 29. | Logan | 12.1% | 3.8%(+8.36)#29 | 4.5%(+7.65)#4,124 |
| 30. | Richfield | 12.1% | 3.8%(+8.34)#30 | 4.5%(+7.63)#4,129 |
| 31. | Fayette | 11.9% | 3.8%(+8.19)#31 | 4.5%(+7.48)#4,206 |
| 32. | Green River | 11.9% | 3.8%(+8.11)#32 | 4.5%(+7.40)#4,232 |
| 33. | Eureka | 11.6% | 3.8%(+7.89)#33 | 4.5%(+7.18)#4,340 |
| 34. | Moab | 11.0% | 3.8%(+7.25)#34 | 4.5%(+6.54)#4,644 |
| 35. | Paragonah | 10.9% | 3.8%(+7.12)#35 | 4.5%(+6.41)#4,729 |
| 36. | Torrey | 10.7% | 3.8%(+6.96)#36 | 4.5%(+6.25)#4,808 |
| 37. | Castle Dale | 10.7% | 3.8%(+6.91)#37 | 4.5%(+6.20)#4,836 |
| 38. | Brighton | 10.6% | 3.8%(+6.84)#38 | 4.5%(+6.13)#4,893 |
| 39. | Meadow | 9.7% | 3.8%(+5.93)#39 | 4.5%(+5.22)#5,467 |
| 40. | Genola | 9.5% | 3.8%(+5.76)#40 | 4.5%(+5.05)#5,577 |
| 41. | Parowan | 9.3% | 3.8%(+5.52)#41 | 4.5%(+4.81)#5,736 |
| 42. | Cove | 9.3% | 3.8%(+5.51)#42 | 4.5%(+4.80)#5,747 |
| 43. | Ballard | 9.2% | 3.8%(+5.48)#43 | 4.5%(+4.77)#5,773 |
| 44. | Tremonton | 9.1% | 3.8%(+5.36)#44 | 4.5%(+4.65)#5,860 |
| 45. | Joseph | 8.9% | 3.8%(+5.16)#45 | 4.5%(+4.45)#6,035 |
| 46. | Fairview | 8.8% | 3.8%(+5.07)#46 | 4.5%(+4.36)#6,101 |
| 47. | Mount Pleasant | 8.8% | 3.8%(+5.04)#47 | 4.5%(+4.33)#6,134 |
| 48. | Mayfield | 8.4% | 3.8%(+4.66)#48 | 4.5%(+3.95)#6,389 |
| 49. | Wendover | 8.4% | 3.8%(+4.64)#49 | 4.5%(+3.93)#6,402 |
| 50. | Roosevelt | 8.3% | 3.8%(+4.50)#50 | 4.5%(+3.79)#6,535 |
| 51. | West Bountiful | 8.2% | 3.8%(+4.40)#51 | 4.5%(+3.69)#6,619 |
| 52. | Hoytsville | 8.1% | 3.8%(+4.34)#52 | 4.5%(+3.63)#6,675 |
| 53. | Levan | 8.1% | 3.8%(+4.32)#53 | 4.5%(+3.61)#6,693 |
| 54. | Circleville | 8.0% | 3.8%(+4.20)#54 | 4.5%(+3.49)#6,788 |
| 55. | Virgin | 7.8% | 3.8%(+4.04)#55 | 4.5%(+3.33)#6,933 |
| 56. | Goshen | 7.7% | 3.8%(+3.94)#56 | 4.5%(+3.23)#7,030 |
| 57. | Minersville | 7.6% | 3.8%(+3.83)#57 | 4.5%(+3.12)#7,141 |
| 58. | Altamont | 7.6% | 3.8%(+3.82)#58 | 4.5%(+3.11)#7,148 |
| 59. | Honeyville | 7.4% | 3.8%(+3.67)#59 | 4.5%(+2.96)#7,297 |
| 60. | South Ogden | 7.2% | 3.8%(+3.48)#60 | 4.5%(+2.77)#7,499 |
| 61. | Kanab | 7.1% | 3.8%(+3.40)#61 | 4.5%(+2.69)#7,562 |
| 62. | Helper | 7.1% | 3.8%(+3.36)#62 | 4.5%(+2.65)#7,645 |
| 63. | Maeser | 7.0% | 3.8%(+3.22)#63 | 4.5%(+2.51)#7,809 |
| 64. | Clearfield | 6.9% | 3.8%(+3.17)#64 | 4.5%(+2.46)#7,846 |
| 65. | Antimony | 6.9% | 3.8%(+3.14)#65 | 4.5%(+2.43)#7,892 |
| 66. | Centerfield | 6.9% | 3.8%(+3.12)#66 | 4.5%(+2.41)#7,912 |
| 67. | Hideout | 6.8% | 3.8%(+3.04)#67 | 4.5%(+2.33)#7,994 |
| 68. | Duchesne | 6.7% | 3.8%(+2.96)#68 | 4.5%(+2.25)#8,081 |
| 69. | Blanding | 6.7% | 3.8%(+2.95)#69 | 4.5%(+2.24)#8,087 |
| 70. | South Salt Lake | 6.5% | 3.8%(+2.73)#70 | 4.5%(+2.02)#8,352 |
| 71. | Uintah | 6.2% | 3.8%(+2.46)#71 | 4.5%(+1.75)#8,701 |
| 72. | Hurricane | 6.1% | 3.8%(+2.40)#72 | 4.5%(+1.69)#8,784 |
| 73. | Cedar City | 5.9% | 3.8%(+2.17)#73 | 4.5%(+1.46)#9,053 |
| 74. | New Harmony | 5.9% | 3.8%(+2.13)#74 | 4.5%(+1.42)#9,124 |
| 75. | Enoch | 5.8% | 3.8%(+2.05)#75 | 4.5%(+1.34)#9,239 |
| 76. | West Wood | 5.6% | 3.8%(+1.90)#76 | 4.5%(+1.19)#9,447 |
| 77. | Vernal | 5.6% | 3.8%(+1.85)#77 | 4.5%(+1.14)#9,499 |
| 78. | White | 5.6% | 3.8%(+1.81)#78 | 4.5%(+1.10)#9,550 |
| 79. | Garland | 5.5% | 3.8%(+1.77)#79 | 4.5%(+1.06)#9,637 |
| 80. | Ivins | 5.5% | 3.8%(+1.77)#80 | 4.5%(+1.06)#9,639 |
| 81. | Riverdale | 5.5% | 3.8%(+1.74)#81 | 4.5%(+1.03)#9,678 |
| 82. | Fielding | 5.4% | 3.8%(+1.67)#82 | 4.5%(+0.964)#9,763 |
| 83. | Orem | 5.4% | 3.8%(+1.64)#83 | 4.5%(+0.931)#9,839 |
| 84. | North Logan | 5.4% | 3.8%(+1.60)#84 | 4.5%(+0.893)#9,901 |
| 85. | Clarkston | 5.3% | 3.8%(+1.58)#85 | 4.5%(+0.871)#9,930 |
| 86. | Hyrum | 5.3% | 3.8%(+1.54)#86 | 4.5%(+0.828)#10,000 |
| 87. | Plymouth | 5.3% | 3.8%(+1.51)#87 | 4.5%(+0.801)#10,048 |
| 88. | Washington Terrace | 5.1% | 3.8%(+1.37)#88 | 4.5%(+0.663)#10,256 |
| 89. | East Basin | 5.0% | 3.8%(+1.29)#89 | 4.5%(+0.577)#10,370 |
| 90. | Hyde Park | 5.0% | 3.8%(+1.27)#90 | 4.5%(+0.560)#10,390 |
| 91. | Paradise | 5.0% | 3.8%(+1.25)#91 | 4.5%(+0.538)#10,429 |
| 92. | Bicknell | 5.0% | 3.8%(+1.21)#92 | 4.5%(+0.497)#10,520 |
| 93. | River Heights | 5.0% | 3.8%(+1.20)#93 | 4.5%(+0.490)#10,530 |
| 94. | Salt Lake City | 4.8% | 3.8%(+1.09)#94 | 4.5%(+0.379)#10,690 |
| 95. | Vineyard | 4.8% | 3.8%(+1.07)#95 | 4.5%(+0.362)#10,721 |
| 96. | Woodland | 4.7% | 3.8%(+0.972)#96 | 4.5%(+0.262)#10,883 |
| 97. | Emery | 4.7% | 3.8%(+0.935)#97 | 4.5%(+0.226)#10,940 |
| 98. | East Carbon | 4.7% | 3.8%(+0.926)#98 | 4.5%(+0.216)#10,949 |
| 99. | West Valley City | 4.7% | 3.8%(+0.906)#99 | 4.5%(+0.196)#10,985 |
| 100. | Naples | 4.7% | 3.8%(+0.903)#100 | 4.5%(+0.193)#10,989 |
Common Questions
What are the Top 10 Cities with the Highest Poverty Level Among Married Couples in Utah?
Top 10 Cities with the Highest Poverty Level Among Married Couples in Utah are:
#1
100.0%
#2
72.7%
#3
31.4%
#4
30.9%
#5
25.9%
#6
25.0%
#7
25.0%
#8
24.3%
#9
22.4%
#10
22.1%
What city has the Highest Poverty Level Among Married Couples in Utah?
Garden has the Highest Poverty Level Among Married Couples in Utah with 100.0%.
What is the Poverty Level Among Married Couples in the State of Utah?
Poverty Level Among Married Couples in Utah is 3.8%.
What is the Poverty Level Among Married Couples in the United States?
Poverty Level Among Married Couples in the United States is 4.5%.