Cities with the Highest Poverty Level Among Married Couples in West Virginia
RELATED REPORTS & OPTIONS
Highest Poverty | Married Couple
West Virginia
Compare Cities
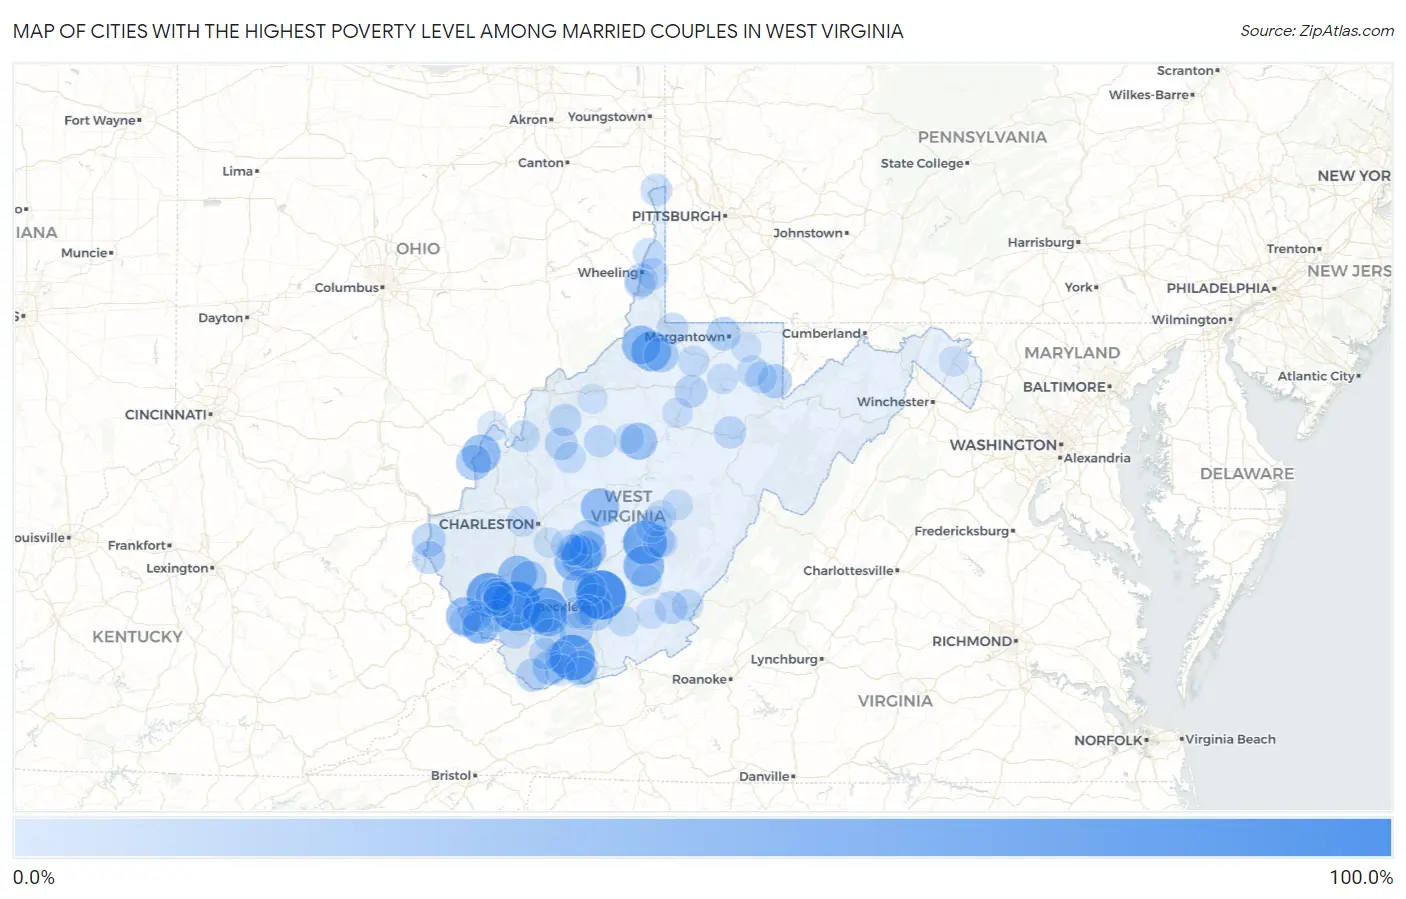
Map of Cities with the Highest Poverty Level Among Married Couples in West Virginia
0.0%
100.0%
Cities with the Highest Poverty Level Among Married Couples in West Virginia
| City | Married Couples Poverty | vs State | vs National | |
| 1. | Raleigh | 100.0% | 6.6%(+93.4)#1 | 4.5%(+95.5)#23 |
| 2. | Amherstdale | 100.0% | 6.6%(+93.4)#2 | 4.5%(+95.5)#78 |
| 3. | Prince | 100.0% | 6.6%(+93.4)#3 | 4.5%(+95.5)#83 |
| 4. | Crumpler | 80.0% | 6.6%(+73.4)#4 | 4.5%(+75.5)#128 |
| 5. | Kopperston | 77.9% | 6.6%(+71.3)#5 | 4.5%(+73.4)#139 |
| 6. | Verdunville | 75.0% | 6.6%(+68.4)#6 | 4.5%(+70.5)#146 |
| 7. | Nettie | 73.0% | 6.6%(+66.4)#7 | 4.5%(+68.5)#155 |
| 8. | Raymond | 72.7% | 6.6%(+66.1)#8 | 4.5%(+68.3)#159 |
| 9. | Hansford | 61.9% | 6.6%(+55.3)#9 | 4.5%(+57.4)#236 |
| 10. | Quinwood | 58.8% | 6.6%(+52.2)#10 | 4.5%(+54.4)#282 |
| 11. | Deep Water | 58.6% | 6.6%(+52.0)#11 | 4.5%(+54.2)#285 |
| 12. | Jacksonburg | 53.8% | 6.6%(+47.3)#12 | 4.5%(+49.4)#337 |
| 13. | Greenview | 50.0% | 6.6%(+43.4)#13 | 4.5%(+45.5)#380 |
| 14. | Powellton | 49.4% | 6.6%(+42.8)#14 | 4.5%(+44.9)#407 |
| 15. | Reader | 49.0% | 6.6%(+42.4)#15 | 4.5%(+44.5)#410 |
| 16. | Clay | 48.1% | 6.6%(+41.6)#16 | 4.5%(+43.7)#423 |
| 17. | Henderson | 47.5% | 6.6%(+40.9)#17 | 4.5%(+43.0)#434 |
| 18. | Chattaroy | 46.7% | 6.6%(+40.1)#18 | 4.5%(+42.2)#451 |
| 19. | Glen Fork | 45.0% | 6.6%(+38.4)#19 | 4.5%(+40.5)#491 |
| 20. | Red Jacket | 44.2% | 6.6%(+37.6)#20 | 4.5%(+39.7)#507 |
| 21. | Gauley Bridge | 44.2% | 6.6%(+37.6)#21 | 4.5%(+39.7)#508 |
| 22. | Sand Fork | 41.7% | 6.6%(+35.1)#22 | 4.5%(+37.2)#579 |
| 23. | Mount Gay Shamrock | 38.4% | 6.6%(+31.8)#23 | 4.5%(+33.9)#690 |
| 24. | Van | 36.8% | 6.6%(+30.3)#24 | 4.5%(+32.4)#743 |
| 25. | Dorothy | 34.8% | 6.6%(+28.2)#25 | 4.5%(+30.3)#814 |
| 26. | Gallipolis Ferry | 34.5% | 6.6%(+27.9)#26 | 4.5%(+30.1)#823 |
| 27. | Pax | 33.3% | 6.6%(+26.7)#27 | 4.5%(+28.9)#887 |
| 28. | Gary | 31.8% | 6.6%(+25.2)#28 | 4.5%(+27.4)#940 |
| 29. | Smithfield | 31.8% | 6.6%(+25.2)#29 | 4.5%(+27.4)#943 |
| 30. | Dixie | 31.2% | 6.6%(+24.7)#30 | 4.5%(+26.8)#969 |
| 31. | Stanaford | 30.6% | 6.6%(+24.0)#31 | 4.5%(+26.1)#1,006 |
| 32. | Montcalm | 28.4% | 6.6%(+21.9)#32 | 4.5%(+24.0)#1,127 |
| 33. | Aurora | 28.1% | 6.6%(+21.5)#33 | 4.5%(+23.7)#1,152 |
| 34. | Daniels | 28.1% | 6.6%(+21.5)#34 | 4.5%(+23.6)#1,158 |
| 35. | Rhodell | 28.0% | 6.6%(+21.4)#35 | 4.5%(+23.5)#1,172 |
| 36. | Mcconnell | 27.7% | 6.6%(+21.2)#36 | 4.5%(+23.3)#1,190 |
| 37. | Prichard | 26.8% | 6.6%(+20.2)#37 | 4.5%(+22.3)#1,262 |
| 38. | Granville | 26.7% | 6.6%(+20.1)#38 | 4.5%(+22.3)#1,264 |
| 39. | Sprague | 25.9% | 6.6%(+19.3)#39 | 4.5%(+21.5)#1,336 |
| 40. | Benwood | 24.4% | 6.6%(+17.8)#40 | 4.5%(+19.9)#1,502 |
| 41. | Fort Gay | 24.2% | 6.6%(+17.6)#41 | 4.5%(+19.7)#1,527 |
| 42. | War | 24.1% | 6.6%(+17.5)#42 | 4.5%(+19.7)#1,538 |
| 43. | Northfork | 23.1% | 6.6%(+16.5)#43 | 4.5%(+18.6)#1,650 |
| 44. | Fairlea | 22.7% | 6.6%(+16.1)#44 | 4.5%(+18.3)#1,695 |
| 45. | Anmoore | 22.4% | 6.6%(+15.8)#45 | 4.5%(+18.0)#1,729 |
| 46. | Smithers | 22.4% | 6.6%(+15.8)#46 | 4.5%(+17.9)#1,733 |
| 47. | Crooked Creek | 22.2% | 6.6%(+15.6)#47 | 4.5%(+17.8)#1,750 |
| 48. | Reedy | 21.9% | 6.6%(+15.3)#48 | 4.5%(+17.4)#1,815 |
| 49. | Pineville | 21.6% | 6.6%(+15.0)#49 | 4.5%(+17.1)#1,847 |
| 50. | Elizabeth | 21.4% | 6.6%(+14.8)#50 | 4.5%(+17.0)#1,862 |
| 51. | Justice | 20.7% | 6.6%(+14.1)#51 | 4.5%(+16.3)#1,941 |
| 52. | Junior | 20.7% | 6.6%(+14.1)#52 | 4.5%(+16.2)#1,944 |
| 53. | Accoville | 20.3% | 6.6%(+13.7)#53 | 4.5%(+15.8)#2,006 |
| 54. | Sarah Ann | 20.0% | 6.6%(+13.4)#54 | 4.5%(+15.5)#2,047 |
| 55. | Fenwick | 20.0% | 6.6%(+13.4)#55 | 4.5%(+15.5)#2,068 |
| 56. | Mount Hope | 19.6% | 6.6%(+13.0)#56 | 4.5%(+15.1)#2,126 |
| 57. | Newell | 19.4% | 6.6%(+12.8)#57 | 4.5%(+14.9)#2,153 |
| 58. | Grantsville | 19.4% | 6.6%(+12.8)#58 | 4.5%(+14.9)#2,162 |
| 59. | Lester | 18.8% | 6.6%(+12.2)#59 | 4.5%(+14.3)#2,251 |
| 60. | Anawalt | 18.4% | 6.6%(+11.8)#60 | 4.5%(+14.0)#2,325 |
| 61. | Hundred | 18.4% | 6.6%(+11.8)#61 | 4.5%(+13.9)#2,327 |
| 62. | Triadelphia | 18.3% | 6.6%(+11.7)#62 | 4.5%(+13.8)#2,342 |
| 63. | Rowlesburg | 18.2% | 6.6%(+11.6)#63 | 4.5%(+13.7)#2,356 |
| 64. | Oceana | 18.0% | 6.6%(+11.5)#64 | 4.5%(+13.6)#2,399 |
| 65. | White Sulphur Springs | 18.0% | 6.6%(+11.4)#65 | 4.5%(+13.6)#2,401 |
| 66. | Welch | 17.9% | 6.6%(+11.3)#66 | 4.5%(+13.4)#2,435 |
| 67. | West Logan | 17.8% | 6.6%(+11.2)#67 | 4.5%(+13.3)#2,453 |
| 68. | Ravenswood | 17.8% | 6.6%(+11.2)#68 | 4.5%(+13.3)#2,463 |
| 69. | Williamson | 17.6% | 6.6%(+11.1)#69 | 4.5%(+13.2)#2,474 |
| 70. | Tunnelton | 17.2% | 6.6%(+10.6)#70 | 4.5%(+12.7)#2,573 |
| 71. | Spencer | 17.0% | 6.6%(+10.4)#71 | 4.5%(+12.5)#2,614 |
| 72. | Windsor Heights | 16.9% | 6.6%(+10.3)#72 | 4.5%(+12.4)#2,649 |
| 73. | Worthington | 15.8% | 6.6%(+9.21)#73 | 4.5%(+11.3)#2,903 |
| 74. | Matewan | 15.7% | 6.6%(+9.15)#74 | 4.5%(+11.3)#2,916 |
| 75. | Delbarton | 15.5% | 6.6%(+8.88)#75 | 4.5%(+11.0)#2,976 |
| 76. | Rupert | 15.0% | 6.6%(+8.38)#76 | 4.5%(+10.5)#3,093 |
| 77. | Hinton | 14.9% | 6.6%(+8.35)#77 | 4.5%(+10.5)#3,099 |
| 78. | Montgomery | 14.7% | 6.6%(+8.09)#78 | 4.5%(+10.2)#3,179 |
| 79. | Bluewell | 14.5% | 6.6%(+7.88)#79 | 4.5%(+10.0)#3,242 |
| 80. | Grafton | 14.2% | 6.6%(+7.66)#80 | 4.5%(+9.79)#3,341 |
| 81. | Mcmechen | 14.0% | 6.6%(+7.44)#81 | 4.5%(+9.57)#3,395 |
| 82. | Richwood | 13.9% | 6.6%(+7.27)#82 | 4.5%(+9.40)#3,438 |
| 83. | Craigsville | 13.5% | 6.6%(+6.90)#83 | 4.5%(+9.02)#3,568 |
| 84. | Pratt | 13.5% | 6.6%(+6.90)#84 | 4.5%(+9.02)#3,571 |
| 85. | Monaville | 13.5% | 6.6%(+6.88)#85 | 4.5%(+9.00)#3,575 |
| 86. | Addison Webster Springs | 13.3% | 6.6%(+6.75)#86 | 4.5%(+8.87)#3,610 |
| 87. | Jane Lew | 13.1% | 6.6%(+6.49)#87 | 4.5%(+8.62)#3,717 |
| 88. | Jefferson | 13.0% | 6.6%(+6.46)#88 | 4.5%(+8.58)#3,726 |
| 89. | Camden On Gauley | 13.0% | 6.6%(+6.46)#89 | 4.5%(+8.58)#3,740 |
| 90. | Cowen | 12.8% | 6.6%(+6.24)#90 | 4.5%(+8.36)#3,821 |
| 91. | Logan | 12.8% | 6.6%(+6.21)#91 | 4.5%(+8.33)#3,836 |
| 92. | Glenville | 12.7% | 6.6%(+6.07)#92 | 4.5%(+8.20)#3,868 |
| 93. | Alderson | 12.4% | 6.6%(+5.81)#93 | 4.5%(+7.93)#4,005 |
| 94. | Mason | 12.3% | 6.6%(+5.76)#94 | 4.5%(+7.88)#4,018 |
| 95. | Macarthur | 12.2% | 6.6%(+5.63)#95 | 4.5%(+7.76)#4,064 |
| 96. | Martinsburg | 12.1% | 6.6%(+5.56)#96 | 4.5%(+7.68)#4,100 |
| 97. | Sophia | 11.5% | 6.6%(+4.90)#97 | 4.5%(+7.02)#4,412 |
| 98. | Chesapeake | 11.4% | 6.6%(+4.85)#98 | 4.5%(+6.98)#4,426 |
| 99. | Masontown | 11.0% | 6.6%(+4.40)#99 | 4.5%(+6.53)#4,657 |
| 100. | Cairo | 10.5% | 6.6%(+3.94)#100 | 4.5%(+6.06)#4,929 |
Common Questions
What are the Top 10 Cities with the Highest Poverty Level Among Married Couples in West Virginia?
Top 10 Cities with the Highest Poverty Level Among Married Couples in West Virginia are:
#1
100.0%
#2
100.0%
#3
80.0%
#4
77.9%
#5
75.0%
#6
73.0%
#7
58.8%
#8
58.6%
#9
53.8%
#10
50.0%
What city has the Highest Poverty Level Among Married Couples in West Virginia?
Amherstdale has the Highest Poverty Level Among Married Couples in West Virginia with 100.0%.
What is the Poverty Level Among Married Couples in the State of West Virginia?
Poverty Level Among Married Couples in West Virginia is 6.6%.
What is the Poverty Level Among Married Couples in the United States?
Poverty Level Among Married Couples in the United States is 4.5%.