Cities with the Highest Poverty Level Among Married Couples in Florida
RELATED REPORTS & OPTIONS
Highest Poverty | Married Couple
Florida
Compare Cities
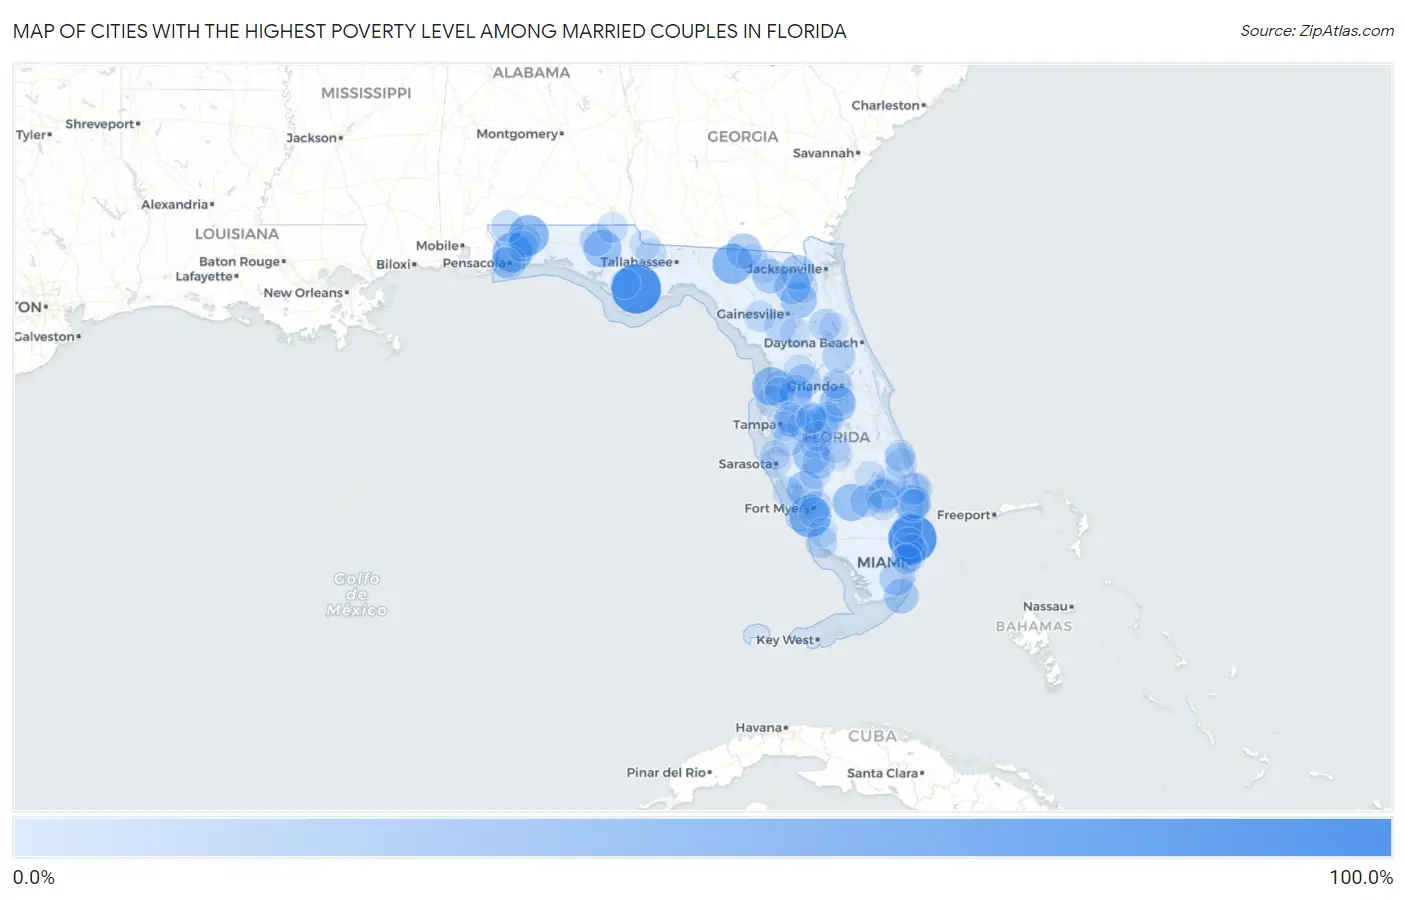
Map of Cities with the Highest Poverty Level Among Married Couples in Florida
0.0%
100.0%
Cities with the Highest Poverty Level Among Married Couples in Florida
| City | Married Couples Poverty | vs State | vs National | |
| 1. | Sumatra | 100.0% | 5.4%(+94.6)#1 | 4.5%(+95.5)#88 |
| 2. | Lazy Lake | 94.4% | 5.4%(+89.0)#2 | 4.5%(+89.9)#107 |
| 3. | Harlem Heights | 66.9% | 5.4%(+61.5)#3 | 4.5%(+62.4)#181 |
| 4. | Lee | 57.5% | 5.4%(+52.2)#4 | 4.5%(+53.1)#296 |
| 5. | Munson | 56.5% | 5.4%(+51.1)#5 | 4.5%(+52.0)#305 |
| 6. | Floridatown | 56.2% | 5.4%(+50.9)#6 | 4.5%(+51.8)#306 |
| 7. | Tropical Park | 54.7% | 5.4%(+49.4)#7 | 4.5%(+50.3)#325 |
| 8. | Weeki Wachee Gardens | 49.4% | 5.4%(+44.0)#8 | 4.5%(+44.9)#408 |
| 9. | Wausau | 46.9% | 5.4%(+41.5)#9 | 4.5%(+42.4)#447 |
| 10. | Pioneer | 44.4% | 5.4%(+39.1)#10 | 4.5%(+40.0)#496 |
| 11. | Plantation Mobile Home Park | 43.3% | 5.4%(+37.9)#11 | 4.5%(+38.9)#529 |
| 12. | Campbell | 42.6% | 5.4%(+37.2)#12 | 4.5%(+38.1)#554 |
| 13. | Ona | 42.1% | 5.4%(+36.7)#13 | 4.5%(+37.6)#567 |
| 14. | Hampton | 39.7% | 5.4%(+34.3)#14 | 4.5%(+35.2)#643 |
| 15. | Solana | 39.4% | 5.4%(+34.0)#15 | 4.5%(+35.0)#655 |
| 16. | Raiford | 38.8% | 5.4%(+33.4)#16 | 4.5%(+34.3)#677 |
| 17. | Jennings | 37.7% | 5.4%(+32.4)#17 | 4.5%(+33.3)#713 |
| 18. | Glen St Mary | 35.2% | 5.4%(+29.9)#18 | 4.5%(+30.8)#796 |
| 19. | Five Points | 33.7% | 5.4%(+28.3)#19 | 4.5%(+29.3)#856 |
| 20. | North Key Largo | 33.2% | 5.4%(+27.8)#20 | 4.5%(+28.7)#902 |
| 21. | Webster | 30.3% | 5.4%(+24.9)#21 | 4.5%(+25.8)#1,017 |
| 22. | Naranja | 30.2% | 5.4%(+24.9)#22 | 4.5%(+25.8)#1,020 |
| 23. | Pahokee | 30.0% | 5.4%(+24.6)#23 | 4.5%(+25.6)#1,023 |
| 24. | Wahneta | 29.4% | 5.4%(+24.0)#24 | 4.5%(+24.9)#1,065 |
| 25. | Goulding | 29.3% | 5.4%(+23.9)#25 | 4.5%(+24.8)#1,068 |
| 26. | Dade City North | 28.1% | 5.4%(+22.7)#26 | 4.5%(+23.7)#1,156 |
| 27. | Willow Oak | 27.8% | 5.4%(+22.5)#27 | 4.5%(+23.4)#1,179 |
| 28. | Canal Point | 26.9% | 5.4%(+21.6)#28 | 4.5%(+22.5)#1,252 |
| 29. | Winding Cypress | 26.3% | 5.4%(+21.0)#29 | 4.5%(+21.9)#1,299 |
| 30. | Lake Mack Forest Hills | 25.7% | 5.4%(+20.3)#30 | 4.5%(+21.2)#1,360 |
| 31. | Gardner | 25.7% | 5.4%(+20.3)#31 | 4.5%(+21.2)#1,362 |
| 32. | Lacoochee | 25.6% | 5.4%(+20.3)#32 | 4.5%(+21.2)#1,363 |
| 33. | Pembroke Park | 25.2% | 5.4%(+19.9)#33 | 4.5%(+20.8)#1,390 |
| 34. | Bonifay | 25.1% | 5.4%(+19.8)#34 | 4.5%(+20.7)#1,396 |
| 35. | Moon Lake | 24.3% | 5.4%(+18.9)#35 | 4.5%(+19.8)#1,518 |
| 36. | Limestone Creek | 23.4% | 5.4%(+18.0)#36 | 4.5%(+18.9)#1,622 |
| 37. | Clewiston | 23.3% | 5.4%(+17.9)#37 | 4.5%(+18.9)#1,629 |
| 38. | Welaka | 23.2% | 5.4%(+17.8)#38 | 4.5%(+18.8)#1,637 |
| 39. | Dover | 23.1% | 5.4%(+17.7)#39 | 4.5%(+18.6)#1,645 |
| 40. | Springhill | 23.1% | 5.4%(+17.7)#40 | 4.5%(+18.6)#1,655 |
| 41. | Wimauma | 22.8% | 5.4%(+17.5)#41 | 4.5%(+18.4)#1,682 |
| 42. | Century | 22.0% | 5.4%(+16.6)#42 | 4.5%(+17.5)#1,799 |
| 43. | Wiscon | 21.7% | 5.4%(+16.3)#43 | 4.5%(+17.2)#1,838 |
| 44. | Bowling Green | 21.4% | 5.4%(+16.1)#44 | 4.5%(+17.0)#1,859 |
| 45. | Raleigh | 21.4% | 5.4%(+16.0)#45 | 4.5%(+16.9)#1,874 |
| 46. | Jupiter Inlet Colony | 20.7% | 5.4%(+15.3)#46 | 4.5%(+16.2)#1,953 |
| 47. | Naples Manor | 20.7% | 5.4%(+15.3)#47 | 4.5%(+16.2)#1,955 |
| 48. | Royal Palm Estates | 20.2% | 5.4%(+14.8)#48 | 4.5%(+15.7)#2,015 |
| 49. | Rainbow Park | 19.6% | 5.4%(+14.2)#49 | 4.5%(+15.1)#2,122 |
| 50. | Lake Hamilton | 19.6% | 5.4%(+14.2)#50 | 4.5%(+15.1)#2,123 |
| 51. | Roeville | 19.4% | 5.4%(+14.1)#51 | 4.5%(+15.0)#2,144 |
| 52. | Trenton | 19.1% | 5.4%(+13.8)#52 | 4.5%(+14.7)#2,189 |
| 53. | Indiantown | 19.1% | 5.4%(+13.7)#53 | 4.5%(+14.6)#2,194 |
| 54. | River Park | 18.7% | 5.4%(+13.3)#54 | 4.5%(+14.2)#2,277 |
| 55. | Tice | 18.5% | 5.4%(+13.1)#55 | 4.5%(+14.1)#2,296 |
| 56. | Masaryktown | 18.0% | 5.4%(+12.6)#56 | 4.5%(+13.5)#2,405 |
| 57. | Orlovista | 18.0% | 5.4%(+12.6)#57 | 4.5%(+13.5)#2,409 |
| 58. | Campbellton | 17.9% | 5.4%(+12.6)#58 | 4.5%(+13.5)#2,420 |
| 59. | Fort Pierce North | 17.3% | 5.4%(+12.0)#59 | 4.5%(+12.9)#2,544 |
| 60. | Biscayne Park | 17.1% | 5.4%(+11.8)#60 | 4.5%(+12.7)#2,590 |
| 61. | Lawtey | 17.0% | 5.4%(+11.6)#61 | 4.5%(+12.5)#2,616 |
| 62. | Ave Maria | 16.9% | 5.4%(+11.5)#62 | 4.5%(+12.4)#2,636 |
| 63. | Lake Panasoffkee | 16.7% | 5.4%(+11.4)#63 | 4.5%(+12.3)#2,663 |
| 64. | Southeast Arcadia | 16.7% | 5.4%(+11.3)#64 | 4.5%(+12.2)#2,713 |
| 65. | North Sarasota | 16.5% | 5.4%(+11.1)#65 | 4.5%(+12.1)#2,723 |
| 66. | Mango | 16.4% | 5.4%(+11.0)#66 | 4.5%(+11.9)#2,750 |
| 67. | Avon Park | 16.4% | 5.4%(+11.0)#67 | 4.5%(+11.9)#2,753 |
| 68. | Reddick | 16.4% | 5.4%(+11.0)#68 | 4.5%(+11.9)#2,756 |
| 69. | Fussels Corner | 16.0% | 5.4%(+10.6)#69 | 4.5%(+11.5)#2,829 |
| 70. | Greensboro | 15.8% | 5.4%(+10.5)#70 | 4.5%(+11.4)#2,877 |
| 71. | Dundee | 15.7% | 5.4%(+10.4)#71 | 4.5%(+11.3)#2,915 |
| 72. | Kissimmee | 15.6% | 5.4%(+10.2)#72 | 4.5%(+11.1)#2,944 |
| 73. | Combee Settlement | 15.6% | 5.4%(+10.2)#73 | 4.5%(+11.1)#2,952 |
| 74. | Pine Manor | 15.5% | 5.4%(+10.2)#74 | 4.5%(+11.1)#2,961 |
| 75. | Belle Glade | 15.5% | 5.4%(+10.1)#75 | 4.5%(+11.0)#2,974 |
| 76. | Thonotosassa | 15.2% | 5.4%(+9.83)#76 | 4.5%(+10.7)#3,040 |
| 77. | Chattahoochee | 15.2% | 5.4%(+9.82)#77 | 4.5%(+10.7)#3,042 |
| 78. | Pensacola Station | 14.9% | 5.4%(+9.56)#78 | 4.5%(+10.5)#3,103 |
| 79. | Fort Meade | 14.8% | 5.4%(+9.41)#79 | 4.5%(+10.3)#3,141 |
| 80. | West Pensacola | 14.8% | 5.4%(+9.39)#80 | 4.5%(+10.3)#3,150 |
| 81. | Grove City | 14.6% | 5.4%(+9.25)#81 | 4.5%(+10.2)#3,197 |
| 82. | Brownsville | 14.5% | 5.4%(+9.16)#82 | 4.5%(+10.1)#3,222 |
| 83. | Hallandale Beach | 14.4% | 5.4%(+9.03)#83 | 4.5%(+9.94)#3,262 |
| 84. | Buckhead Ridge | 14.2% | 5.4%(+8.85)#84 | 4.5%(+9.76)#3,344 |
| 85. | Watergate | 14.2% | 5.4%(+8.79)#85 | 4.5%(+9.70)#3,358 |
| 86. | West Samoset | 14.1% | 5.4%(+8.73)#86 | 4.5%(+9.64)#3,370 |
| 87. | Crescent City | 14.1% | 5.4%(+8.69)#87 | 4.5%(+9.60)#3,383 |
| 88. | Sebring | 14.0% | 5.4%(+8.64)#88 | 4.5%(+9.54)#3,398 |
| 89. | Broadview Park | 13.9% | 5.4%(+8.56)#89 | 4.5%(+9.47)#3,415 |
| 90. | Pine Hills | 13.8% | 5.4%(+8.43)#90 | 4.5%(+9.34)#3,450 |
| 91. | Wewahitchka | 13.7% | 5.4%(+8.35)#91 | 4.5%(+9.26)#3,482 |
| 92. | White Springs | 13.7% | 5.4%(+8.30)#92 | 4.5%(+9.21)#3,491 |
| 93. | Palm River Clair Mel | 13.6% | 5.4%(+8.22)#93 | 4.5%(+9.13)#3,521 |
| 94. | Westgate | 13.6% | 5.4%(+8.21)#94 | 4.5%(+9.11)#3,526 |
| 95. | Crystal Lake | 13.6% | 5.4%(+8.18)#95 | 4.5%(+9.09)#3,536 |
| 96. | Fort Pierce | 13.5% | 5.4%(+8.18)#96 | 4.5%(+9.09)#3,538 |
| 97. | Jasper | 13.5% | 5.4%(+8.17)#97 | 4.5%(+9.08)#3,542 |
| 98. | University Cdp Hillsborough County | 13.5% | 5.4%(+8.11)#98 | 4.5%(+9.02)#3,573 |
| 99. | Island Walk | 13.5% | 5.4%(+8.10)#99 | 4.5%(+9.01)#3,574 |
| 100. | Gladeview | 13.3% | 5.4%(+7.96)#100 | 4.5%(+8.87)#3,640 |
Common Questions
What are the Top 10 Cities with the Highest Poverty Level Among Married Couples in Florida?
Top 10 Cities with the Highest Poverty Level Among Married Couples in Florida are:
#1
100.0%
#2
94.4%
#3
66.9%
#4
57.5%
#5
56.5%
#6
56.2%
#7
49.4%
#8
46.9%
#9
44.4%
#10
43.3%
What city has the Highest Poverty Level Among Married Couples in Florida?
Sumatra has the Highest Poverty Level Among Married Couples in Florida with 100.0%.
What is the Poverty Level Among Married Couples in the State of Florida?
Poverty Level Among Married Couples in Florida is 5.4%.
What is the Poverty Level Among Married Couples in the United States?
Poverty Level Among Married Couples in the United States is 4.5%.