Cities with the Highest Poverty Level Among Married Couples in Oregon
RELATED REPORTS & OPTIONS
Highest Poverty | Married Couple
Oregon
Compare Cities
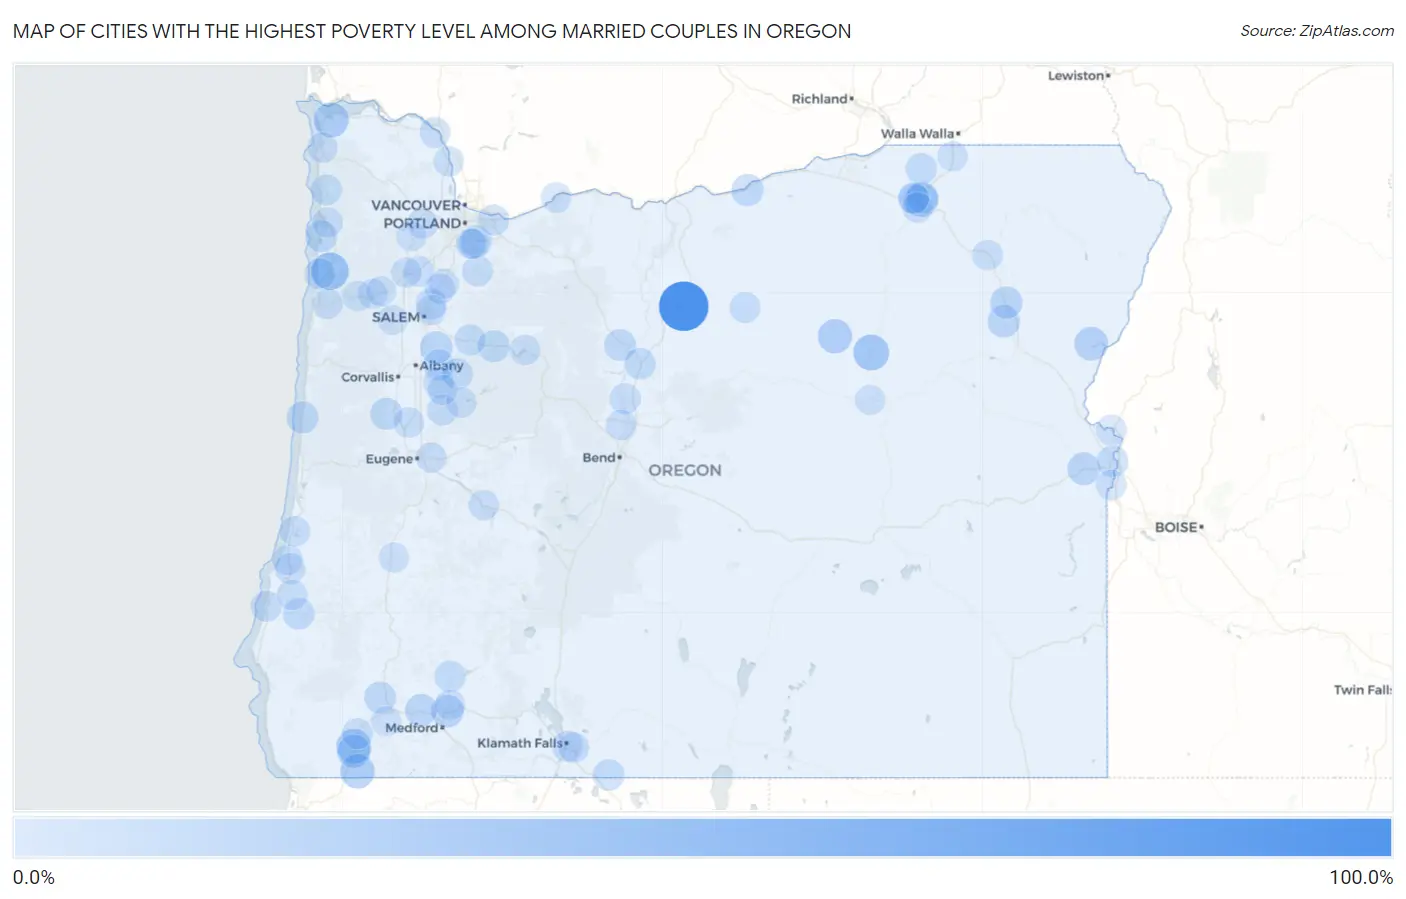
Map of Cities with the Highest Poverty Level Among Married Couples in Oregon
0.0%
100.0%
Cities with the Highest Poverty Level Among Married Couples in Oregon
| City | Married Couples Poverty | vs State | vs National | |
| 1. | Shaniko | 100.0% | 3.8%(+96.2)#1 | 4.5%(+95.5)#99 |
| 2. | Trent | 50.4% | 3.8%(+46.5)#2 | 4.5%(+45.9)#371 |
| 3. | Hebo | 40.4% | 3.8%(+36.6)#3 | 4.5%(+35.9)#608 |
| 4. | Long Creek | 32.4% | 3.8%(+28.5)#4 | 4.5%(+27.9)#923 |
| 5. | Jeffers Gardens | 28.6% | 3.8%(+24.7)#5 | 4.5%(+24.1)#1,114 |
| 6. | Kerby | 27.5% | 3.8%(+23.6)#6 | 4.5%(+23.0)#1,211 |
| 7. | Takilma | 25.8% | 3.8%(+21.9)#7 | 4.5%(+21.3)#1,350 |
| 8. | Monument | 25.0% | 3.8%(+21.2)#8 | 4.5%(+20.5)#1,432 |
| 9. | Dexter | 24.2% | 3.8%(+20.4)#9 | 4.5%(+19.8)#1,524 |
| 10. | Mission | 22.2% | 3.8%(+18.4)#10 | 4.5%(+17.8)#1,744 |
| 11. | Richland | 22.2% | 3.8%(+18.4)#11 | 4.5%(+17.8)#1,753 |
| 12. | Bayshore | 21.5% | 3.8%(+17.7)#12 | 4.5%(+17.1)#1,853 |
| 13. | Beaver Marsh | 20.9% | 3.8%(+17.1)#13 | 4.5%(+16.5)#1,912 |
| 14. | Cave Junction | 20.0% | 3.8%(+16.2)#14 | 4.5%(+15.5)#2,026 |
| 15. | Vale | 17.2% | 3.8%(+13.3)#15 | 4.5%(+12.7)#2,581 |
| 16. | White City | 16.8% | 3.8%(+13.0)#16 | 4.5%(+12.4)#2,653 |
| 17. | Marion | 16.7% | 3.8%(+12.8)#17 | 4.5%(+12.2)#2,680 |
| 18. | Haines | 16.7% | 3.8%(+12.8)#18 | 4.5%(+12.2)#2,690 |
| 19. | Mapleton | 16.5% | 3.8%(+12.6)#19 | 4.5%(+12.0)#2,734 |
| 20. | Svensen | 16.0% | 3.8%(+12.2)#20 | 4.5%(+11.5)#2,832 |
| 21. | Marcola | 15.5% | 3.8%(+11.7)#21 | 4.5%(+11.1)#2,963 |
| 22. | Gold Hill | 15.2% | 3.8%(+11.4)#22 | 4.5%(+10.8)#3,029 |
| 23. | North Powder | 15.2% | 3.8%(+11.3)#23 | 4.5%(+10.7)#3,048 |
| 24. | Arlington | 14.6% | 3.8%(+10.8)#24 | 4.5%(+10.2)#3,188 |
| 25. | Warm Springs | 14.5% | 3.8%(+10.6)#25 | 4.5%(+9.99)#3,246 |
| 26. | Yachats | 13.9% | 3.8%(+10.1)#26 | 4.5%(+9.48)#3,414 |
| 27. | Gates | 13.9% | 3.8%(+10.0)#27 | 4.5%(+9.40)#3,437 |
| 28. | Netarts | 13.7% | 3.8%(+9.91)#28 | 4.5%(+9.27)#3,476 |
| 29. | Alpine | 13.7% | 3.8%(+9.87)#29 | 4.5%(+9.24)#3,487 |
| 30. | Merlin | 13.4% | 3.8%(+9.55)#30 | 4.5%(+8.92)#3,599 |
| 31. | Ontario | 12.4% | 3.8%(+8.62)#31 | 4.5%(+7.98)#3,989 |
| 32. | Cherry Grove | 12.3% | 3.8%(+8.48)#32 | 4.5%(+7.85)#4,029 |
| 33. | Kirkpatrick | 12.2% | 3.8%(+8.37)#33 | 4.5%(+7.73)#4,073 |
| 34. | Malin | 12.2% | 3.8%(+8.35)#34 | 4.5%(+7.71)#4,085 |
| 35. | Madras | 12.2% | 3.8%(+8.33)#35 | 4.5%(+7.70)#4,092 |
| 36. | Myrtle Point | 12.1% | 3.8%(+8.28)#36 | 4.5%(+7.64)#4,126 |
| 37. | Johnson City | 11.8% | 3.8%(+7.94)#37 | 4.5%(+7.30)#4,283 |
| 38. | Crabtree | 11.7% | 3.8%(+7.86)#38 | 4.5%(+7.23)#4,324 |
| 39. | Helix | 11.4% | 3.8%(+7.60)#39 | 4.5%(+6.97)#4,434 |
| 40. | Trail | 11.2% | 3.8%(+7.39)#40 | 4.5%(+6.75)#4,526 |
| 41. | Mehama | 10.6% | 3.8%(+6.81)#41 | 4.5%(+6.18)#4,855 |
| 42. | Labish Village | 10.6% | 3.8%(+6.75)#42 | 4.5%(+6.12)#4,900 |
| 43. | Riverside | 10.5% | 3.8%(+6.70)#43 | 4.5%(+6.06)#4,921 |
| 44. | Lacomb | 10.5% | 3.8%(+6.67)#44 | 4.5%(+6.04)#4,947 |
| 45. | Pacific City | 10.3% | 3.8%(+6.43)#45 | 4.5%(+5.79)#5,085 |
| 46. | Nehalem | 10.2% | 3.8%(+6.34)#46 | 4.5%(+5.71)#5,147 |
| 47. | Wood Village | 9.9% | 3.8%(+6.10)#47 | 4.5%(+5.46)#5,312 |
| 48. | Fossil | 9.8% | 3.8%(+6.00)#48 | 4.5%(+5.36)#5,379 |
| 49. | Selma | 9.8% | 3.8%(+5.95)#49 | 4.5%(+5.32)#5,407 |
| 50. | Lebanon | 9.8% | 3.8%(+5.94)#50 | 4.5%(+5.31)#5,411 |
| 51. | Klamath Falls | 9.7% | 3.8%(+5.83)#51 | 4.5%(+5.19)#5,479 |
| 52. | Crooked River Ranch | 9.5% | 3.8%(+5.64)#52 | 4.5%(+5.00)#5,605 |
| 53. | Rainier | 9.4% | 3.8%(+5.60)#53 | 4.5%(+4.96)#5,636 |
| 54. | Bandon | 9.4% | 3.8%(+5.56)#54 | 4.5%(+4.93)#5,657 |
| 55. | Mulino | 9.3% | 3.8%(+5.49)#55 | 4.5%(+4.85)#5,702 |
| 56. | Gladstone | 9.1% | 3.8%(+5.25)#56 | 4.5%(+4.61)#5,933 |
| 57. | Marlene | 9.0% | 3.8%(+5.15)#57 | 4.5%(+4.52)#5,986 |
| 58. | Crawfordsville | 8.9% | 3.8%(+5.04)#58 | 4.5%(+4.41)#6,069 |
| 59. | Harrisburg | 8.7% | 3.8%(+4.86)#59 | 4.5%(+4.23)#6,206 |
| 60. | Wedderburn | 8.6% | 3.8%(+4.79)#60 | 4.5%(+4.16)#6,252 |
| 61. | Bunker Hill | 8.6% | 3.8%(+4.73)#61 | 4.5%(+4.10)#6,286 |
| 62. | North Bend | 8.5% | 3.8%(+4.65)#62 | 4.5%(+4.02)#6,339 |
| 63. | Gopher Flats | 8.5% | 3.8%(+4.65)#63 | 4.5%(+4.01)#6,343 |
| 64. | Nyssa | 8.5% | 3.8%(+4.63)#64 | 4.5%(+4.00)#6,353 |
| 65. | Annex | 8.3% | 3.8%(+4.51)#65 | 4.5%(+3.87)#6,453 |
| 66. | Cornelius | 8.2% | 3.8%(+4.41)#66 | 4.5%(+3.78)#6,544 |
| 67. | Lakeside | 8.2% | 3.8%(+4.41)#67 | 4.5%(+3.77)#6,551 |
| 68. | Eagle Crest | 8.1% | 3.8%(+4.32)#68 | 4.5%(+3.69)#6,621 |
| 69. | Altamont | 8.0% | 3.8%(+4.19)#69 | 4.5%(+3.55)#6,726 |
| 70. | Gervais | 8.0% | 3.8%(+4.18)#70 | 4.5%(+3.55)#6,728 |
| 71. | Dayton | 8.0% | 3.8%(+4.16)#71 | 4.5%(+3.52)#6,767 |
| 72. | Jasper | 8.0% | 3.8%(+4.14)#72 | 4.5%(+3.51)#6,776 |
| 73. | La Grande | 7.9% | 3.8%(+4.09)#73 | 4.5%(+3.46)#6,821 |
| 74. | Rose Lodge | 7.8% | 3.8%(+3.95)#74 | 4.5%(+3.32)#6,950 |
| 75. | Westfir | 7.8% | 3.8%(+3.95)#75 | 4.5%(+3.32)#6,952 |
| 76. | Tutuilla | 7.7% | 3.8%(+3.87)#76 | 4.5%(+3.23)#7,052 |
| 77. | Bay City | 7.5% | 3.8%(+3.68)#77 | 4.5%(+3.04)#7,213 |
| 78. | Detroit | 7.4% | 3.8%(+3.58)#78 | 4.5%(+2.95)#7,327 |
| 79. | Cascade Locks | 7.4% | 3.8%(+3.55)#79 | 4.5%(+2.92)#7,354 |
| 80. | Mcminnville | 7.4% | 3.8%(+3.54)#80 | 4.5%(+2.91)#7,363 |
| 81. | Seaside | 7.4% | 3.8%(+3.52)#81 | 4.5%(+2.89)#7,380 |
| 82. | Springfield | 7.2% | 3.8%(+3.39)#82 | 4.5%(+2.76)#7,511 |
| 83. | Jennings Lodge | 7.2% | 3.8%(+3.35)#83 | 4.5%(+2.71)#7,540 |
| 84. | Sweet Home | 7.1% | 3.8%(+3.31)#84 | 4.5%(+2.67)#7,630 |
| 85. | Coquille | 7.1% | 3.8%(+3.26)#85 | 4.5%(+2.62)#7,669 |
| 86. | Eagle Point | 7.0% | 3.8%(+3.20)#86 | 4.5%(+2.56)#7,736 |
| 87. | Columbia City | 7.0% | 3.8%(+3.14)#87 | 4.5%(+2.50)#7,813 |
| 88. | Grand Ronde | 6.9% | 3.8%(+3.05)#88 | 4.5%(+2.42)#7,907 |
| 89. | Woodburn | 6.9% | 3.8%(+3.03)#89 | 4.5%(+2.40)#7,922 |
| 90. | Sodaville | 6.8% | 3.8%(+2.93)#90 | 4.5%(+2.29)#8,034 |
| 91. | Hayesville | 6.7% | 3.8%(+2.83)#91 | 4.5%(+2.20)#8,166 |
| 92. | River Road | 6.5% | 3.8%(+2.69)#92 | 4.5%(+2.06)#8,307 |
| 93. | Milton Freewater | 6.5% | 3.8%(+2.68)#93 | 4.5%(+2.04)#8,316 |
| 94. | Gaston | 6.5% | 3.8%(+2.68)#94 | 4.5%(+2.04)#8,319 |
| 95. | Oakland | 6.5% | 3.8%(+2.64)#95 | 4.5%(+2.00)#8,366 |
| 96. | Willamina | 6.3% | 3.8%(+2.51)#96 | 4.5%(+1.87)#8,544 |
| 97. | New Hope | 6.3% | 3.8%(+2.48)#97 | 4.5%(+1.84)#8,586 |
| 98. | Sheridan | 6.3% | 3.8%(+2.44)#98 | 4.5%(+1.81)#8,606 |
| 99. | Mount Vernon | 6.2% | 3.8%(+2.36)#99 | 4.5%(+1.72)#8,739 |
| 100. | Dallas | 6.2% | 3.8%(+2.34)#100 | 4.5%(+1.71)#8,753 |
Common Questions
What are the Top 10 Cities with the Highest Poverty Level Among Married Couples in Oregon?
Top 10 Cities with the Highest Poverty Level Among Married Couples in Oregon are:
#1
100.0%
#2
40.4%
#3
32.4%
#4
28.6%
#5
27.5%
#6
25.8%
#7
25.0%
#8
22.2%
#9
22.2%
#10
20.0%
What city has the Highest Poverty Level Among Married Couples in Oregon?
Shaniko has the Highest Poverty Level Among Married Couples in Oregon with 100.0%.
What is the Poverty Level Among Married Couples in the State of Oregon?
Poverty Level Among Married Couples in Oregon is 3.8%.
What is the Poverty Level Among Married Couples in the United States?
Poverty Level Among Married Couples in the United States is 4.5%.