Cities with the Highest Poverty Level Among Married Couples in Texas
RELATED REPORTS & OPTIONS
Highest Poverty | Married Couple
Texas
Compare Cities
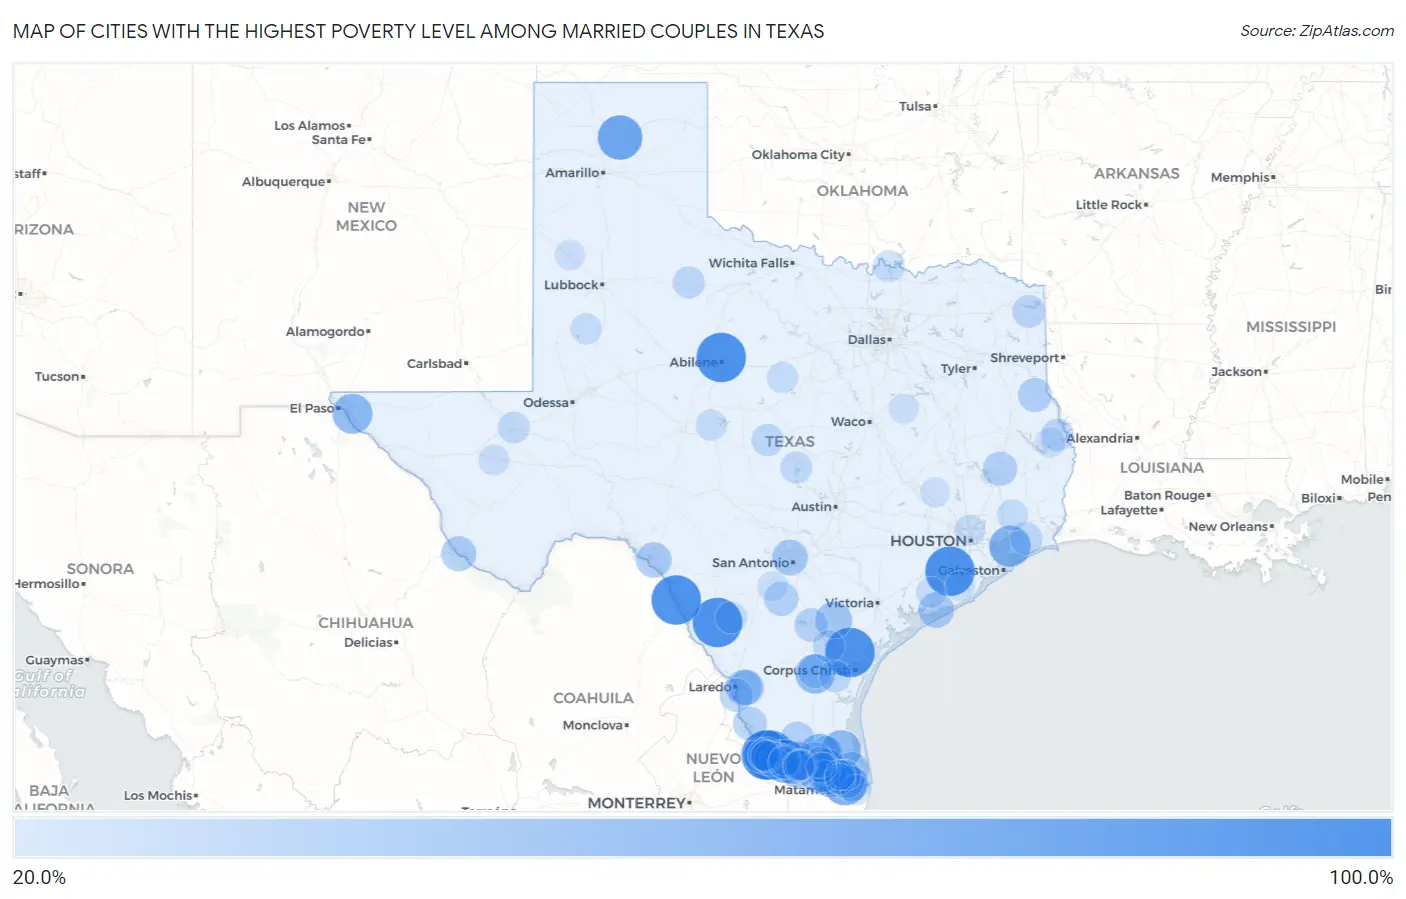
Map of Cities with the Highest Poverty Level Among Married Couples in Texas
0.0%
100.0%
Cities with the Highest Poverty Level Among Married Couples in Texas
| City | Married Couples Poverty | vs State | vs National | |
| 1. | Carrizo Hill | 100.0% | 5.9%(+94.1)#1 | 4.5%(+95.5)#1 |
| 2. | La Esperanza | 100.0% | 5.9%(+94.1)#2 | 4.5%(+95.5)#21 |
| 3. | North Escobares | 100.0% | 5.9%(+94.1)#3 | 4.5%(+95.5)#27 |
| 4. | Damon | 100.0% | 5.9%(+94.1)#4 | 4.5%(+95.5)#55 |
| 5. | Radar Base | 100.0% | 5.9%(+94.1)#5 | 4.5%(+95.5)#70 |
| 6. | Rancho Chico | 100.0% | 5.9%(+94.1)#6 | 4.5%(+95.5)#81 |
| 7. | Acala | 100.0% | 5.9%(+94.1)#7 | 4.5%(+95.5)#92 |
| 8. | Impact | 100.0% | 5.9%(+94.1)#8 | 4.5%(+95.5)#102 |
| 9. | Sanford | 80.0% | 5.9%(+74.1)#9 | 4.5%(+75.5)#130 |
| 10. | El Socio | 76.2% | 5.9%(+70.3)#10 | 4.5%(+71.7)#144 |
| 11. | San Pedro | 74.1% | 5.9%(+68.1)#11 | 4.5%(+69.6)#151 |
| 12. | Oak Island | 67.3% | 5.9%(+61.4)#12 | 4.5%(+62.9)#178 |
| 13. | Bledsoe | 64.0% | 5.9%(+58.1)#13 | 4.5%(+59.5)#216 |
| 14. | Eugenio Saenz | 63.6% | 5.9%(+57.7)#14 | 4.5%(+59.2)#219 |
| 15. | Hargill | 62.6% | 5.9%(+56.7)#15 | 4.5%(+58.1)#228 |
| 16. | Salineno North | 62.5% | 5.9%(+56.6)#16 | 4.5%(+58.0)#232 |
| 17. | Sparks | 61.8% | 5.9%(+55.9)#17 | 4.5%(+57.3)#239 |
| 18. | San Perlita | 60.9% | 5.9%(+55.0)#18 | 4.5%(+56.4)#253 |
| 19. | Indian Hills | 60.3% | 5.9%(+54.4)#19 | 4.5%(+55.8)#262 |
| 20. | Alice Acres | 59.8% | 5.9%(+53.8)#20 | 4.5%(+55.3)#275 |
| 21. | Bluetown | 59.5% | 5.9%(+53.6)#21 | 4.5%(+55.0)#276 |
| 22. | Scissors | 57.6% | 5.9%(+51.7)#22 | 4.5%(+53.2)#293 |
| 23. | Citrus City | 55.2% | 5.9%(+49.3)#23 | 4.5%(+50.7)#318 |
| 24. | San Juan | 54.5% | 5.9%(+48.6)#24 | 4.5%(+50.1)#329 |
| 25. | Sunset Cdp Starr County | 53.3% | 5.9%(+47.4)#25 | 4.5%(+48.9)#346 |
| 26. | Abram | 53.0% | 5.9%(+47.1)#26 | 4.5%(+48.5)#351 |
| 27. | El Refugio | 50.0% | 5.9%(+44.1)#27 | 4.5%(+45.5)#375 |
| 28. | Normanna | 50.0% | 5.9%(+44.1)#28 | 4.5%(+45.5)#401 |
| 29. | La Tina Ranch | 47.5% | 5.9%(+41.5)#29 | 4.5%(+43.0)#435 |
| 30. | Ranchitos East | 46.2% | 5.9%(+40.2)#30 | 4.5%(+41.7)#462 |
| 31. | Balcones Heights | 45.9% | 5.9%(+40.0)#31 | 4.5%(+41.4)#477 |
| 32. | Palmer | 45.3% | 5.9%(+39.4)#32 | 4.5%(+40.8)#485 |
| 33. | Matagorda | 45.2% | 5.9%(+39.2)#33 | 4.5%(+40.7)#487 |
| 34. | Lake View | 44.9% | 5.9%(+38.9)#34 | 4.5%(+40.4)#494 |
| 35. | Havana | 44.4% | 5.9%(+38.5)#35 | 4.5%(+40.0)#497 |
| 36. | Doolittle | 44.2% | 5.9%(+38.3)#36 | 4.5%(+39.8)#506 |
| 37. | Cameron Park | 43.5% | 5.9%(+37.5)#37 | 4.5%(+39.0)#522 |
| 38. | Pueblo Nuevo | 43.4% | 5.9%(+37.4)#38 | 4.5%(+38.9)#528 |
| 39. | Presidio | 43.0% | 5.9%(+37.0)#39 | 4.5%(+38.5)#532 |
| 40. | Wingate | 42.9% | 5.9%(+36.9)#40 | 4.5%(+38.4)#543 |
| 41. | East Columbia | 41.5% | 5.9%(+35.5)#41 | 4.5%(+37.0)#581 |
| 42. | Fronton | 41.3% | 5.9%(+35.4)#42 | 4.5%(+36.8)#583 |
| 43. | Salida Del Sol Estates | 41.1% | 5.9%(+35.1)#43 | 4.5%(+36.6)#596 |
| 44. | La Escondida | 40.0% | 5.9%(+34.1)#44 | 4.5%(+35.5)#620 |
| 45. | Seven Oaks | 40.0% | 5.9%(+34.1)#45 | 4.5%(+35.5)#623 |
| 46. | Charlotte | 39.3% | 5.9%(+33.3)#46 | 4.5%(+34.8)#661 |
| 47. | Delmita | 39.0% | 5.9%(+33.1)#47 | 4.5%(+34.6)#671 |
| 48. | Tenaha | 38.8% | 5.9%(+32.9)#48 | 4.5%(+34.4)#676 |
| 49. | Medina | 38.4% | 5.9%(+32.4)#49 | 4.5%(+33.9)#691 |
| 50. | Rancho Alegre | 38.4% | 5.9%(+32.4)#50 | 4.5%(+33.9)#692 |
| 51. | Santa Maria | 37.3% | 5.9%(+31.3)#51 | 4.5%(+32.8)#730 |
| 52. | Alto Bonito Heights | 37.1% | 5.9%(+31.2)#52 | 4.5%(+32.7)#732 |
| 53. | Three Rivers | 36.8% | 5.9%(+30.9)#53 | 4.5%(+32.4)#745 |
| 54. | Rio Bravo | 36.6% | 5.9%(+30.7)#54 | 4.5%(+32.2)#751 |
| 55. | Olmito | 36.6% | 5.9%(+30.7)#55 | 4.5%(+32.1)#753 |
| 56. | Lasara | 36.2% | 5.9%(+30.3)#56 | 4.5%(+31.7)#765 |
| 57. | Garceno | 35.7% | 5.9%(+29.8)#57 | 4.5%(+31.3)#780 |
| 58. | Douglassville | 34.4% | 5.9%(+28.4)#58 | 4.5%(+29.9)#831 |
| 59. | Hemphill | 34.0% | 5.9%(+28.0)#59 | 4.5%(+29.5)#847 |
| 60. | Stowell | 33.6% | 5.9%(+27.7)#60 | 4.5%(+29.1)#863 |
| 61. | Richards | 33.3% | 5.9%(+27.4)#61 | 4.5%(+28.9)#883 |
| 62. | Loma Linda East Cdp Jim Wells County | 33.3% | 5.9%(+27.4)#62 | 4.5%(+28.9)#895 |
| 63. | Mila Doce | 32.9% | 5.9%(+27.0)#63 | 4.5%(+28.5)#906 |
| 64. | Richland Springs | 32.3% | 5.9%(+26.3)#64 | 4.5%(+27.8)#925 |
| 65. | Guthrie | 31.9% | 5.9%(+26.0)#65 | 4.5%(+27.5)#936 |
| 66. | Lakeshore Gardens Hidden Acres | 31.5% | 5.9%(+25.6)#66 | 4.5%(+27.0)#956 |
| 67. | Driscoll | 31.4% | 5.9%(+25.4)#67 | 4.5%(+26.9)#961 |
| 68. | Buchanan Lake Village | 31.1% | 5.9%(+25.2)#68 | 4.5%(+26.7)#976 |
| 69. | Progreso | 31.1% | 5.9%(+25.1)#69 | 4.5%(+26.6)#979 |
| 70. | Barstow | 30.6% | 5.9%(+24.7)#70 | 4.5%(+26.2)#1,004 |
| 71. | Big Wells | 30.6% | 5.9%(+24.6)#71 | 4.5%(+26.1)#1,007 |
| 72. | Sherwood Shores | 29.7% | 5.9%(+23.7)#72 | 4.5%(+25.2)#1,051 |
| 73. | Valle Vista | 28.4% | 5.9%(+22.5)#73 | 4.5%(+23.9)#1,129 |
| 74. | La Blanca | 28.4% | 5.9%(+22.5)#74 | 4.5%(+23.9)#1,130 |
| 75. | Paint Rock | 28.3% | 5.9%(+22.3)#75 | 4.5%(+23.8)#1,137 |
| 76. | La Victoria | 28.3% | 5.9%(+22.3)#76 | 4.5%(+23.8)#1,139 |
| 77. | Hull | 28.1% | 5.9%(+22.2)#77 | 4.5%(+23.7)#1,151 |
| 78. | Welch | 28.1% | 5.9%(+22.1)#78 | 4.5%(+23.6)#1,162 |
| 79. | Roma | 28.0% | 5.9%(+22.1)#79 | 4.5%(+23.6)#1,166 |
| 80. | Gorman | 27.8% | 5.9%(+21.9)#80 | 4.5%(+23.3)#1,184 |
| 81. | Doffing | 27.4% | 5.9%(+21.4)#81 | 4.5%(+22.9)#1,215 |
| 82. | Perezville | 27.0% | 5.9%(+21.1)#82 | 4.5%(+22.5)#1,247 |
| 83. | Wildorado | 26.8% | 5.9%(+20.9)#83 | 4.5%(+22.4)#1,261 |
| 84. | Balmorhea | 26.8% | 5.9%(+20.8)#84 | 4.5%(+22.3)#1,263 |
| 85. | Markham | 26.7% | 5.9%(+20.8)#85 | 4.5%(+22.2)#1,265 |
| 86. | Aldine | 26.4% | 5.9%(+20.5)#86 | 4.5%(+22.0)#1,294 |
| 87. | Escobares | 26.4% | 5.9%(+20.5)#87 | 4.5%(+21.9)#1,296 |
| 88. | West Sharyland | 26.3% | 5.9%(+20.4)#88 | 4.5%(+21.9)#1,301 |
| 89. | Mound | 25.6% | 5.9%(+19.7)#89 | 4.5%(+21.2)#1,369 |
| 90. | South Point | 25.4% | 5.9%(+19.4)#90 | 4.5%(+20.9)#1,382 |
| 91. | Green Valley Farms | 25.2% | 5.9%(+19.3)#91 | 4.5%(+20.8)#1,391 |
| 92. | La Paloma | 25.2% | 5.9%(+19.2)#92 | 4.5%(+20.7)#1,395 |
| 93. | Amherst | 25.0% | 5.9%(+19.1)#93 | 4.5%(+20.5)#1,402 |
| 94. | Brazoria | 24.8% | 5.9%(+18.9)#94 | 4.5%(+20.4)#1,469 |
| 95. | Pineland | 24.6% | 5.9%(+18.7)#95 | 4.5%(+20.2)#1,481 |
| 96. | San Benito | 24.6% | 5.9%(+18.6)#96 | 4.5%(+20.1)#1,488 |
| 97. | Tehuacana | 24.4% | 5.9%(+18.5)#97 | 4.5%(+20.0)#1,498 |
| 98. | Anderson | 24.4% | 5.9%(+18.5)#98 | 4.5%(+19.9)#1,504 |
| 99. | Bigfoot | 24.4% | 5.9%(+18.4)#99 | 4.5%(+19.9)#1,507 |
| 100. | Olivarez | 24.3% | 5.9%(+18.4)#100 | 4.5%(+19.8)#1,516 |
Common Questions
What are the Top 10 Cities with the Highest Poverty Level Among Married Couples in Texas?
Top 10 Cities with the Highest Poverty Level Among Married Couples in Texas are:
#1
100.0%
#2
100.0%
#3
100.0%
#4
100.0%
#5
100.0%
#6
100.0%
#7
100.0%
#8
80.0%
#9
76.2%
#10
74.1%
What city has the Highest Poverty Level Among Married Couples in Texas?
Carrizo Hill has the Highest Poverty Level Among Married Couples in Texas with 100.0%.
What is the Poverty Level Among Married Couples in the State of Texas?
Poverty Level Among Married Couples in Texas is 5.9%.
What is the Poverty Level Among Married Couples in the United States?
Poverty Level Among Married Couples in the United States is 4.5%.