Cities with the Highest Poverty Level Among Married Couples in Virginia
RELATED REPORTS & OPTIONS
Highest Poverty | Married Couple
Virginia
Compare Cities
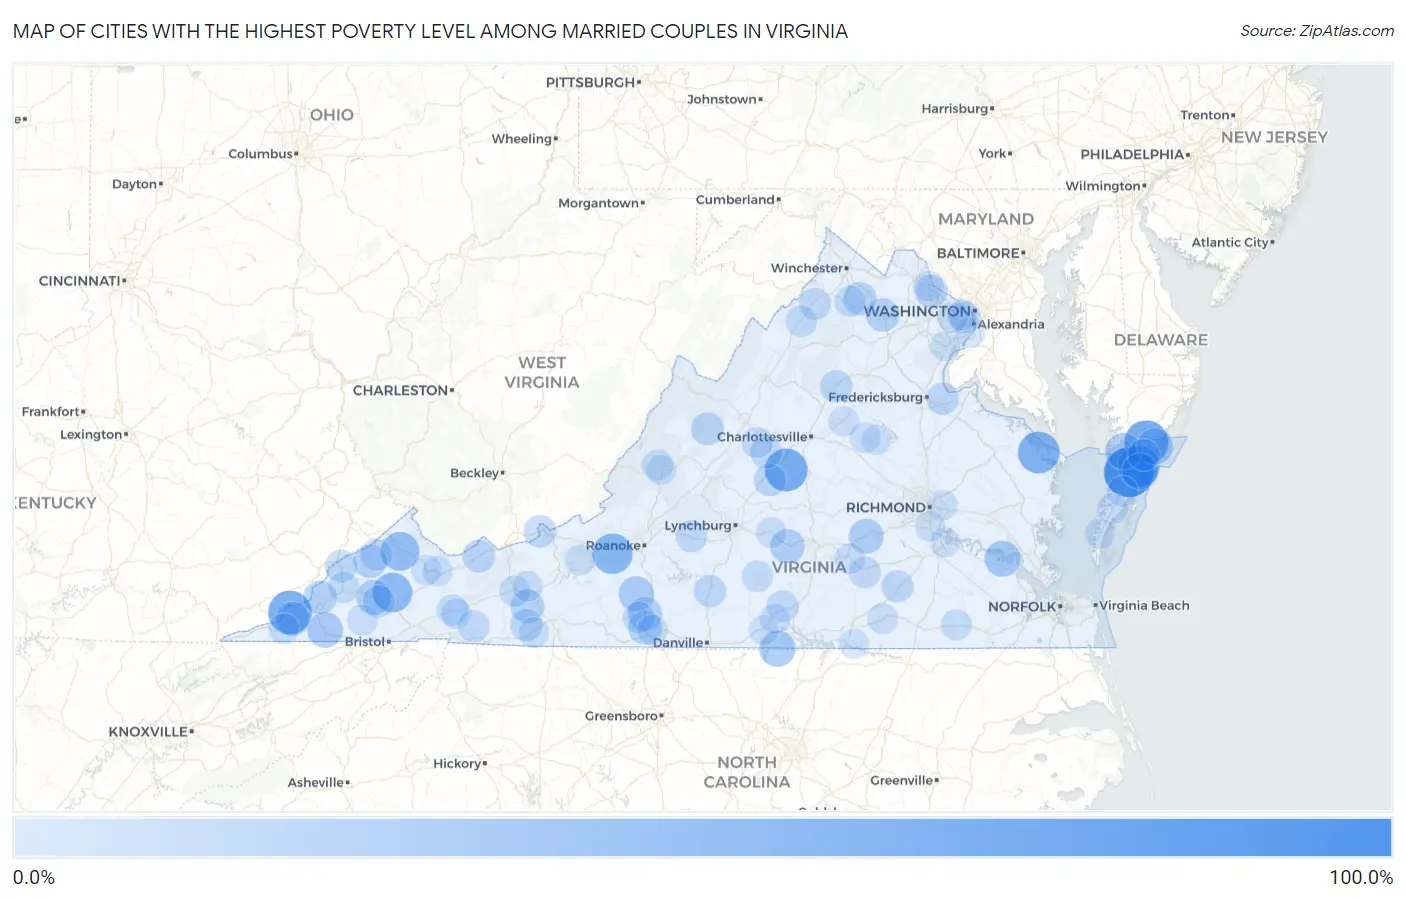
Map of Cities with the Highest Poverty Level Among Married Couples in Virginia
0.0%
100.0%
Cities with the Highest Poverty Level Among Married Couples in Virginia
| City | Married Couples Poverty | vs State | vs National | |
| 1. | Lee Mont | 100.0% | 3.2%(+96.8)#1 | 4.5%(+95.5)#54 |
| 2. | New Church | 74.0% | 3.2%(+70.8)#2 | 4.5%(+69.5)#153 |
| 3. | St Charles | 71.4% | 3.2%(+68.2)#3 | 4.5%(+67.0)#164 |
| 4. | Schuyler | 67.5% | 3.2%(+64.3)#4 | 4.5%(+63.1)#176 |
| 5. | Nelsonia | 63.3% | 3.2%(+60.1)#5 | 4.5%(+58.9)#223 |
| 6. | Heathsville | 62.5% | 3.2%(+59.3)#6 | 4.5%(+58.0)#231 |
| 7. | Elliston | 55.9% | 3.2%(+52.7)#7 | 4.5%(+51.4)#309 |
| 8. | Cleveland | 51.7% | 3.2%(+48.5)#8 | 4.5%(+47.2)#362 |
| 9. | Vansant | 48.5% | 3.2%(+45.3)#9 | 4.5%(+44.0)#419 |
| 10. | Eagle Rock | 46.9% | 3.2%(+43.7)#10 | 4.5%(+42.4)#450 |
| 11. | Millboro | 44.4% | 3.2%(+41.2)#11 | 4.5%(+40.0)#501 |
| 12. | Moneta | 38.4% | 3.2%(+35.1)#12 | 4.5%(+33.9)#693 |
| 13. | Saxis | 37.9% | 3.2%(+34.7)#13 | 4.5%(+33.4)#708 |
| 14. | Horntown | 35.8% | 3.2%(+32.6)#14 | 4.5%(+31.3)#775 |
| 15. | Virgilina | 35.3% | 3.2%(+32.1)#15 | 4.5%(+30.8)#792 |
| 16. | Scotland | 35.3% | 3.2%(+32.1)#16 | 4.5%(+30.8)#793 |
| 17. | Gargatha | 35.0% | 3.2%(+31.8)#17 | 4.5%(+30.5)#805 |
| 18. | Clinchport | 33.3% | 3.2%(+30.1)#18 | 4.5%(+28.9)#889 |
| 19. | Boissevain | 33.0% | 3.2%(+29.7)#19 | 4.5%(+28.5)#905 |
| 20. | Allison Gap | 32.1% | 3.2%(+28.9)#20 | 4.5%(+27.7)#929 |
| 21. | Ferrum | 30.9% | 3.2%(+27.7)#21 | 4.5%(+26.4)#990 |
| 22. | Amelia Court House | 30.0% | 3.2%(+26.8)#22 | 4.5%(+25.5)#1,024 |
| 23. | St Paul | 30.0% | 3.2%(+26.8)#23 | 4.5%(+25.5)#1,036 |
| 24. | Pamplin City | 27.8% | 3.2%(+24.6)#24 | 4.5%(+23.3)#1,189 |
| 25. | Oak Level | 26.7% | 3.2%(+23.5)#25 | 4.5%(+22.2)#1,267 |
| 26. | Pennington Gap | 26.4% | 3.2%(+23.2)#26 | 4.5%(+22.0)#1,295 |
| 27. | Fieldale | 25.8% | 3.2%(+22.6)#27 | 4.5%(+21.3)#1,354 |
| 28. | Ivanhoe | 25.3% | 3.2%(+22.1)#28 | 4.5%(+20.8)#1,387 |
| 29. | Appalachia | 25.0% | 3.2%(+21.8)#29 | 4.5%(+20.5)#1,399 |
| 30. | Clinchco | 23.8% | 3.2%(+20.6)#30 | 4.5%(+19.3)#1,570 |
| 31. | Marshall | 23.0% | 3.2%(+19.8)#31 | 4.5%(+18.6)#1,661 |
| 32. | Shenandoah Farms | 22.8% | 3.2%(+19.6)#32 | 4.5%(+18.4)#1,684 |
| 33. | Osaka | 22.2% | 3.2%(+19.0)#33 | 4.5%(+17.8)#1,760 |
| 34. | Dulles Town Center | 21.6% | 3.2%(+18.4)#34 | 4.5%(+17.2)#1,844 |
| 35. | Springville | 20.7% | 3.2%(+17.5)#35 | 4.5%(+16.2)#1,942 |
| 36. | Craigsville | 20.3% | 3.2%(+17.1)#36 | 4.5%(+15.8)#2,005 |
| 37. | Pound | 19.7% | 3.2%(+16.5)#37 | 4.5%(+15.2)#2,111 |
| 38. | Glen Lyn | 19.0% | 3.2%(+15.8)#38 | 4.5%(+14.6)#2,212 |
| 39. | Shipman | 18.8% | 3.2%(+15.5)#39 | 4.5%(+14.3)#2,252 |
| 40. | Glen Wilton | 18.8% | 3.2%(+15.5)#40 | 4.5%(+14.3)#2,259 |
| 41. | Madison | 18.3% | 3.2%(+15.1)#41 | 4.5%(+13.9)#2,334 |
| 42. | Gretna | 18.0% | 3.2%(+14.8)#42 | 4.5%(+13.5)#2,404 |
| 43. | Passapatanzy | 17.9% | 3.2%(+14.7)#43 | 4.5%(+13.4)#2,434 |
| 44. | Fries | 17.6% | 3.2%(+14.4)#44 | 4.5%(+13.2)#2,475 |
| 45. | Castlewood | 17.5% | 3.2%(+14.3)#45 | 4.5%(+13.0)#2,514 |
| 46. | Mckenney | 17.2% | 3.2%(+14.0)#46 | 4.5%(+12.7)#2,576 |
| 47. | Nellysford | 17.0% | 3.2%(+13.8)#47 | 4.5%(+12.5)#2,623 |
| 48. | Pounding Mill | 16.9% | 3.2%(+13.7)#48 | 4.5%(+12.5)#2,629 |
| 49. | Haysi | 16.7% | 3.2%(+13.5)#49 | 4.5%(+12.2)#2,670 |
| 50. | Clover | 16.7% | 3.2%(+13.5)#50 | 4.5%(+12.2)#2,671 |
| 51. | Bedford | 16.6% | 3.2%(+13.4)#51 | 4.5%(+12.1)#2,718 |
| 52. | Bailey S Crossroads | 16.4% | 3.2%(+13.2)#52 | 4.5%(+11.9)#2,754 |
| 53. | Temperanceville | 16.4% | 3.2%(+13.2)#53 | 4.5%(+11.9)#2,758 |
| 54. | Troutdale | 16.1% | 3.2%(+12.9)#54 | 4.5%(+11.7)#2,810 |
| 55. | Rose Hill Cdp Lee County | 16.1% | 3.2%(+12.9)#55 | 4.5%(+11.6)#2,819 |
| 56. | Toms Brook | 15.6% | 3.2%(+12.4)#56 | 4.5%(+11.2)#2,937 |
| 57. | Blackstone | 15.3% | 3.2%(+12.1)#57 | 4.5%(+10.8)#3,019 |
| 58. | Bassett | 15.2% | 3.2%(+12.0)#58 | 4.5%(+10.8)#3,034 |
| 59. | Brookneal | 14.5% | 3.2%(+11.3)#59 | 4.5%(+10.00)#3,245 |
| 60. | Edinburg | 14.5% | 3.2%(+11.2)#60 | 4.5%(+9.99)#3,247 |
| 61. | Shenandoah Shores | 14.2% | 3.2%(+11.0)#61 | 4.5%(+9.73)#3,348 |
| 62. | Keezletown | 14.0% | 3.2%(+10.8)#62 | 4.5%(+9.54)#3,401 |
| 63. | Seven Mile Ford | 13.8% | 3.2%(+10.6)#63 | 4.5%(+9.33)#3,454 |
| 64. | Wytheville | 13.7% | 3.2%(+10.5)#64 | 4.5%(+9.24)#3,485 |
| 65. | Wise | 13.4% | 3.2%(+10.2)#65 | 4.5%(+8.97)#3,584 |
| 66. | Sherando | 13.3% | 3.2%(+10.1)#66 | 4.5%(+8.87)#3,621 |
| 67. | Capron | 13.0% | 3.2%(+9.84)#67 | 4.5%(+8.58)#3,742 |
| 68. | Clifton Forge | 12.7% | 3.2%(+9.48)#68 | 4.5%(+8.23)#3,858 |
| 69. | Baywood | 12.6% | 3.2%(+9.42)#69 | 4.5%(+8.17)#3,879 |
| 70. | Louisa | 12.1% | 3.2%(+8.88)#70 | 4.5%(+7.63)#4,130 |
| 71. | Appomattox | 12.1% | 3.2%(+8.88)#71 | 4.5%(+7.63)#4,133 |
| 72. | Nickelsville | 12.0% | 3.2%(+8.79)#72 | 4.5%(+7.54)#4,175 |
| 73. | Jonesville | 12.0% | 3.2%(+8.75)#73 | 4.5%(+7.49)#4,197 |
| 74. | Lawrenceville | 11.9% | 3.2%(+8.73)#74 | 4.5%(+7.48)#4,203 |
| 75. | Belview | 11.9% | 3.2%(+8.70)#75 | 4.5%(+7.44)#4,213 |
| 76. | Max Meadows | 11.4% | 3.2%(+8.18)#76 | 4.5%(+6.92)#4,453 |
| 77. | Melfa | 11.1% | 3.2%(+7.90)#77 | 4.5%(+6.65)#4,570 |
| 78. | Martinsville | 11.0% | 3.2%(+7.84)#78 | 4.5%(+6.59)#4,634 |
| 79. | Crewe | 10.9% | 3.2%(+7.71)#79 | 4.5%(+6.46)#4,699 |
| 80. | Galax | 10.5% | 3.2%(+7.30)#80 | 4.5%(+6.04)#4,944 |
| 81. | Gordonsville | 10.4% | 3.2%(+7.23)#81 | 4.5%(+5.97)#4,989 |
| 82. | Exmore | 10.4% | 3.2%(+7.17)#82 | 4.5%(+5.92)#5,023 |
| 83. | Hybla Valley | 10.4% | 3.2%(+7.17)#83 | 4.5%(+5.91)#5,027 |
| 84. | Adwolf | 10.2% | 3.2%(+7.02)#84 | 4.5%(+5.77)#5,108 |
| 85. | Raven | 10.0% | 3.2%(+6.79)#85 | 4.5%(+5.54)#5,223 |
| 86. | Eastville | 10.0% | 3.2%(+6.79)#86 | 4.5%(+5.54)#5,244 |
| 87. | Seven Corners | 9.9% | 3.2%(+6.73)#87 | 4.5%(+5.48)#5,305 |
| 88. | Highland Springs | 9.9% | 3.2%(+6.68)#88 | 4.5%(+5.42)#5,334 |
| 89. | Cedar Bluff | 9.8% | 3.2%(+6.60)#89 | 4.5%(+5.34)#5,385 |
| 90. | Woodburn | 9.7% | 3.2%(+6.51)#90 | 4.5%(+5.25)#5,453 |
| 91. | Scottsburg | 9.5% | 3.2%(+6.32)#91 | 4.5%(+5.06)#5,571 |
| 92. | Goose Creek | 9.1% | 3.2%(+5.94)#92 | 4.5%(+4.69)#5,838 |
| 93. | Mineral | 9.1% | 3.2%(+5.88)#93 | 4.5%(+4.63)#5,878 |
| 94. | University Center | 9.1% | 3.2%(+5.86)#94 | 4.5%(+4.60)#5,939 |
| 95. | Bracey | 9.0% | 3.2%(+5.76)#95 | 4.5%(+4.51)#5,994 |
| 96. | Iron Gate | 8.8% | 3.2%(+5.58)#96 | 4.5%(+4.33)#6,133 |
| 97. | Potomac Mills | 8.8% | 3.2%(+5.58)#97 | 4.5%(+4.32)#6,136 |
| 98. | Hopewell | 8.7% | 3.2%(+5.46)#98 | 4.5%(+4.20)#6,222 |
| 99. | Bellwood | 8.6% | 3.2%(+5.41)#99 | 4.5%(+4.16)#6,253 |
| 100. | Riverdale | 8.4% | 3.2%(+5.18)#100 | 4.5%(+3.93)#6,405 |
Common Questions
What are the Top 10 Cities with the Highest Poverty Level Among Married Couples in Virginia?
Top 10 Cities with the Highest Poverty Level Among Married Couples in Virginia are:
#1
100.0%
#2
74.0%
#3
71.4%
#4
67.5%
#5
63.3%
#6
62.5%
#7
55.9%
#8
51.7%
#9
48.5%
#10
37.9%
What city has the Highest Poverty Level Among Married Couples in Virginia?
Lee Mont has the Highest Poverty Level Among Married Couples in Virginia with 100.0%.
What is the Poverty Level Among Married Couples in the State of Virginia?
Poverty Level Among Married Couples in Virginia is 3.2%.
What is the Poverty Level Among Married Couples in the United States?
Poverty Level Among Married Couples in the United States is 4.5%.