Cities with the Highest Poverty Level Among Married Couples in Indiana
RELATED REPORTS & OPTIONS
Highest Poverty | Married Couple
Indiana
Compare Cities
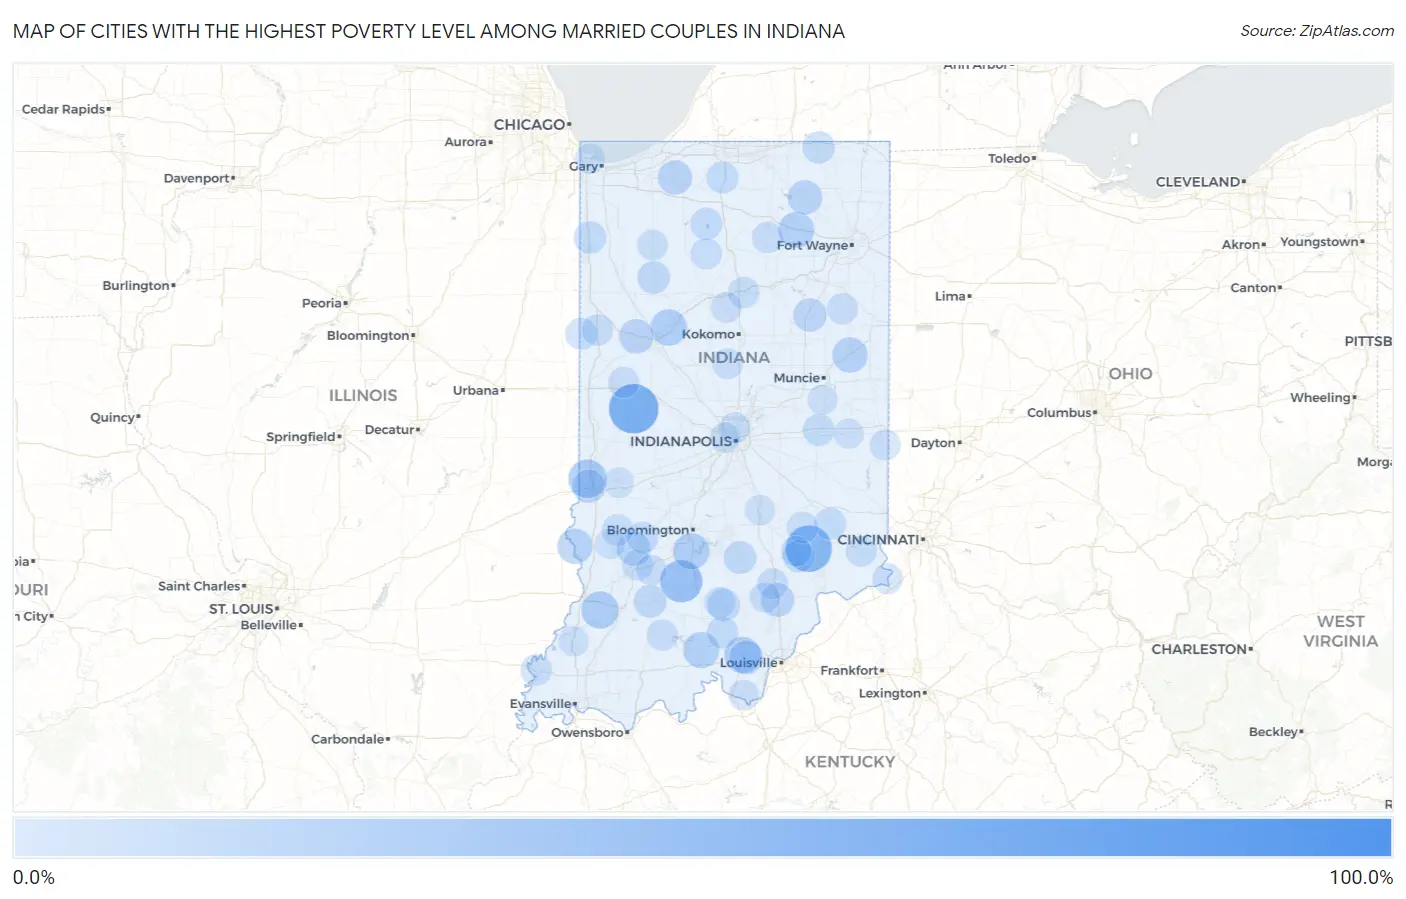
Map of Cities with the Highest Poverty Level Among Married Couples in Indiana
0.0%
100.0%
Cities with the Highest Poverty Level Among Married Couples in Indiana
| City | Married Couples Poverty | vs State | vs National | |
| 1. | Millville | 100.0% | 3.7%(+96.3)#1 | 4.5%(+95.5)#29 |
| 2. | Centerton | 100.0% | 3.7%(+96.3)#2 | 4.5%(+95.5)#31 |
| 3. | Royerton | 100.0% | 3.7%(+96.3)#3 | 4.5%(+95.5)#33 |
| 4. | Linn Grove | 100.0% | 3.7%(+96.3)#4 | 4.5%(+95.5)#51 |
| 5. | Otisco | 100.0% | 3.7%(+96.3)#5 | 4.5%(+95.5)#52 |
| 6. | Hobbs | 100.0% | 3.7%(+96.3)#6 | 4.5%(+95.5)#63 |
| 7. | Penntown | 100.0% | 3.7%(+96.3)#7 | 4.5%(+95.5)#69 |
| 8. | Alamo | 66.7% | 3.7%(+62.9)#8 | 4.5%(+62.2)#192 |
| 9. | Adams | 64.3% | 3.7%(+60.6)#9 | 4.5%(+59.8)#213 |
| 10. | Amity | 57.5% | 3.7%(+53.8)#10 | 4.5%(+53.0)#297 |
| 11. | Butlerville | 57.4% | 3.7%(+53.7)#11 | 4.5%(+52.9)#298 |
| 12. | Arthur | 46.9% | 3.7%(+43.2)#12 | 4.5%(+42.4)#449 |
| 13. | Nyona Lake | 46.2% | 3.7%(+42.4)#13 | 4.5%(+41.7)#465 |
| 14. | Eugene | 46.2% | 3.7%(+42.4)#14 | 4.5%(+41.7)#466 |
| 15. | Williams | 45.9% | 3.7%(+42.2)#15 | 4.5%(+41.5)#474 |
| 16. | Scott | 44.4% | 3.7%(+40.7)#16 | 4.5%(+40.0)#499 |
| 17. | Cates | 41.2% | 3.7%(+37.5)#17 | 4.5%(+36.7)#588 |
| 18. | Billtown | 38.5% | 3.7%(+34.7)#18 | 4.5%(+34.0)#687 |
| 19. | Bippus | 37.9% | 3.7%(+34.2)#19 | 4.5%(+33.5)#707 |
| 20. | Grantsburg | 34.5% | 3.7%(+30.8)#20 | 4.5%(+30.0)#826 |
| 21. | St Mary Of The Woods | 34.4% | 3.7%(+30.7)#21 | 4.5%(+29.9)#829 |
| 22. | St. Omer | 32.1% | 3.7%(+28.4)#22 | 4.5%(+27.7)#931 |
| 23. | Monroe City | 31.3% | 3.7%(+27.6)#23 | 4.5%(+26.9)#963 |
| 24. | New Salisbury | 29.4% | 3.7%(+25.7)#24 | 4.5%(+24.9)#1,061 |
| 25. | Americus | 28.9% | 3.7%(+25.2)#25 | 4.5%(+24.4)#1,089 |
| 26. | Harrodsburg | 28.7% | 3.7%(+25.0)#26 | 4.5%(+24.2)#1,102 |
| 27. | Blairsville | 27.9% | 3.7%(+24.2)#27 | 4.5%(+23.4)#1,175 |
| 28. | English | 27.9% | 3.7%(+24.1)#28 | 4.5%(+23.4)#1,178 |
| 29. | Larwill | 27.7% | 3.7%(+24.0)#29 | 4.5%(+23.2)#1,193 |
| 30. | Thayer | 27.1% | 3.7%(+23.4)#30 | 4.5%(+22.6)#1,237 |
| 31. | Alford | 27.0% | 3.7%(+23.3)#31 | 4.5%(+22.6)#1,244 |
| 32. | Leiters Ford | 26.1% | 3.7%(+22.4)#32 | 4.5%(+21.6)#1,322 |
| 33. | Redkey | 25.9% | 3.7%(+22.2)#33 | 4.5%(+21.5)#1,335 |
| 34. | Merom | 25.6% | 3.7%(+21.9)#34 | 4.5%(+21.2)#1,370 |
| 35. | Chain-O-Lakes | 25.3% | 3.7%(+21.5)#35 | 4.5%(+20.8)#1,389 |
| 36. | Willow Branch | 25.0% | 3.7%(+21.3)#36 | 4.5%(+20.5)#1,437 |
| 37. | Wolflake | 23.9% | 3.7%(+20.2)#37 | 4.5%(+19.5)#1,559 |
| 38. | Kimmell | 23.2% | 3.7%(+19.5)#38 | 4.5%(+18.7)#1,640 |
| 39. | Montmorenci | 23.2% | 3.7%(+19.4)#39 | 4.5%(+18.7)#1,642 |
| 40. | Kingsbury | 23.0% | 3.7%(+19.2)#40 | 4.5%(+18.5)#1,669 |
| 41. | Switz City | 22.0% | 3.7%(+18.2)#41 | 4.5%(+17.5)#1,805 |
| 42. | Crandall | 21.9% | 3.7%(+18.2)#42 | 4.5%(+17.4)#1,814 |
| 43. | Scottsburg | 21.0% | 3.7%(+17.3)#43 | 4.5%(+16.6)#1,905 |
| 44. | Van Buren | 20.8% | 3.7%(+17.1)#44 | 4.5%(+16.4)#1,927 |
| 45. | Lake Holiday Hideaway | 20.8% | 3.7%(+17.0)#45 | 4.5%(+16.3)#1,936 |
| 46. | West Terre Haute | 20.6% | 3.7%(+16.8)#46 | 4.5%(+16.1)#1,973 |
| 47. | Andersonville | 20.5% | 3.7%(+16.8)#47 | 4.5%(+16.1)#1,975 |
| 48. | Flat Rock | 20.0% | 3.7%(+16.3)#48 | 4.5%(+15.5)#2,053 |
| 49. | Loogootee | 19.5% | 3.7%(+15.7)#49 | 4.5%(+15.0)#2,141 |
| 50. | Freetown | 18.8% | 3.7%(+15.0)#50 | 4.5%(+14.3)#2,257 |
| 51. | Monon | 18.5% | 3.7%(+14.8)#51 | 4.5%(+14.1)#2,295 |
| 52. | Campbellsburg | 18.0% | 3.7%(+14.3)#52 | 4.5%(+13.5)#2,408 |
| 53. | Lake Village | 17.9% | 3.7%(+14.2)#53 | 4.5%(+13.5)#2,417 |
| 54. | Vernon | 17.6% | 3.7%(+13.9)#54 | 4.5%(+13.2)#2,480 |
| 55. | Howe | 17.5% | 3.7%(+13.7)#55 | 4.5%(+13.0)#2,523 |
| 56. | Wadesville | 17.1% | 3.7%(+13.4)#56 | 4.5%(+12.7)#2,583 |
| 57. | Abington | 17.1% | 3.7%(+13.4)#57 | 4.5%(+12.6)#2,598 |
| 58. | Culver | 17.0% | 3.7%(+13.2)#58 | 4.5%(+12.5)#2,627 |
| 59. | Spiceland | 16.5% | 3.7%(+12.8)#59 | 4.5%(+12.0)#2,732 |
| 60. | Napoleon | 16.3% | 3.7%(+12.6)#60 | 4.5%(+11.9)#2,766 |
| 61. | Lakeville | 16.2% | 3.7%(+12.5)#61 | 4.5%(+11.7)#2,794 |
| 62. | Forest | 15.8% | 3.7%(+12.1)#62 | 4.5%(+11.3)#2,890 |
| 63. | Worthington | 15.6% | 3.7%(+11.9)#63 | 4.5%(+11.2)#2,932 |
| 64. | Ambia | 15.6% | 3.7%(+11.9)#64 | 4.5%(+11.2)#2,939 |
| 65. | Hardinsburg | 15.4% | 3.7%(+11.7)#65 | 4.5%(+10.9)#3,002 |
| 66. | Jasonville | 15.2% | 3.7%(+11.4)#66 | 4.5%(+10.7)#3,049 |
| 67. | Boswell | 15.2% | 3.7%(+11.4)#67 | 4.5%(+10.7)#3,052 |
| 68. | Westport | 14.9% | 3.7%(+11.2)#68 | 4.5%(+10.5)#3,098 |
| 69. | Mellott | 14.8% | 3.7%(+11.1)#69 | 4.5%(+10.4)#3,133 |
| 70. | Griffin | 14.8% | 3.7%(+11.1)#70 | 4.5%(+10.4)#3,136 |
| 71. | Peru | 14.7% | 3.7%(+10.9)#71 | 4.5%(+10.2)#3,185 |
| 72. | Kewanna | 14.3% | 3.7%(+10.6)#72 | 4.5%(+9.82)#3,287 |
| 73. | Claypool | 14.3% | 3.7%(+10.6)#73 | 4.5%(+9.82)#3,295 |
| 74. | Anoka | 14.3% | 3.7%(+10.6)#74 | 4.5%(+9.82)#3,298 |
| 75. | Poneto | 14.3% | 3.7%(+10.6)#75 | 4.5%(+9.82)#3,309 |
| 76. | Saltillo | 14.3% | 3.7%(+10.6)#76 | 4.5%(+9.82)#3,311 |
| 77. | Dubois | 14.0% | 3.7%(+10.3)#77 | 4.5%(+9.52)#3,405 |
| 78. | Crothersville | 13.9% | 3.7%(+10.2)#78 | 4.5%(+9.41)#3,433 |
| 79. | Dillsboro | 13.8% | 3.7%(+10.1)#79 | 4.5%(+9.36)#3,449 |
| 80. | Kempton | 13.6% | 3.7%(+9.91)#80 | 4.5%(+9.17)#3,507 |
| 81. | Medaryville | 13.5% | 3.7%(+9.82)#81 | 4.5%(+9.08)#3,543 |
| 82. | Boston | 13.5% | 3.7%(+9.79)#82 | 4.5%(+9.05)#3,555 |
| 83. | Celestine | 13.4% | 3.7%(+9.66)#83 | 4.5%(+8.92)#3,597 |
| 84. | Walton | 13.4% | 3.7%(+9.65)#84 | 4.5%(+8.91)#3,601 |
| 85. | Newberry | 13.3% | 3.7%(+9.61)#85 | 4.5%(+8.87)#3,627 |
| 86. | Patriot | 13.0% | 3.7%(+9.32)#86 | 4.5%(+8.58)#3,737 |
| 87. | Wyatt | 13.0% | 3.7%(+9.32)#87 | 4.5%(+8.58)#3,739 |
| 88. | North Vernon | 12.5% | 3.7%(+8.80)#88 | 4.5%(+8.06)#3,912 |
| 89. | Little York | 12.5% | 3.7%(+8.78)#89 | 4.5%(+8.04)#3,940 |
| 90. | Crows Nest | 12.5% | 3.7%(+8.78)#90 | 4.5%(+8.04)#3,959 |
| 91. | Laconia | 12.5% | 3.7%(+8.78)#91 | 4.5%(+8.04)#3,970 |
| 92. | Crane | 12.3% | 3.7%(+8.56)#92 | 4.5%(+7.82)#4,045 |
| 93. | Staunton | 12.2% | 3.7%(+8.47)#93 | 4.5%(+7.73)#4,072 |
| 94. | Taylorsville | 12.1% | 3.7%(+8.42)#94 | 4.5%(+7.68)#4,102 |
| 95. | Speedway | 12.1% | 3.7%(+8.37)#95 | 4.5%(+7.63)#4,131 |
| 96. | Cambridge City | 12.0% | 3.7%(+8.29)#96 | 4.5%(+7.55)#4,163 |
| 97. | East Chicago | 11.8% | 3.7%(+8.10)#97 | 4.5%(+7.36)#4,250 |
| 98. | Dugger | 11.5% | 3.7%(+7.82)#98 | 4.5%(+7.08)#4,383 |
| 99. | Springport | 11.5% | 3.7%(+7.82)#99 | 4.5%(+7.08)#4,391 |
| 100. | Patoka | 11.5% | 3.7%(+7.79)#100 | 4.5%(+7.05)#4,400 |
Common Questions
What are the Top 10 Cities with the Highest Poverty Level Among Married Couples in Indiana?
Top 10 Cities with the Highest Poverty Level Among Married Couples in Indiana are:
#1
66.7%
#2
57.4%
#3
45.9%
#4
34.4%
#5
31.3%
#6
29.4%
#7
28.9%
#8
28.7%
#9
27.9%
#10
27.7%
What city has the Highest Poverty Level Among Married Couples in Indiana?
Alamo has the Highest Poverty Level Among Married Couples in Indiana with 66.7%.
What is the Poverty Level Among Married Couples in the State of Indiana?
Poverty Level Among Married Couples in Indiana is 3.7%.
What is the Poverty Level Among Married Couples in the United States?
Poverty Level Among Married Couples in the United States is 4.5%.