Cities with the Highest Poverty Level Among Married Couples in Louisiana
RELATED REPORTS & OPTIONS
Highest Poverty | Married Couple
Louisiana
Compare Cities
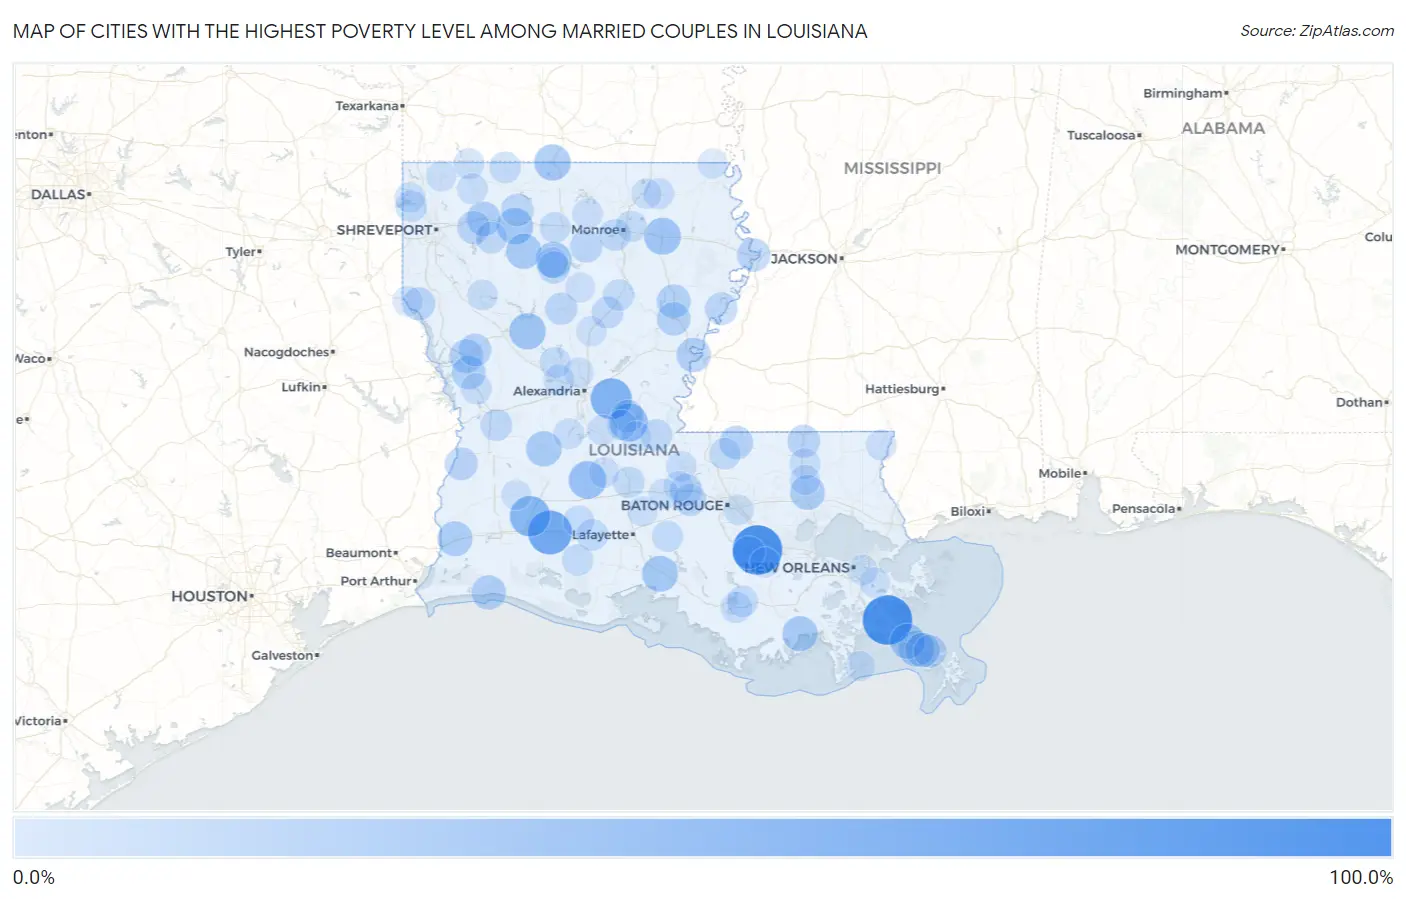
Map of Cities with the Highest Poverty Level Among Married Couples in Louisiana
0.0%
100.0%
Cities with the Highest Poverty Level Among Married Couples in Louisiana
| City | Married Couples Poverty | vs State | vs National | |
| 1. | Lemannville | 100.0% | 5.7%(+94.3)#1 | 4.5%(+95.5)#5 |
| 2. | Pointe A La Hache | 100.0% | 5.7%(+94.3)#2 | 4.5%(+95.5)#17 |
| 3. | Roanoke | 74.1% | 5.7%(+68.4)#3 | 4.5%(+69.6)#152 |
| 4. | Center Point | 61.6% | 5.7%(+56.0)#4 | 4.5%(+57.2)#245 |
| 5. | Fenton | 58.3% | 5.7%(+52.7)#5 | 4.5%(+53.9)#288 |
| 6. | Centerville | 56.9% | 5.7%(+51.2)#6 | 4.5%(+52.5)#304 |
| 7. | Mansura | 48.3% | 5.7%(+42.6)#7 | 4.5%(+43.9)#421 |
| 8. | Mamou | 46.0% | 5.7%(+40.3)#8 | 4.5%(+41.5)#472 |
| 9. | Rayville | 42.1% | 5.7%(+36.4)#9 | 4.5%(+37.6)#570 |
| 10. | St Maurice | 40.0% | 5.7%(+34.3)#10 | 4.5%(+35.5)#617 |
| 11. | Gibsland | 39.6% | 5.7%(+33.9)#11 | 4.5%(+35.2)#645 |
| 12. | North Hodge | 39.4% | 5.7%(+33.7)#12 | 4.5%(+34.9)#657 |
| 13. | Junction City | 39.3% | 5.7%(+33.7)#13 | 4.5%(+34.9)#660 |
| 14. | Lydia | 38.2% | 5.7%(+32.5)#14 | 4.5%(+33.7)#700 |
| 15. | Buras | 36.6% | 5.7%(+30.9)#15 | 4.5%(+32.1)#752 |
| 16. | Elizabeth | 35.3% | 5.7%(+29.6)#16 | 4.5%(+30.8)#790 |
| 17. | Bienville | 35.3% | 5.7%(+29.6)#17 | 4.5%(+30.8)#791 |
| 18. | Montegut | 34.9% | 5.7%(+29.3)#18 | 4.5%(+30.5)#806 |
| 19. | Empire | 34.5% | 5.7%(+28.8)#19 | 4.5%(+30.0)#828 |
| 20. | Vinton | 33.7% | 5.7%(+28.0)#20 | 4.5%(+29.2)#859 |
| 21. | Natalbany | 33.1% | 5.7%(+27.5)#21 | 4.5%(+28.7)#903 |
| 22. | Triumph | 31.0% | 5.7%(+25.4)#22 | 4.5%(+26.6)#982 |
| 23. | Cameron | 31.0% | 5.7%(+25.4)#23 | 4.5%(+26.6)#983 |
| 24. | Minorca | 30.9% | 5.7%(+25.2)#24 | 4.5%(+26.4)#989 |
| 25. | Dixie Inn | 30.0% | 5.7%(+24.3)#25 | 4.5%(+25.5)#1,026 |
| 26. | Many | 29.0% | 5.7%(+23.3)#26 | 4.5%(+24.5)#1,082 |
| 27. | Wisner | 28.9% | 5.7%(+23.2)#27 | 4.5%(+24.4)#1,085 |
| 28. | Florien | 28.9% | 5.7%(+23.2)#28 | 4.5%(+24.4)#1,087 |
| 29. | Sicily Island | 27.7% | 5.7%(+22.0)#29 | 4.5%(+23.2)#1,198 |
| 30. | Wilson | 27.6% | 5.7%(+21.9)#30 | 4.5%(+23.2)#1,203 |
| 31. | Delta | 26.3% | 5.7%(+20.6)#31 | 4.5%(+21.9)#1,305 |
| 32. | Doyline | 25.2% | 5.7%(+19.5)#32 | 4.5%(+20.7)#1,393 |
| 33. | Stanley | 25.0% | 5.7%(+19.3)#33 | 4.5%(+20.5)#1,442 |
| 34. | Merryville | 24.8% | 5.7%(+19.1)#34 | 4.5%(+20.3)#1,470 |
| 35. | Fort Jesup | 24.2% | 5.7%(+18.5)#35 | 4.5%(+19.7)#1,529 |
| 36. | Kentwood | 24.1% | 5.7%(+18.4)#36 | 4.5%(+19.6)#1,539 |
| 37. | Donaldsonville | 24.1% | 5.7%(+18.4)#37 | 4.5%(+19.6)#1,540 |
| 38. | Boothville | 23.9% | 5.7%(+18.3)#38 | 4.5%(+19.5)#1,560 |
| 39. | Marksville | 23.9% | 5.7%(+18.2)#39 | 4.5%(+19.4)#1,565 |
| 40. | Athens | 23.8% | 5.7%(+18.1)#40 | 4.5%(+19.3)#1,572 |
| 41. | St Joseph | 23.5% | 5.7%(+17.8)#41 | 4.5%(+19.0)#1,618 |
| 42. | Eros | 22.9% | 5.7%(+17.2)#42 | 4.5%(+18.4)#1,677 |
| 43. | Jonesboro | 22.3% | 5.7%(+16.7)#43 | 4.5%(+17.9)#1,736 |
| 44. | Winnfield | 22.0% | 5.7%(+16.3)#44 | 4.5%(+17.5)#1,802 |
| 45. | Livonia | 21.8% | 5.7%(+16.2)#45 | 4.5%(+17.4)#1,819 |
| 46. | Maringouin | 21.5% | 5.7%(+15.8)#46 | 4.5%(+17.0)#1,856 |
| 47. | Fort Polk South | 20.4% | 5.7%(+14.7)#47 | 4.5%(+16.0)#1,993 |
| 48. | Simmesport | 20.3% | 5.7%(+14.6)#48 | 4.5%(+15.8)#2,003 |
| 49. | Olla | 20.3% | 5.7%(+14.6)#49 | 4.5%(+15.8)#2,007 |
| 50. | Bawcomville | 20.0% | 5.7%(+14.3)#50 | 4.5%(+15.5)#2,024 |
| 51. | Heflin | 19.6% | 5.7%(+14.0)#51 | 4.5%(+15.2)#2,116 |
| 52. | Jackson | 19.5% | 5.7%(+13.9)#52 | 4.5%(+15.1)#2,133 |
| 53. | Haynesville | 18.9% | 5.7%(+13.2)#53 | 4.5%(+14.4)#2,235 |
| 54. | Mooringsport | 18.6% | 5.7%(+12.9)#54 | 4.5%(+14.1)#2,285 |
| 55. | Washington | 18.4% | 5.7%(+12.7)#55 | 4.5%(+14.0)#2,319 |
| 56. | Crowley | 18.3% | 5.7%(+12.7)#56 | 4.5%(+13.9)#2,333 |
| 57. | Gueydan | 18.1% | 5.7%(+12.5)#57 | 4.5%(+13.7)#2,384 |
| 58. | Clarks | 18.1% | 5.7%(+12.4)#58 | 4.5%(+13.6)#2,398 |
| 59. | Amelia | 17.9% | 5.7%(+12.2)#59 | 4.5%(+13.4)#2,433 |
| 60. | Bayou L Ourse | 17.6% | 5.7%(+11.9)#60 | 4.5%(+13.2)#2,488 |
| 61. | Catahoula | 17.5% | 5.7%(+11.9)#61 | 4.5%(+13.1)#2,509 |
| 62. | Colfax | 17.2% | 5.7%(+11.5)#62 | 4.5%(+12.7)#2,575 |
| 63. | Iota | 16.9% | 5.7%(+11.3)#63 | 4.5%(+12.5)#2,634 |
| 64. | Grambling | 16.8% | 5.7%(+11.1)#64 | 4.5%(+12.3)#2,656 |
| 65. | Roseland | 16.6% | 5.7%(+10.9)#65 | 4.5%(+12.1)#2,719 |
| 66. | Hornbeck | 16.5% | 5.7%(+10.8)#66 | 4.5%(+12.0)#2,727 |
| 67. | Springhill | 16.2% | 5.7%(+10.5)#67 | 4.5%(+11.7)#2,798 |
| 68. | Cotton Valley | 16.0% | 5.7%(+10.3)#68 | 4.5%(+11.5)#2,834 |
| 69. | Mcnary | 16.0% | 5.7%(+10.3)#69 | 4.5%(+11.5)#2,845 |
| 70. | Lakeshore | 15.8% | 5.7%(+10.2)#70 | 4.5%(+11.4)#2,874 |
| 71. | Boyce | 15.7% | 5.7%(+10.0)#71 | 4.5%(+11.3)#2,918 |
| 72. | Coushatta | 15.6% | 5.7%(+9.97)#72 | 4.5%(+11.2)#2,930 |
| 73. | Mer Rouge | 15.3% | 5.7%(+9.63)#73 | 4.5%(+10.8)#3,017 |
| 74. | Hodge | 15.2% | 5.7%(+9.48)#74 | 4.5%(+10.7)#3,053 |
| 75. | Cheneyville | 15.0% | 5.7%(+9.33)#75 | 4.5%(+10.5)#3,083 |
| 76. | Downsville | 14.7% | 5.7%(+9.03)#76 | 4.5%(+10.2)#3,174 |
| 77. | Varnado | 14.5% | 5.7%(+8.87)#77 | 4.5%(+10.1)#3,219 |
| 78. | Oil City | 14.5% | 5.7%(+8.80)#78 | 4.5%(+10.0)#3,237 |
| 79. | Perry | 14.3% | 5.7%(+8.66)#79 | 4.5%(+9.88)#3,272 |
| 80. | Morganza | 14.3% | 5.7%(+8.61)#80 | 4.5%(+9.82)#3,288 |
| 81. | Arabi | 14.2% | 5.7%(+8.49)#81 | 4.5%(+9.71)#3,356 |
| 82. | Independence | 14.1% | 5.7%(+8.45)#82 | 4.5%(+9.66)#3,367 |
| 83. | St James | 14.0% | 5.7%(+8.38)#83 | 4.5%(+9.59)#3,390 |
| 84. | Fordoche | 13.9% | 5.7%(+8.27)#84 | 4.5%(+9.48)#3,413 |
| 85. | Westminster | 13.9% | 5.7%(+8.21)#85 | 4.5%(+9.42)#3,429 |
| 86. | Ville Platte | 13.9% | 5.7%(+8.20)#86 | 4.5%(+9.41)#3,434 |
| 87. | Bastrop | 13.8% | 5.7%(+8.10)#87 | 4.5%(+9.31)#3,467 |
| 88. | Prospect | 13.6% | 5.7%(+7.96)#88 | 4.5%(+9.17)#3,509 |
| 89. | Plaucheville | 13.6% | 5.7%(+7.96)#89 | 4.5%(+9.17)#3,510 |
| 90. | Plain Dealing | 13.5% | 5.7%(+7.84)#90 | 4.5%(+9.05)#3,549 |
| 91. | Georgetown | 13.5% | 5.7%(+7.84)#91 | 4.5%(+9.05)#3,556 |
| 92. | Reeves | 13.5% | 5.7%(+7.84)#92 | 4.5%(+9.05)#3,558 |
| 93. | Logansport | 13.5% | 5.7%(+7.81)#93 | 4.5%(+9.03)#3,564 |
| 94. | Hessmer | 13.4% | 5.7%(+7.73)#94 | 4.5%(+8.94)#3,592 |
| 95. | Arnaudville | 13.3% | 5.7%(+7.66)#95 | 4.5%(+8.87)#3,606 |
| 96. | Sikes | 13.3% | 5.7%(+7.66)#96 | 4.5%(+8.87)#3,620 |
| 97. | Krotz Springs | 13.3% | 5.7%(+7.61)#97 | 4.5%(+8.82)#3,650 |
| 98. | Kilbourne | 13.2% | 5.7%(+7.55)#98 | 4.5%(+8.76)#3,657 |
| 99. | Grand Isle | 13.2% | 5.7%(+7.50)#99 | 4.5%(+8.71)#3,671 |
| 100. | Poydras | 13.0% | 5.7%(+7.34)#100 | 4.5%(+8.56)#3,747 |
Common Questions
What are the Top 10 Cities with the Highest Poverty Level Among Married Couples in Louisiana?
Top 10 Cities with the Highest Poverty Level Among Married Couples in Louisiana are:
#1
100.0%
#2
100.0%
#3
74.1%
#4
61.6%
#5
58.3%
#6
48.3%
#7
46.0%
#8
42.1%
#9
40.0%
#10
39.6%
What city has the Highest Poverty Level Among Married Couples in Louisiana?
Lemannville has the Highest Poverty Level Among Married Couples in Louisiana with 100.0%.
What is the Poverty Level Among Married Couples in the State of Louisiana?
Poverty Level Among Married Couples in Louisiana is 5.7%.
What is the Poverty Level Among Married Couples in the United States?
Poverty Level Among Married Couples in the United States is 4.5%.