Cities with the Highest Poverty Level Among Married Couples in Illinois
RELATED REPORTS & OPTIONS
Highest Poverty | Married Couple
Illinois
Compare Cities
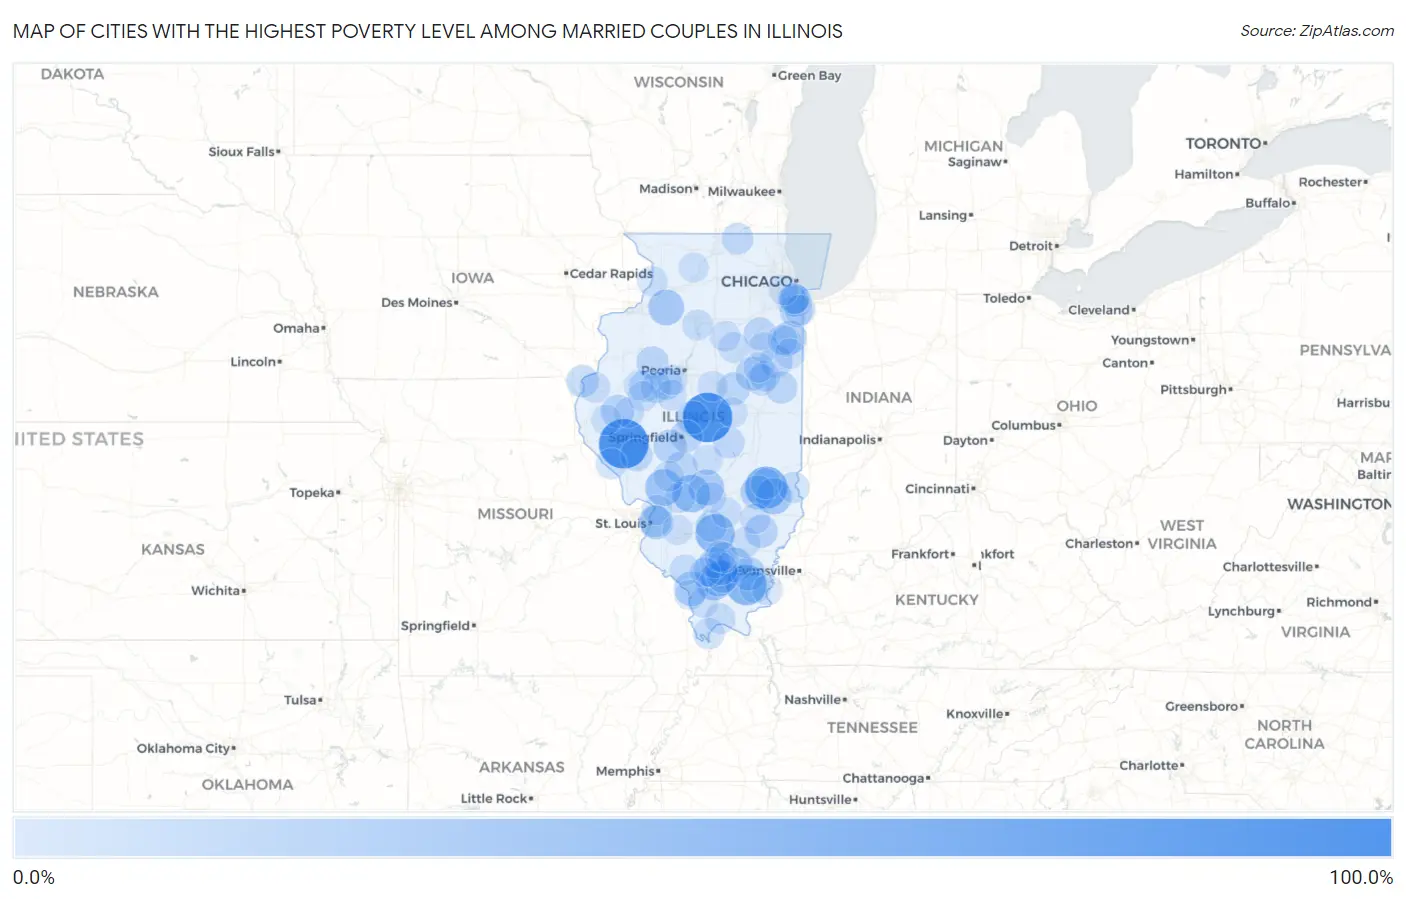
Map of Cities with the Highest Poverty Level Among Married Couples in Illinois
0.0%
100.0%
Cities with the Highest Poverty Level Among Married Couples in Illinois
| City | Married Couples Poverty | vs State | vs National | |
| 1. | Ophiem | 100.0% | 3.8%(+96.2)#1 | 4.5%(+95.5)#30 |
| 2. | Chestnut | 100.0% | 3.8%(+96.2)#2 | 4.5%(+95.5)#35 |
| 3. | Alden | 100.0% | 3.8%(+96.2)#3 | 4.5%(+95.5)#36 |
| 4. | Valley City | 100.0% | 3.8%(+96.2)#4 | 4.5%(+95.5)#86 |
| 5. | Serena | 78.3% | 3.8%(+74.5)#5 | 4.5%(+73.8)#137 |
| 6. | Rose Hill | 66.7% | 3.8%(+62.9)#6 | 4.5%(+62.2)#195 |
| 7. | Muddy | 58.3% | 3.8%(+54.6)#7 | 4.5%(+53.9)#290 |
| 8. | Walnut Hill | 53.3% | 3.8%(+49.6)#8 | 4.5%(+48.9)#342 |
| 9. | Illinois | 52.6% | 3.8%(+48.9)#9 | 4.5%(+48.2)#356 |
| 10. | Donnellson | 45.5% | 3.8%(+41.7)#10 | 4.5%(+41.0)#482 |
| 11. | Royal Lakes | 42.9% | 3.8%(+39.1)#11 | 4.5%(+38.4)#536 |
| 12. | Willow Hill | 39.5% | 3.8%(+35.7)#12 | 4.5%(+35.0)#654 |
| 13. | Colp | 37.5% | 3.8%(+33.7)#13 | 4.5%(+33.0)#718 |
| 14. | Hooppole | 37.5% | 3.8%(+33.7)#14 | 4.5%(+33.0)#719 |
| 15. | Bingham | 37.5% | 3.8%(+33.7)#15 | 4.5%(+33.0)#721 |
| 16. | Freeman Spur | 36.0% | 3.8%(+32.2)#16 | 4.5%(+31.5)#769 |
| 17. | Macedonia | 33.3% | 3.8%(+29.6)#17 | 4.5%(+28.9)#897 |
| 18. | Lowpoint | 32.5% | 3.8%(+28.7)#18 | 4.5%(+28.0)#920 |
| 19. | Gorham | 31.6% | 3.8%(+27.8)#19 | 4.5%(+27.1)#951 |
| 20. | Mulkeytown | 30.8% | 3.8%(+27.0)#20 | 4.5%(+26.3)#998 |
| 21. | Wheeler | 30.0% | 3.8%(+26.2)#21 | 4.5%(+25.5)#1,028 |
| 22. | Washington Park | 29.6% | 3.8%(+25.9)#22 | 4.5%(+25.2)#1,053 |
| 23. | Strawn | 28.6% | 3.8%(+24.8)#23 | 4.5%(+24.1)#1,116 |
| 24. | Broughton | 28.1% | 3.8%(+24.4)#24 | 4.5%(+23.7)#1,154 |
| 25. | Sun River Terrace | 27.5% | 3.8%(+23.7)#25 | 4.5%(+23.0)#1,208 |
| 26. | Loami | 27.3% | 3.8%(+23.6)#26 | 4.5%(+22.9)#1,218 |
| 27. | Broadwell | 27.3% | 3.8%(+23.5)#27 | 4.5%(+22.8)#1,229 |
| 28. | Camden | 26.7% | 3.8%(+22.9)#28 | 4.5%(+22.2)#1,274 |
| 29. | West Frankfort | 26.6% | 3.8%(+22.8)#29 | 4.5%(+22.1)#1,283 |
| 30. | Mount Erie | 26.3% | 3.8%(+22.6)#30 | 4.5%(+21.9)#1,308 |
| 31. | South Chicago Heights | 25.0% | 3.8%(+21.2)#31 | 4.5%(+20.5)#1,398 |
| 32. | West City | 24.7% | 3.8%(+20.9)#32 | 4.5%(+20.2)#1,478 |
| 33. | Ellsworth | 24.4% | 3.8%(+20.7)#33 | 4.5%(+20.0)#1,499 |
| 34. | Danforth | 24.2% | 3.8%(+20.4)#34 | 4.5%(+19.7)#1,528 |
| 35. | Alsey | 24.1% | 3.8%(+20.4)#35 | 4.5%(+19.7)#1,535 |
| 36. | Waggoner | 24.0% | 3.8%(+20.2)#36 | 4.5%(+19.5)#1,552 |
| 37. | Nauvoo | 23.6% | 3.8%(+19.8)#37 | 4.5%(+19.1)#1,597 |
| 38. | Maquon | 23.5% | 3.8%(+19.8)#38 | 4.5%(+19.1)#1,604 |
| 39. | East Brooklyn | 23.5% | 3.8%(+19.8)#39 | 4.5%(+19.1)#1,614 |
| 40. | Clear Lake | 23.0% | 3.8%(+19.2)#40 | 4.5%(+18.5)#1,668 |
| 41. | Rankin | 22.4% | 3.8%(+18.7)#41 | 4.5%(+18.0)#1,727 |
| 42. | Fairmont City | 22.3% | 3.8%(+18.6)#42 | 4.5%(+17.9)#1,737 |
| 43. | Banner | 22.2% | 3.8%(+18.5)#43 | 4.5%(+17.8)#1,755 |
| 44. | Smithfield | 21.6% | 3.8%(+17.9)#44 | 4.5%(+17.2)#1,843 |
| 45. | Cahokia Heights | 21.0% | 3.8%(+17.2)#45 | 4.5%(+16.5)#1,907 |
| 46. | Dalton City | 20.5% | 3.8%(+16.8)#46 | 4.5%(+16.1)#1,977 |
| 47. | Phoenix | 20.5% | 3.8%(+16.8)#47 | 4.5%(+16.1)#1,980 |
| 48. | Chemung | 20.4% | 3.8%(+16.6)#48 | 4.5%(+15.9)#1,995 |
| 49. | Junction City | 19.4% | 3.8%(+15.6)#49 | 4.5%(+14.9)#2,156 |
| 50. | Bryant | 18.6% | 3.8%(+14.8)#50 | 4.5%(+14.1)#2,286 |
| 51. | Mound City | 18.6% | 3.8%(+14.8)#51 | 4.5%(+14.1)#2,293 |
| 52. | Equality | 18.2% | 3.8%(+14.4)#52 | 4.5%(+13.7)#2,359 |
| 53. | Sesser | 17.9% | 3.8%(+14.2)#53 | 4.5%(+13.5)#2,425 |
| 54. | Hutsonville | 17.9% | 3.8%(+14.1)#54 | 4.5%(+13.4)#2,436 |
| 55. | Willisville | 17.7% | 3.8%(+14.0)#55 | 4.5%(+13.3)#2,466 |
| 56. | Markham | 17.6% | 3.8%(+13.8)#56 | 4.5%(+13.1)#2,489 |
| 57. | Melvin | 17.6% | 3.8%(+13.8)#57 | 4.5%(+13.1)#2,502 |
| 58. | Pleasant Hill | 17.5% | 3.8%(+13.7)#58 | 4.5%(+13.0)#2,522 |
| 59. | Dixmoor | 17.2% | 3.8%(+13.5)#59 | 4.5%(+12.8)#2,569 |
| 60. | Nason | 17.1% | 3.8%(+13.3)#60 | 4.5%(+12.6)#2,602 |
| 61. | Cornell | 16.9% | 3.8%(+13.1)#61 | 4.5%(+12.4)#2,643 |
| 62. | Karnak | 16.7% | 3.8%(+12.9)#62 | 4.5%(+12.2)#2,677 |
| 63. | Bureau Junction | 16.7% | 3.8%(+12.9)#63 | 4.5%(+12.2)#2,687 |
| 64. | Sims | 16.7% | 3.8%(+12.9)#64 | 4.5%(+12.2)#2,692 |
| 65. | Ferris | 16.7% | 3.8%(+12.9)#65 | 4.5%(+12.2)#2,693 |
| 66. | Hidalgo | 16.7% | 3.8%(+12.9)#66 | 4.5%(+12.2)#2,700 |
| 67. | Aroma Park | 16.2% | 3.8%(+12.4)#67 | 4.5%(+11.7)#2,792 |
| 68. | Roberts | 16.0% | 3.8%(+12.3)#68 | 4.5%(+11.6)#2,822 |
| 69. | New Douglas | 16.0% | 3.8%(+12.2)#69 | 4.5%(+11.5)#2,839 |
| 70. | Ina | 15.9% | 3.8%(+12.1)#70 | 4.5%(+11.4)#2,863 |
| 71. | Forest City | 15.8% | 3.8%(+12.0)#71 | 4.5%(+11.3)#2,895 |
| 72. | Kinmundy | 15.6% | 3.8%(+11.8)#72 | 4.5%(+11.1)#2,950 |
| 73. | Carlinville | 15.5% | 3.8%(+11.8)#73 | 4.5%(+11.1)#2,960 |
| 74. | Kangley | 15.5% | 3.8%(+11.8)#74 | 4.5%(+11.1)#2,968 |
| 75. | Twin Grove | 15.4% | 3.8%(+11.7)#75 | 4.5%(+11.0)#2,980 |
| 76. | Old Shawneetown | 15.4% | 3.8%(+11.6)#76 | 4.5%(+10.9)#3,003 |
| 77. | Sauk Village | 15.3% | 3.8%(+11.6)#77 | 4.5%(+10.9)#3,011 |
| 78. | Clay City | 15.1% | 3.8%(+11.4)#78 | 4.5%(+10.7)#3,056 |
| 79. | Cabery | 15.0% | 3.8%(+11.2)#79 | 4.5%(+10.5)#3,087 |
| 80. | Chatsworth | 14.9% | 3.8%(+11.2)#80 | 4.5%(+10.5)#3,097 |
| 81. | Fulton | 14.9% | 3.8%(+11.1)#81 | 4.5%(+10.4)#3,114 |
| 82. | Vandalia | 14.9% | 3.8%(+11.1)#82 | 4.5%(+10.4)#3,119 |
| 83. | Owaneco | 14.8% | 3.8%(+11.1)#83 | 4.5%(+10.4)#3,123 |
| 84. | Rushville | 14.8% | 3.8%(+11.1)#84 | 4.5%(+10.4)#3,127 |
| 85. | Clayton | 14.8% | 3.8%(+11.0)#85 | 4.5%(+10.3)#3,140 |
| 86. | Kankakee | 14.8% | 3.8%(+11.0)#86 | 4.5%(+10.3)#3,148 |
| 87. | Dowell | 14.7% | 3.8%(+10.9)#87 | 4.5%(+10.2)#3,168 |
| 88. | Riverdale | 14.5% | 3.8%(+10.7)#88 | 4.5%(+10.0)#3,226 |
| 89. | South Roxana | 14.4% | 3.8%(+10.7)#89 | 4.5%(+9.97)#3,251 |
| 90. | Cobden | 14.4% | 3.8%(+10.6)#90 | 4.5%(+9.92)#3,266 |
| 91. | Glasford | 14.4% | 3.8%(+10.6)#91 | 4.5%(+9.91)#3,268 |
| 92. | Weldon | 14.3% | 3.8%(+10.5)#92 | 4.5%(+9.82)#3,297 |
| 93. | Marietta | 14.3% | 3.8%(+10.5)#93 | 4.5%(+9.82)#3,324 |
| 94. | New Baden | 14.2% | 3.8%(+10.5)#94 | 4.5%(+9.78)#3,342 |
| 95. | Mount Morris | 14.2% | 3.8%(+10.4)#95 | 4.5%(+9.72)#3,354 |
| 96. | Grand Tower | 14.1% | 3.8%(+10.3)#96 | 4.5%(+9.60)#3,386 |
| 97. | Ipava | 14.0% | 3.8%(+10.2)#97 | 4.5%(+9.49)#3,410 |
| 98. | Justice | 13.9% | 3.8%(+10.2)#98 | 4.5%(+9.45)#3,421 |
| 99. | Ritchie | 13.9% | 3.8%(+10.1)#99 | 4.5%(+9.43)#3,427 |
| 100. | Martinton | 13.8% | 3.8%(+10.0)#100 | 4.5%(+9.33)#3,457 |
Common Questions
What are the Top 10 Cities with the Highest Poverty Level Among Married Couples in Illinois?
Top 10 Cities with the Highest Poverty Level Among Married Couples in Illinois are:
#1
100.0%
#2
100.0%
#3
66.7%
#4
58.3%
#5
53.3%
#6
45.5%
#7
42.9%
#8
39.5%
#9
37.5%
#10
37.5%
What city has the Highest Poverty Level Among Married Couples in Illinois?
Chestnut has the Highest Poverty Level Among Married Couples in Illinois with 100.0%.
What is the Poverty Level Among Married Couples in the State of Illinois?
Poverty Level Among Married Couples in Illinois is 3.8%.
What is the Poverty Level Among Married Couples in the United States?
Poverty Level Among Married Couples in the United States is 4.5%.