Cities with the Highest Poverty Level Among Married Couples in Kansas
RELATED REPORTS & OPTIONS
Highest Poverty | Married Couple
Kansas
Compare Cities
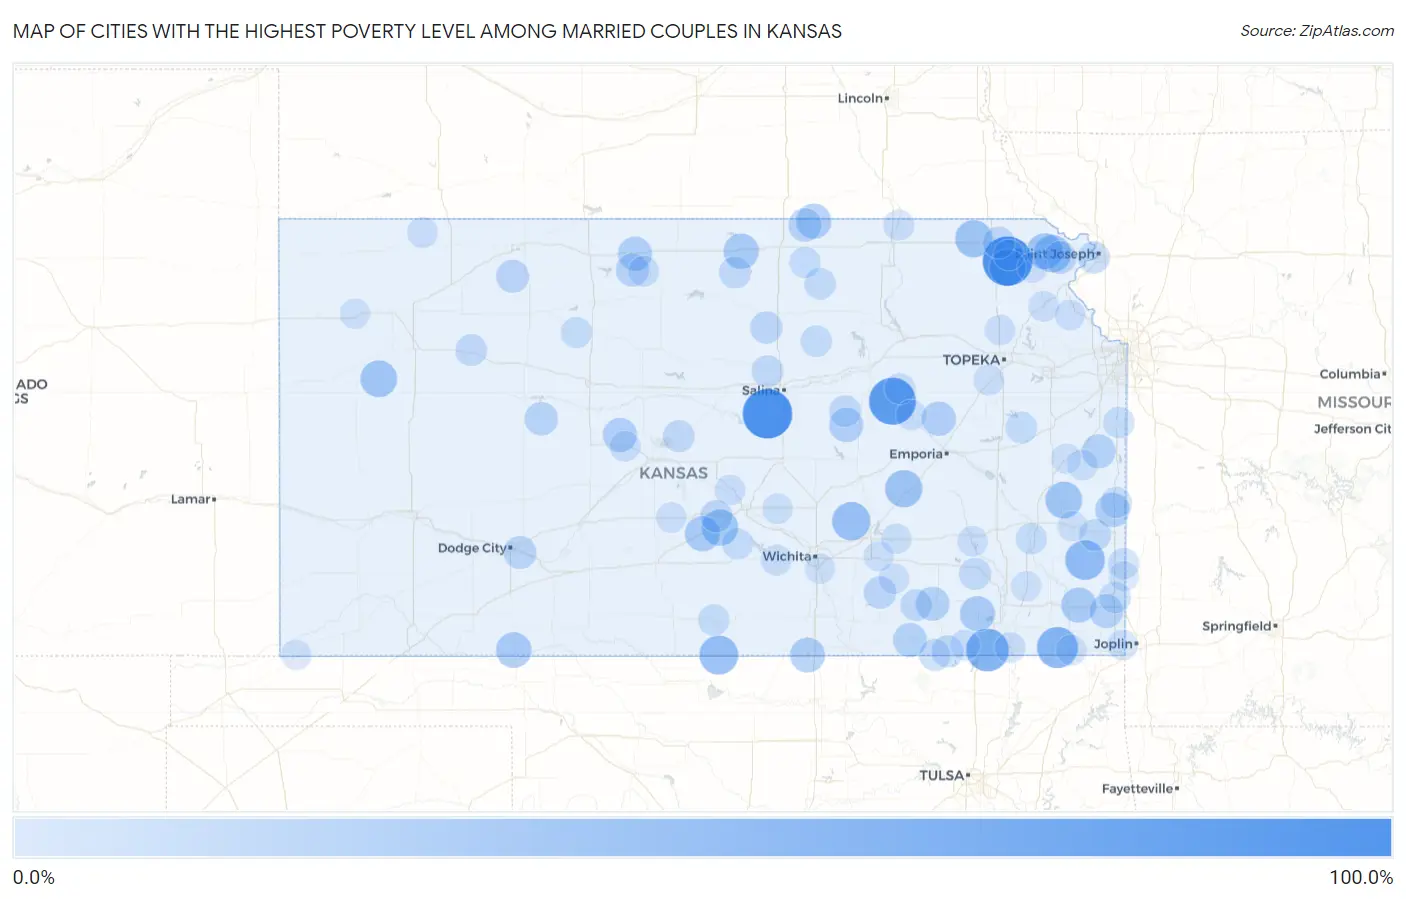
Map of Cities with the Highest Poverty Level Among Married Couples in Kansas
0.0%
100.0%
Cities with the Highest Poverty Level Among Married Couples in Kansas
| City | Married Couples Poverty | vs State | vs National | |
| 1. | Falun | 100.0% | 3.9%(+96.1)#1 | 4.5%(+95.5)#43 |
| 2. | Kickapoo Site 1 | 100.0% | 3.9%(+96.1)#2 | 4.5%(+95.5)#60 |
| 3. | Beaver | 100.0% | 3.9%(+96.1)#3 | 4.5%(+95.5)#100 |
| 4. | Parkerville | 87.5% | 3.9%(+83.6)#4 | 4.5%(+83.0)#110 |
| 5. | Tyro | 67.4% | 3.9%(+63.5)#5 | 4.5%(+62.9)#177 |
| 6. | Bartlett | 60.0% | 3.9%(+56.1)#6 | 4.5%(+55.5)#268 |
| 7. | Hepler | 53.3% | 3.9%(+49.5)#7 | 4.5%(+48.9)#343 |
| 8. | Murdock | 53.3% | 3.9%(+49.5)#8 | 4.5%(+48.9)#347 |
| 9. | Waldron | 50.0% | 3.9%(+46.1)#9 | 4.5%(+45.5)#404 |
| 10. | Potwin | 47.1% | 3.9%(+43.2)#10 | 4.5%(+42.6)#443 |
| 11. | Matfield Green | 42.9% | 3.9%(+39.0)#11 | 4.5%(+38.4)#548 |
| 12. | Severance | 42.9% | 3.9%(+39.0)#12 | 4.5%(+38.4)#549 |
| 13. | Oneida | 42.1% | 3.9%(+38.3)#13 | 4.5%(+37.6)#568 |
| 14. | Kickapoo Tribal Center | 40.0% | 3.9%(+36.1)#14 | 4.5%(+35.5)#624 |
| 15. | Kincaid | 40.0% | 3.9%(+36.1)#15 | 4.5%(+35.5)#628 |
| 16. | Russell Springs | 40.0% | 3.9%(+36.1)#16 | 4.5%(+35.5)#635 |
| 17. | Arlington | 38.6% | 3.9%(+34.8)#17 | 4.5%(+34.2)#681 |
| 18. | Leona | 37.5% | 3.9%(+33.6)#18 | 4.5%(+33.0)#728 |
| 19. | Englewood | 34.8% | 3.9%(+30.9)#19 | 4.5%(+30.3)#815 |
| 20. | Elk City | 33.3% | 3.9%(+29.5)#20 | 4.5%(+28.9)#874 |
| 21. | Formoso | 33.3% | 3.9%(+29.5)#21 | 4.5%(+28.9)#886 |
| 22. | Mahaska | 33.3% | 3.9%(+29.5)#22 | 4.5%(+28.9)#892 |
| 23. | Langdon | 33.3% | 3.9%(+29.5)#23 | 4.5%(+28.9)#896 |
| 24. | Mccune | 32.8% | 3.9%(+29.0)#24 | 4.5%(+28.4)#907 |
| 25. | Hunnewell | 31.8% | 3.9%(+28.0)#25 | 4.5%(+27.4)#946 |
| 26. | Fulton | 30.0% | 3.9%(+26.1)#26 | 4.5%(+25.5)#1,030 |
| 27. | Ramona | 28.6% | 3.9%(+24.7)#27 | 4.5%(+24.1)#1,115 |
| 28. | Bushong | 28.6% | 3.9%(+24.7)#28 | 4.5%(+24.1)#1,124 |
| 29. | Athol | 28.6% | 3.9%(+24.7)#29 | 4.5%(+24.1)#1,125 |
| 30. | Otis | 28.3% | 3.9%(+24.4)#30 | 4.5%(+23.8)#1,134 |
| 31. | Cedar Vale | 28.0% | 3.9%(+24.1)#31 | 4.5%(+23.5)#1,169 |
| 32. | Moline | 27.7% | 3.9%(+23.8)#32 | 4.5%(+23.2)#1,195 |
| 33. | Fontana | 27.3% | 3.9%(+23.4)#33 | 4.5%(+22.8)#1,222 |
| 34. | Weir | 26.6% | 3.9%(+22.7)#34 | 4.5%(+22.1)#1,279 |
| 35. | Narka | 25.0% | 3.9%(+21.1)#35 | 4.5%(+20.5)#1,446 |
| 36. | Brownell | 25.0% | 3.9%(+21.1)#36 | 4.5%(+20.5)#1,460 |
| 37. | Cedar | 25.0% | 3.9%(+21.1)#37 | 4.5%(+20.5)#1,462 |
| 38. | Lenora | 23.7% | 3.9%(+19.8)#38 | 4.5%(+19.2)#1,584 |
| 39. | Wilroads Gardens | 23.3% | 3.9%(+19.4)#39 | 4.5%(+18.8)#1,634 |
| 40. | Bendena | 22.2% | 3.9%(+18.4)#40 | 4.5%(+17.8)#1,757 |
| 41. | Atlanta | 21.1% | 3.9%(+17.2)#41 | 4.5%(+16.6)#1,902 |
| 42. | Delphos | 20.6% | 3.9%(+16.7)#42 | 4.5%(+16.1)#1,967 |
| 43. | Abbyville | 20.0% | 3.9%(+16.1)#43 | 4.5%(+15.5)#2,077 |
| 44. | Elwood | 19.9% | 3.9%(+16.1)#44 | 4.5%(+15.4)#2,090 |
| 45. | Fairview | 19.6% | 3.9%(+15.8)#45 | 4.5%(+15.1)#2,120 |
| 46. | Redfield | 19.0% | 3.9%(+15.2)#46 | 4.5%(+14.6)#2,211 |
| 47. | Stuttgart | 19.0% | 3.9%(+15.2)#47 | 4.5%(+14.6)#2,214 |
| 48. | Randall | 18.8% | 3.9%(+14.9)#48 | 4.5%(+14.3)#2,258 |
| 49. | New Albany | 18.8% | 3.9%(+14.9)#49 | 4.5%(+14.3)#2,267 |
| 50. | Grenola | 18.4% | 3.9%(+14.6)#50 | 4.5%(+14.0)#2,324 |
| 51. | Hope | 18.3% | 3.9%(+14.4)#51 | 4.5%(+13.8)#2,343 |
| 52. | Claflin | 18.2% | 3.9%(+14.3)#52 | 4.5%(+13.7)#2,358 |
| 53. | Park | 18.2% | 3.9%(+14.3)#53 | 4.5%(+13.7)#2,371 |
| 54. | Culver | 18.2% | 3.9%(+14.3)#54 | 4.5%(+13.7)#2,377 |
| 55. | Chautauqua | 18.2% | 3.9%(+14.3)#55 | 4.5%(+13.7)#2,378 |
| 56. | Elgin | 18.2% | 3.9%(+14.3)#56 | 4.5%(+13.7)#2,380 |
| 57. | Quenemo | 17.8% | 3.9%(+13.9)#57 | 4.5%(+13.3)#2,461 |
| 58. | Pittsburg | 17.0% | 3.9%(+13.2)#58 | 4.5%(+12.6)#2,612 |
| 59. | Vining | 16.7% | 3.9%(+12.8)#59 | 4.5%(+12.2)#2,707 |
| 60. | Longford | 16.7% | 3.9%(+12.8)#60 | 4.5%(+12.2)#2,709 |
| 61. | Attica | 16.1% | 3.9%(+12.3)#61 | 4.5%(+11.7)#2,806 |
| 62. | Pretty Prairie | 15.9% | 3.9%(+12.0)#62 | 4.5%(+11.4)#2,867 |
| 63. | Arcadia | 15.8% | 3.9%(+11.9)#63 | 4.5%(+11.3)#2,888 |
| 64. | Prescott | 15.8% | 3.9%(+11.9)#64 | 4.5%(+11.3)#2,893 |
| 65. | Agenda | 15.8% | 3.9%(+11.9)#65 | 4.5%(+11.3)#2,907 |
| 66. | Zurich | 15.4% | 3.9%(+11.5)#66 | 4.5%(+10.9)#3,004 |
| 67. | Louisburg | 15.3% | 3.9%(+11.5)#67 | 4.5%(+10.9)#3,013 |
| 68. | Humboldt | 14.9% | 3.9%(+11.0)#68 | 4.5%(+10.4)#3,113 |
| 69. | Garden Plain | 14.7% | 3.9%(+10.9)#69 | 4.5%(+10.3)#3,155 |
| 70. | Dwight | 14.6% | 3.9%(+10.7)#70 | 4.5%(+10.1)#3,209 |
| 71. | Oketo | 14.3% | 3.9%(+10.4)#71 | 4.5%(+9.82)#3,315 |
| 72. | Gaylord | 14.3% | 3.9%(+10.4)#72 | 4.5%(+9.82)#3,323 |
| 73. | Albert | 13.3% | 3.9%(+9.48)#73 | 4.5%(+8.87)#3,631 |
| 74. | Powhattan | 13.3% | 3.9%(+9.48)#74 | 4.5%(+8.87)#3,636 |
| 75. | Chetopa | 13.1% | 3.9%(+9.29)#75 | 4.5%(+8.68)#3,686 |
| 76. | Nortonville | 13.1% | 3.9%(+9.29)#76 | 4.5%(+8.68)#3,687 |
| 77. | Coffeyville | 13.1% | 3.9%(+9.23)#77 | 4.5%(+8.62)#3,716 |
| 78. | Latham | 13.0% | 3.9%(+9.19)#78 | 4.5%(+8.58)#3,736 |
| 79. | Herndon | 13.0% | 3.9%(+9.19)#79 | 4.5%(+8.58)#3,744 |
| 80. | Council Grove | 13.0% | 3.9%(+9.14)#80 | 4.5%(+8.53)#3,757 |
| 81. | Auburn | 12.9% | 3.9%(+9.02)#81 | 4.5%(+8.41)#3,800 |
| 82. | Parker | 12.8% | 3.9%(+8.97)#82 | 4.5%(+8.36)#3,823 |
| 83. | Niotaze | 12.8% | 3.9%(+8.97)#83 | 4.5%(+8.36)#3,828 |
| 84. | Stafford | 12.7% | 3.9%(+8.81)#84 | 4.5%(+8.20)#3,867 |
| 85. | Toronto | 12.5% | 3.9%(+8.65)#85 | 4.5%(+8.04)#3,942 |
| 86. | Burrton | 12.3% | 3.9%(+8.40)#86 | 4.5%(+7.80)#4,053 |
| 87. | Hoyt | 12.2% | 3.9%(+8.36)#87 | 4.5%(+7.75)#4,067 |
| 88. | Easton | 12.1% | 3.9%(+8.27)#88 | 4.5%(+7.66)#4,120 |
| 89. | Rosalia | 12.1% | 3.9%(+8.27)#89 | 4.5%(+7.66)#4,123 |
| 90. | Galena | 12.1% | 3.9%(+8.21)#90 | 4.5%(+7.60)#4,147 |
| 91. | Nickerson | 12.0% | 3.9%(+8.15)#91 | 4.5%(+7.54)#4,168 |
| 92. | Everest | 12.0% | 3.9%(+8.15)#92 | 4.5%(+7.54)#4,176 |
| 93. | Brewster | 11.8% | 3.9%(+7.91)#93 | 4.5%(+7.30)#4,284 |
| 94. | Leon | 11.7% | 3.9%(+7.85)#94 | 4.5%(+7.24)#4,318 |
| 95. | Thayer | 11.6% | 3.9%(+7.77)#95 | 4.5%(+7.17)#4,349 |
| 96. | Greeley | 11.6% | 3.9%(+7.77)#96 | 4.5%(+7.17)#4,350 |
| 97. | Bronson | 11.6% | 3.9%(+7.75)#97 | 4.5%(+7.15)#4,362 |
| 98. | Oaklawn Sunview | 11.4% | 3.9%(+7.56)#98 | 4.5%(+6.95)#4,439 |
| 99. | Elkhart | 11.1% | 3.9%(+7.26)#99 | 4.5%(+6.65)#4,555 |
| 100. | Mulberry | 11.1% | 3.9%(+7.26)#100 | 4.5%(+6.65)#4,572 |
Common Questions
What are the Top 10 Cities with the Highest Poverty Level Among Married Couples in Kansas?
Top 10 Cities with the Highest Poverty Level Among Married Couples in Kansas are:
#1
100.0%
#2
100.0%
#3
87.5%
#4
67.4%
#5
60.0%
#6
53.3%
#7
50.0%
#8
47.1%
#9
42.9%
#10
42.9%
What city has the Highest Poverty Level Among Married Couples in Kansas?
Falun has the Highest Poverty Level Among Married Couples in Kansas with 100.0%.
What is the Poverty Level Among Married Couples in the State of Kansas?
Poverty Level Among Married Couples in Kansas is 3.9%.
What is the Poverty Level Among Married Couples in the United States?
Poverty Level Among Married Couples in the United States is 4.5%.