Machias, WA Map & Demographics
Machias Map
Machias Overview
$51,636
PER CAPITA INCOME
$165,117
AVG FAMILY INCOME
$121,319
AVG HOUSEHOLD INCOME
1.2%
WAGE / INCOME GAP [ % ]
98.8¢/ $1
WAGE / INCOME GAP [ $ ]
0.35
INEQUALITY / GINI INDEX
1,260
TOTAL POPULATION
764
MALE POPULATION
496
FEMALE POPULATION
154.03
MALES / 100 FEMALES
64.92
FEMALES / 100 MALES
36.4
MEDIAN AGE
3.4
AVG FAMILY SIZE
2.5
AVG HOUSEHOLD SIZE
797
LABOR FORCE [ PEOPLE ]
78.3%
PERCENT IN LABOR FORCE
8.4%
UNEMPLOYMENT RATE
Income in Machias
Income Overview in Machias
Per Capita Income in Machias is $51,636, while median incomes of families and households are $165,117 and $121,319 respectively.
| Characteristic | Number | Measure |
| Per Capita Income | 1,260 | $51,636 |
| Median Family Income | 311 | $165,117 |
| Mean Family Income | 311 | $170,007 |
| Median Household Income | 495 | $121,319 |
| Mean Household Income | 495 | $134,178 |
| Income Deficit | 311 | $0 |
| Wage / Income Gap (%) | 1,260 | 1.19% |
| Wage / Income Gap ($) | 1,260 | 98.81¢ per $1 |
| Gini / Inequality Index | 1,260 | 0.35 |
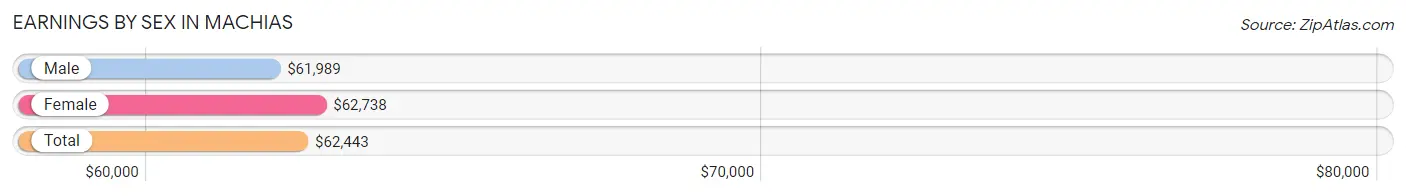
Earnings by Sex in Machias
Average Earnings in Machias are $62,443, $61,989 for men and $62,738 for women, a difference of 1.2%.
| Sex | Number | Average Earnings |
| Male | 517 (63.7%) | $61,989 |
| Female | 294 (36.2%) | $62,738 |
| Total | 811 (100.0%) | $62,443 |
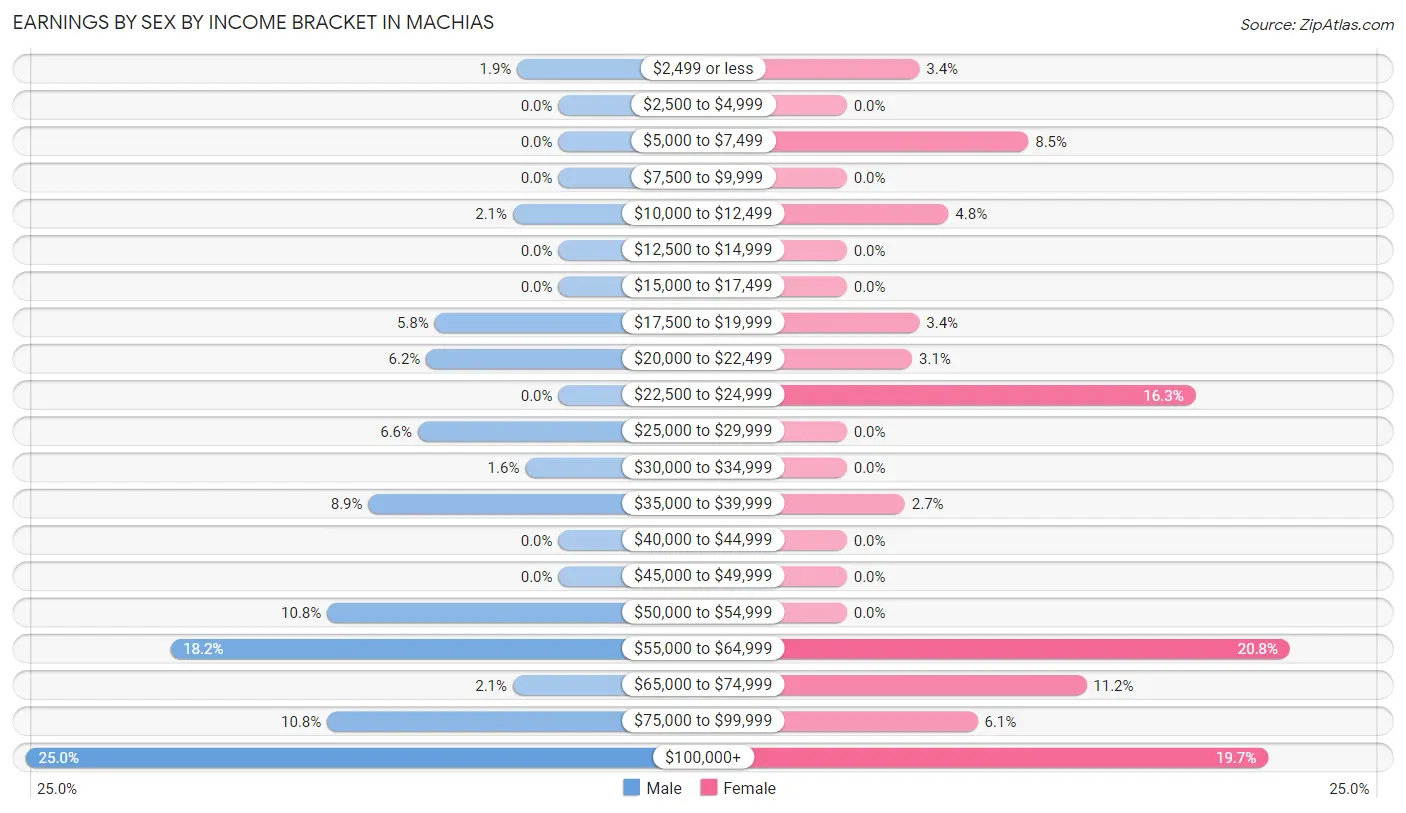
Earnings by Sex by Income Bracket in Machias
The most common earnings brackets in Machias are $100,000+ for men (129 | 24.9%) and $55,000 to $64,999 for women (61 | 20.7%).
| Income | Male | Female |
| $2,499 or less | 10 (1.9%) | 10 (3.4%) |
| $2,500 to $4,999 | 0 (0.0%) | 0 (0.0%) |
| $5,000 to $7,499 | 0 (0.0%) | 25 (8.5%) |
| $7,500 to $9,999 | 0 (0.0%) | 0 (0.0%) |
| $10,000 to $12,499 | 11 (2.1%) | 14 (4.8%) |
| $12,500 to $14,999 | 0 (0.0%) | 0 (0.0%) |
| $15,000 to $17,499 | 0 (0.0%) | 0 (0.0%) |
| $17,500 to $19,999 | 30 (5.8%) | 10 (3.4%) |
| $20,000 to $22,499 | 32 (6.2%) | 9 (3.1%) |
| $22,500 to $24,999 | 0 (0.0%) | 48 (16.3%) |
| $25,000 to $29,999 | 34 (6.6%) | 0 (0.0%) |
| $30,000 to $34,999 | 8 (1.5%) | 0 (0.0%) |
| $35,000 to $39,999 | 46 (8.9%) | 8 (2.7%) |
| $40,000 to $44,999 | 0 (0.0%) | 0 (0.0%) |
| $45,000 to $49,999 | 0 (0.0%) | 0 (0.0%) |
| $50,000 to $54,999 | 56 (10.8%) | 0 (0.0%) |
| $55,000 to $64,999 | 94 (18.2%) | 61 (20.7%) |
| $65,000 to $74,999 | 11 (2.1%) | 33 (11.2%) |
| $75,000 to $99,999 | 56 (10.8%) | 18 (6.1%) |
| $100,000+ | 129 (24.9%) | 58 (19.7%) |
| Total | 517 (100.0%) | 294 (100.0%) |
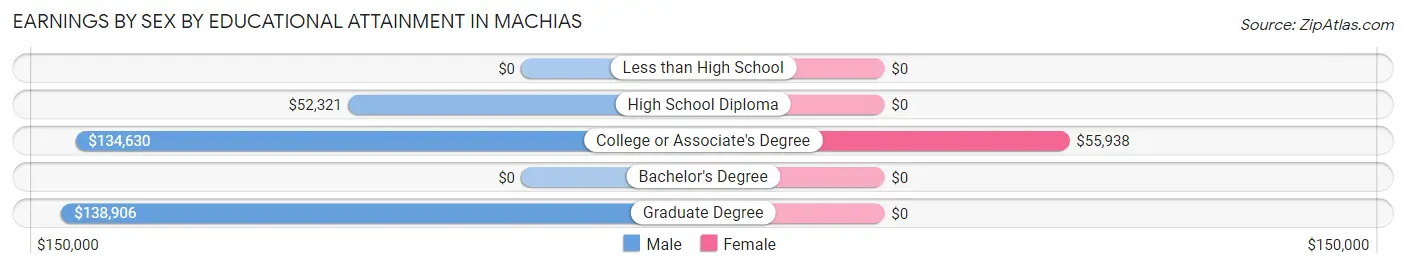
Earnings by Sex by Educational Attainment in Machias
Average earnings in Machias are $63,625 for men and $63,780 for women, a difference of 0.2%. Men with an educational attainment of graduate degree enjoy the highest average annual earnings of $138,906, while those with high school diploma education earn the least with $52,321. Women with an educational attainment of college or associate's degree earn the most with the average annual earnings of $55,938, while those with college or associate's degree education have the smallest earnings of $55,938.
| Educational Attainment | Male Income | Female Income |
| Less than High School | - | - |
| High School Diploma | $52,321 | $0 |
| College or Associate's Degree | $134,630 | $55,938 |
| Bachelor's Degree | - | - |
| Graduate Degree | $138,906 | $0 |
| Total | $63,625 | $63,780 |
Family Income in Machias
Family Income Brackets in Machias
According to the Machias family income data, there are 121 families falling into the $150,000 to $199,999 income range, which is the most common income bracket and makes up 38.9% of all families.
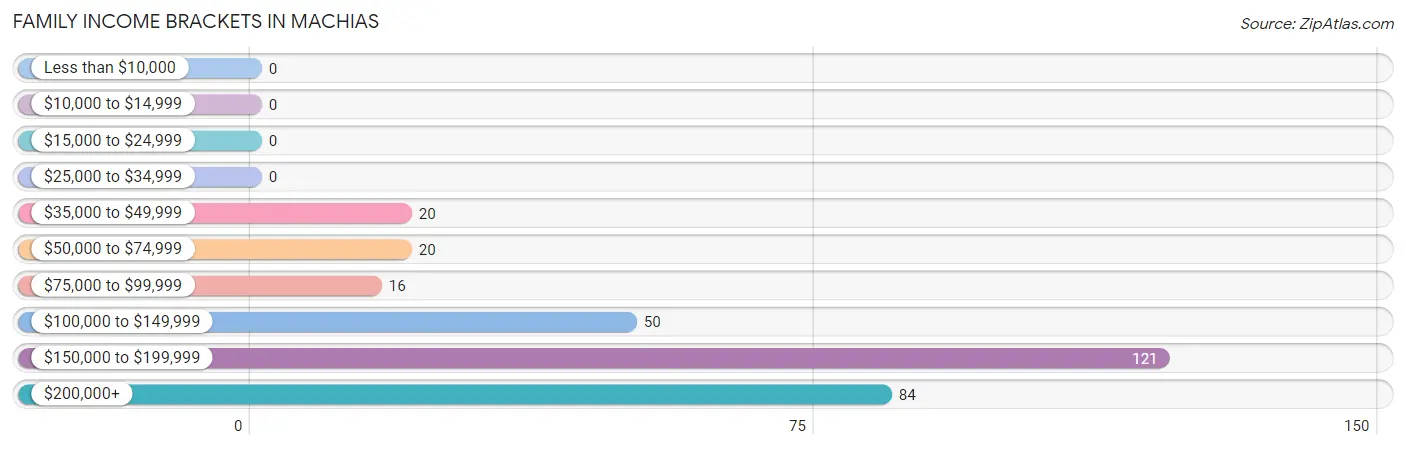
| Income Bracket | # Families | % Families |
| Less than $10,000 | 0 | 0.0% |
| $10,000 to $14,999 | 0 | 0.0% |
| $15,000 to $24,999 | 0 | 0.0% |
| $25,000 to $34,999 | 0 | 0.0% |
| $35,000 to $49,999 | 20 | 6.4% |
| $50,000 to $74,999 | 20 | 6.4% |
| $75,000 to $99,999 | 16 | 5.1% |
| $100,000 to $149,999 | 50 | 16.1% |
| $150,000 to $199,999 | 121 | 38.9% |
| $200,000+ | 84 | 27.0% |
Family Income by Famaliy Size in Machias
3-person families (113 | 36.3%) account for the highest median family income in Machias with $250,001 per family, while 3-person families (113 | 36.3%) have the highest median income of $83,334 per family member.
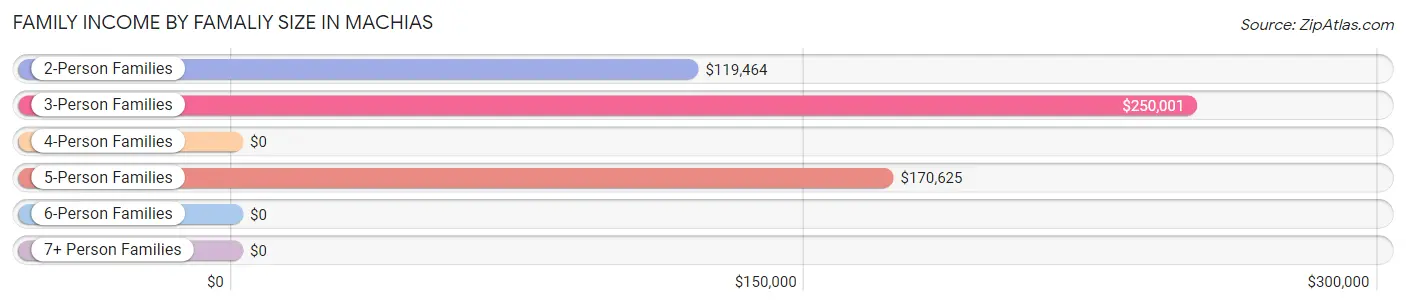
| Income Bracket | # Families | Median Income |
| 2-Person Families | 59 (19.0%) | $119,464 |
| 3-Person Families | 113 (36.3%) | $250,001 |
| 4-Person Families | 60 (19.3%) | $0 |
| 5-Person Families | 70 (22.5%) | $170,625 |
| 6-Person Families | 9 (2.9%) | $0 |
| 7+ Person Families | 0 (0.0%) | $0 |
| Total | 311 (100.0%) | $165,117 |
Family Income by Number of Earners in Machias
The median family income in Machias is $165,117, with families comprising 3+ earners (99) having the highest median family income of $250,001, while families with no earners (37) have the lowest median family income of $51,563, accounting for 31.8% and 11.9% of families, respectively.
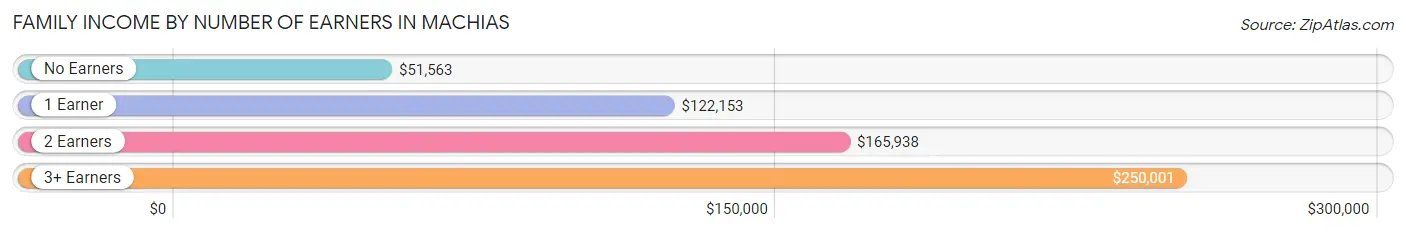
| Number of Earners | # Families | Median Income |
| No Earners | 37 (11.9%) | $51,563 |
| 1 Earner | 47 (15.1%) | $122,153 |
| 2 Earners | 128 (41.2%) | $165,938 |
| 3+ Earners | 99 (31.8%) | $250,001 |
| Total | 311 (100.0%) | $165,117 |
Household Income in Machias
Household Income Brackets in Machias
With 125 households falling in the category, the $50,000 to $74,999 income range is the most frequent in Machias, accounting for 25.3% of all households.
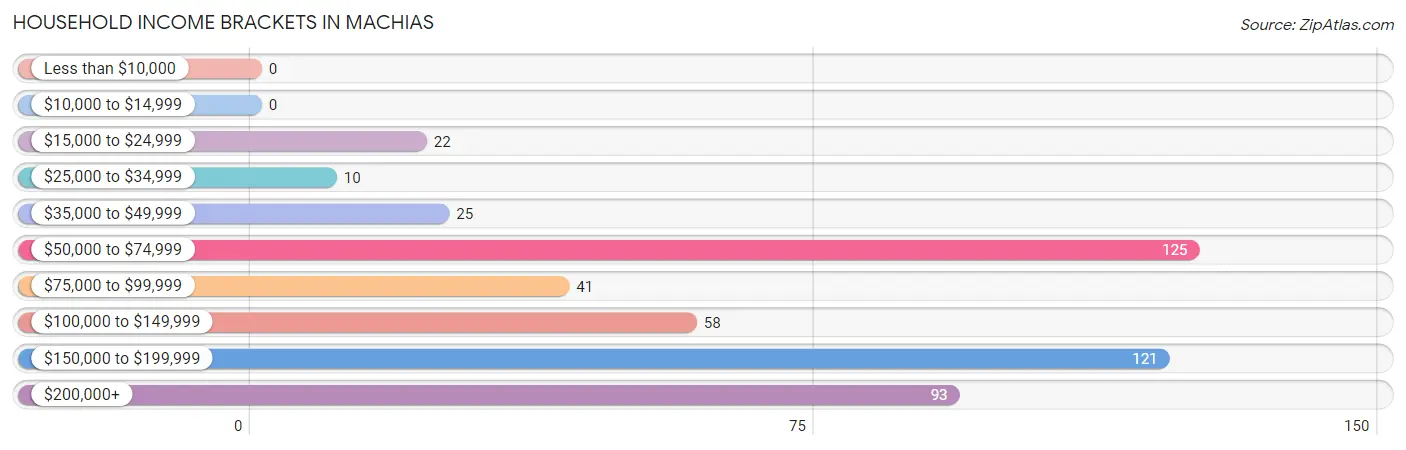
| Income Bracket | # Households | % Households |
| Less than $10,000 | 0 | 0.0% |
| $10,000 to $14,999 | 0 | 0.0% |
| $15,000 to $24,999 | 22 | 4.4% |
| $25,000 to $34,999 | 10 | 2.0% |
| $35,000 to $49,999 | 25 | 5.1% |
| $50,000 to $74,999 | 125 | 25.3% |
| $75,000 to $99,999 | 41 | 8.3% |
| $100,000 to $149,999 | 58 | 11.7% |
| $150,000 to $199,999 | 121 | 24.4% |
| $200,000+ | 93 | 18.8% |
Household Income by Householder Age in Machias
The median household income in Machias is $121,319, with the highest median household income of $165,938 found in the 25 to 44 years age bracket for the primary householder. A total of 96 households (19.4%) fall into this category. Meanwhile, the 15 to 24 years age bracket for the primary householder has the lowest median household income of $0, with 28 households (5.7%) in this group.
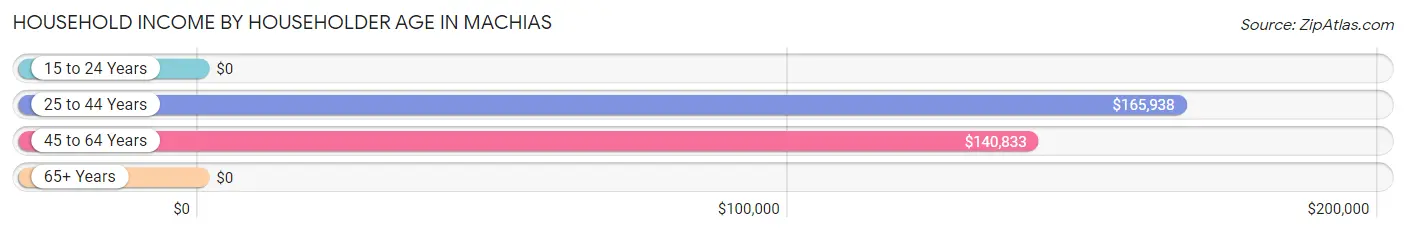
| Income Bracket | # Households | Median Income |
| 15 to 24 Years | 28 (5.7%) | $0 |
| 25 to 44 Years | 96 (19.4%) | $165,938 |
| 45 to 64 Years | 302 (61.0%) | $140,833 |
| 65+ Years | 69 (13.9%) | $0 |
| Total | 495 (100.0%) | $121,319 |
Poverty in Machias
Income Below Poverty by Sex and Age in Machias
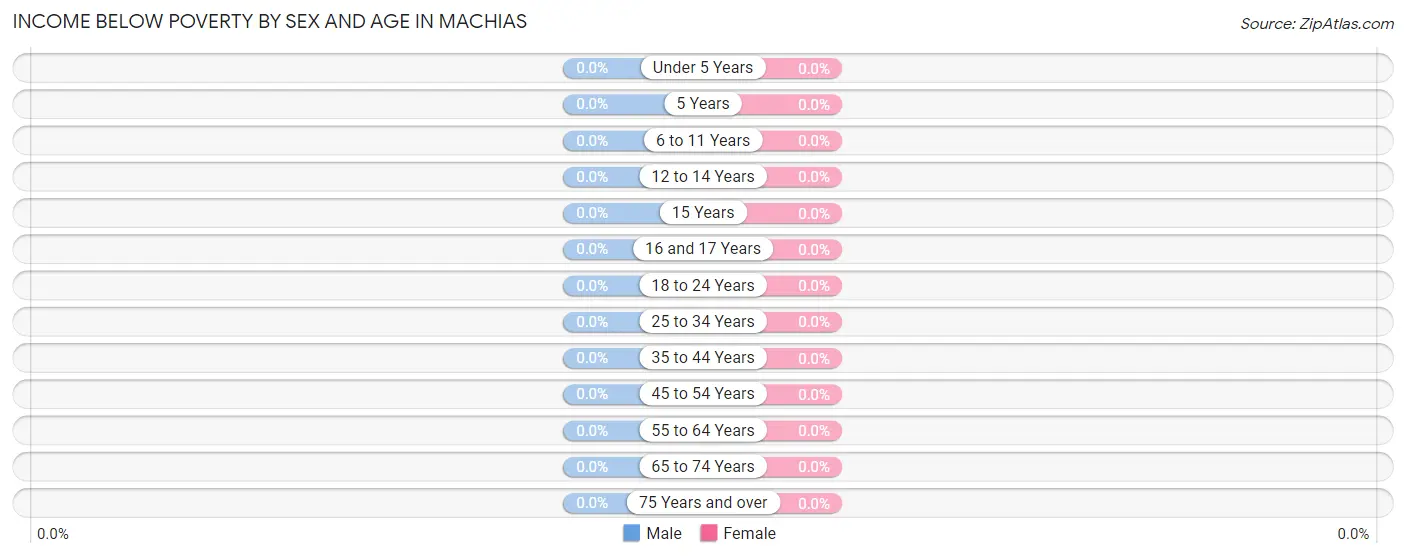
| Age Bracket | Male | Female |
| Under 5 Years | 0 (0.0%) | 0 (0.0%) |
| 5 Years | 0 (0.0%) | 0 (0.0%) |
| 6 to 11 Years | 0 (0.0%) | 0 (0.0%) |
| 12 to 14 Years | 0 (0.0%) | 0 (0.0%) |
| 15 Years | 0 (0.0%) | 0 (0.0%) |
| 16 and 17 Years | 0 (0.0%) | 0 (0.0%) |
| 18 to 24 Years | 0 (0.0%) | 0 (0.0%) |
| 25 to 34 Years | 0 (0.0%) | 0 (0.0%) |
| 35 to 44 Years | 0 (0.0%) | 0 (0.0%) |
| 45 to 54 Years | 0 (0.0%) | 0 (0.0%) |
| 55 to 64 Years | 0 (0.0%) | 0 (0.0%) |
| 65 to 74 Years | 0 (0.0%) | 0 (0.0%) |
| 75 Years and over | 0 (0.0%) | 0 (0.0%) |
| Total | 0 (0.0%) | 0 (0.0%) |
Income Above Poverty by Sex and Age in Machias
According to the poverty statistics in Machias, males aged under 5 years and females aged under 5 years are the age groups that are most secure financially, with 100.0% of males and 100.0% of females in these age groups living above the poverty line.
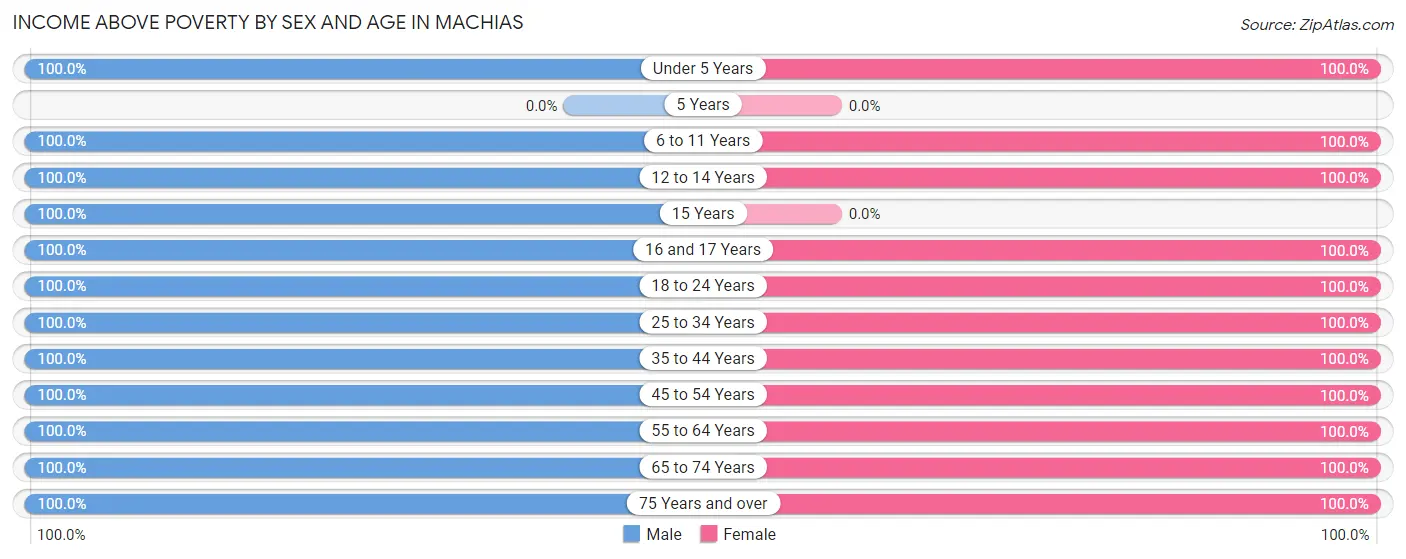
| Age Bracket | Male | Female |
| Under 5 Years | 59 (100.0%) | 29 (100.0%) |
| 5 Years | 0 (0.0%) | 0 (0.0%) |
| 6 to 11 Years | 32 (100.0%) | 43 (100.0%) |
| 12 to 14 Years | 31 (100.0%) | 21 (100.0%) |
| 15 Years | 27 (100.0%) | 0 (0.0%) |
| 16 and 17 Years | 10 (100.0%) | 8 (100.0%) |
| 18 to 24 Years | 92 (100.0%) | 51 (100.0%) |
| 25 to 34 Years | 136 (100.0%) | 76 (100.0%) |
| 35 to 44 Years | 37 (100.0%) | 17 (100.0%) |
| 45 to 54 Years | 166 (100.0%) | 132 (100.0%) |
| 55 to 64 Years | 131 (100.0%) | 67 (100.0%) |
| 65 to 74 Years | 15 (100.0%) | 43 (100.0%) |
| 75 Years and over | 28 (100.0%) | 9 (100.0%) |
| Total | 764 (100.0%) | 496 (100.0%) |
Income Below Poverty Among Married-Couple Families in Machias
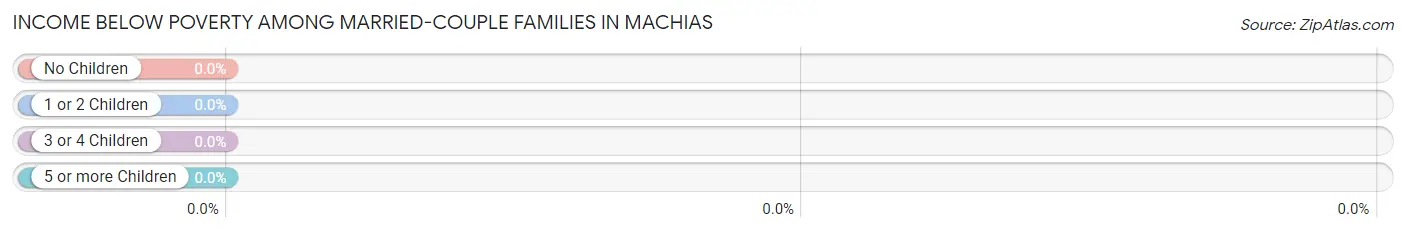
| Children | Above Poverty | Below Poverty |
| No Children | 139 (100.0%) | 0 (0.0%) |
| 1 or 2 Children | 100 (100.0%) | 0 (0.0%) |
| 3 or 4 Children | 53 (100.0%) | 0 (0.0%) |
| 5 or more Children | 0 (0.0%) | 0 (0.0%) |
| Total | 292 (100.0%) | 0 (0.0%) |
Income Below Poverty Among Single-Parent Households in Machias
| Children | Single Father | Single Mother |
| No Children | 0 (0.0%) | 0 (0.0%) |
| 1 or 2 Children | 0 (0.0%) | 0 (0.0%) |
| 3 or 4 Children | 0 (0.0%) | 0 (0.0%) |
| 5 or more Children | 0 (0.0%) | 0 (0.0%) |
| Total | 0 (0.0%) | 0 (0.0%) |
Income Below Poverty Among Married-Couple vs Single-Parent Households in Machias
| Children | Married-Couple Families | Single-Parent Households |
| No Children | 0 (0.0%) | 0 (0.0%) |
| 1 or 2 Children | 0 (0.0%) | 0 (0.0%) |
| 3 or 4 Children | 0 (0.0%) | 0 (0.0%) |
| 5 or more Children | 0 (0.0%) | 0 (0.0%) |
| Total | 0 (0.0%) | 0 (0.0%) |
Race in Machias
The most populous races in Machias are White / Caucasian (1,154 | 91.6%), Hispanic or Latino (82 | 6.5%), and Two or more Races (59 | 4.7%).
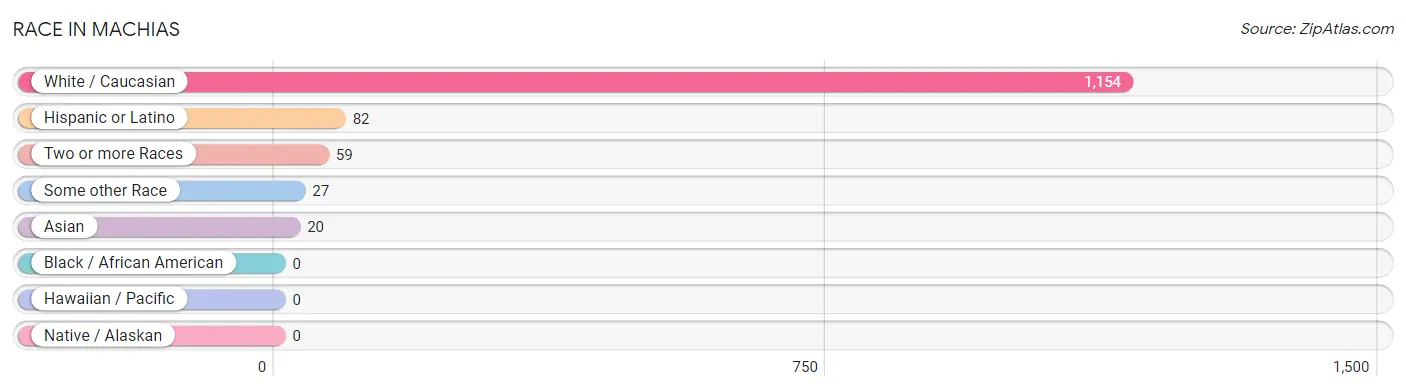
| Race | # Population | % Population |
| Asian | 20 | 1.6% |
| Black / African American | 0 | 0.0% |
| Hawaiian / Pacific | 0 | 0.0% |
| Hispanic or Latino | 82 | 6.5% |
| Native / Alaskan | 0 | 0.0% |
| White / Caucasian | 1,154 | 91.6% |
| Two or more Races | 59 | 4.7% |
| Some other Race | 27 | 2.1% |
| Total | 1,260 | 100.0% |
Ancestry in Machias
The most populous ancestries reported in Machias are German (233 | 18.5%), English (204 | 16.2%), Norwegian (192 | 15.2%), Scottish (174 | 13.8%), and American (144 | 11.4%), together accounting for 75.2% of all Machias residents.
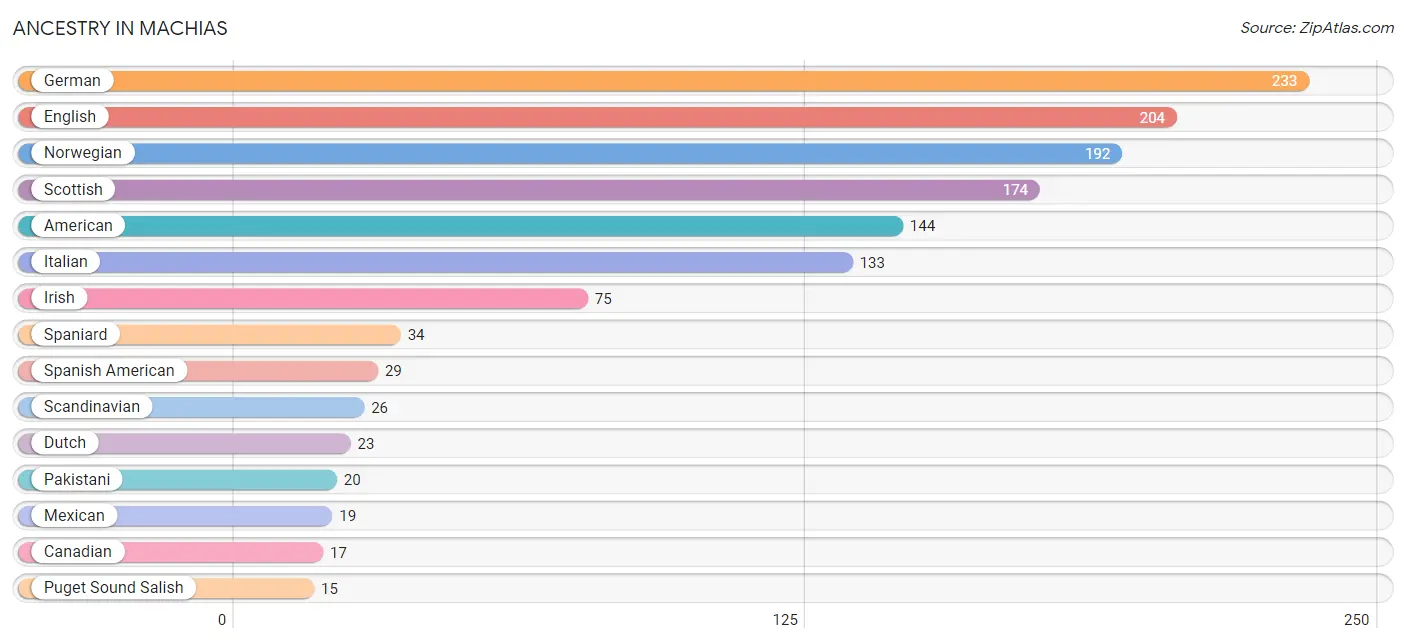
| Ancestry | # Population | % Population |
| American | 144 | 11.4% |
| Canadian | 17 | 1.3% |
| Czech | 9 | 0.7% |
| Dutch | 23 | 1.8% |
| English | 204 | 16.2% |
| French | 10 | 0.8% |
| German | 233 | 18.5% |
| Irish | 75 | 5.9% |
| Italian | 133 | 10.6% |
| Mexican | 19 | 1.5% |
| Native Hawaiian | 10 | 0.8% |
| Northern European | 5 | 0.4% |
| Norwegian | 192 | 15.2% |
| Pakistani | 20 | 1.6% |
| Puget Sound Salish | 15 | 1.2% |
| Scandinavian | 26 | 2.1% |
| Scotch-Irish | 5 | 0.4% |
| Scottish | 174 | 13.8% |
| Spaniard | 34 | 2.7% |
| Spanish American | 29 | 2.3% |
| Swedish | 8 | 0.6% |
| Ukrainian | 9 | 0.7% |
| Welsh | 10 | 0.8% | View All 23 Rows |
Immigrants in Machias
The most numerous immigrant groups reported in Machias came from Eastern Europe (18 | 1.4%), Europe (18 | 1.4%), Belarus (9 | 0.7%), and Ukraine (9 | 0.7%), together accounting for 4.3% of all Machias residents.
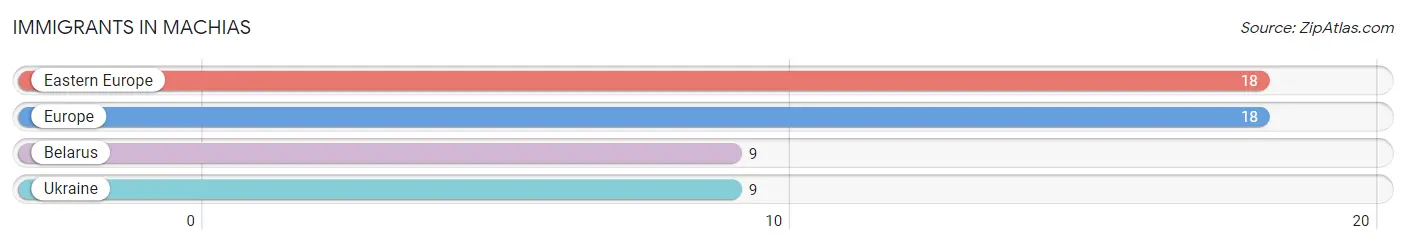
| Immigration Origin | # Population | % Population |
| Belarus | 9 | 0.7% |
| Eastern Europe | 18 | 1.4% |
| Europe | 18 | 1.4% |
| Ukraine | 9 | 0.7% | View All 4 Rows |
Sex and Age in Machias
Sex and Age in Machias
The most populous age groups in Machias are 50 to 54 Years (107 | 14.0%) for men and 45 to 49 Years (72 | 14.5%) for women.
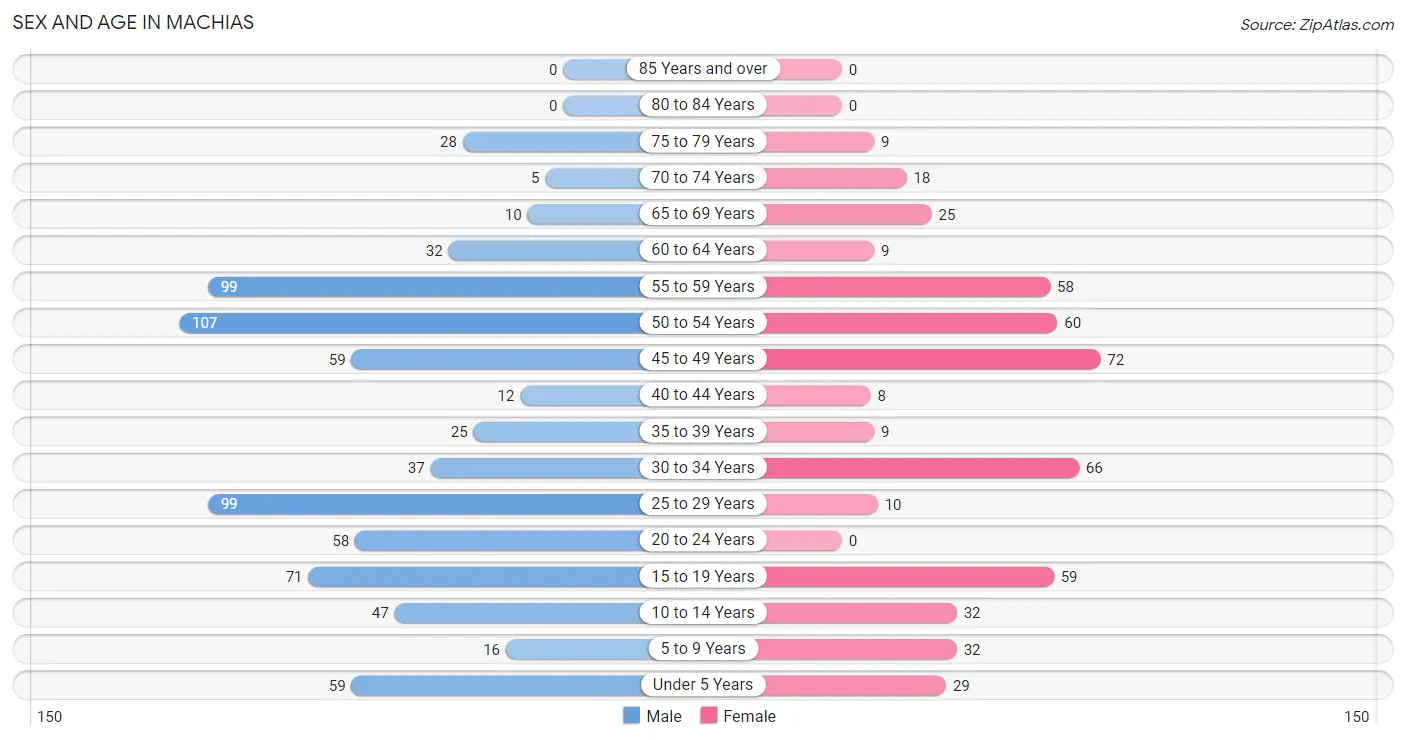
| Age Bracket | Male | Female |
| Under 5 Years | 59 (7.7%) | 29 (5.9%) |
| 5 to 9 Years | 16 (2.1%) | 32 (6.5%) |
| 10 to 14 Years | 47 (6.1%) | 32 (6.5%) |
| 15 to 19 Years | 71 (9.3%) | 59 (11.9%) |
| 20 to 24 Years | 58 (7.6%) | 0 (0.0%) |
| 25 to 29 Years | 99 (13.0%) | 10 (2.0%) |
| 30 to 34 Years | 37 (4.8%) | 66 (13.3%) |
| 35 to 39 Years | 25 (3.3%) | 9 (1.8%) |
| 40 to 44 Years | 12 (1.6%) | 8 (1.6%) |
| 45 to 49 Years | 59 (7.7%) | 72 (14.5%) |
| 50 to 54 Years | 107 (14.0%) | 60 (12.1%) |
| 55 to 59 Years | 99 (13.0%) | 58 (11.7%) |
| 60 to 64 Years | 32 (4.2%) | 9 (1.8%) |
| 65 to 69 Years | 10 (1.3%) | 25 (5.0%) |
| 70 to 74 Years | 5 (0.6%) | 18 (3.6%) |
| 75 to 79 Years | 28 (3.7%) | 9 (1.8%) |
| 80 to 84 Years | 0 (0.0%) | 0 (0.0%) |
| 85 Years and over | 0 (0.0%) | 0 (0.0%) |
| Total | 764 (100.0%) | 496 (100.0%) |
Families and Households in Machias
Median Family Size in Machias
The median family size in Machias is 3.41 persons per family, with married-couple families (292 | 93.9%) accounting for the largest median family size of 3.46 persons per family. On the other hand, single female/mother families (8 | 2.6%) represent the smallest median family size with 2.00 persons per family.
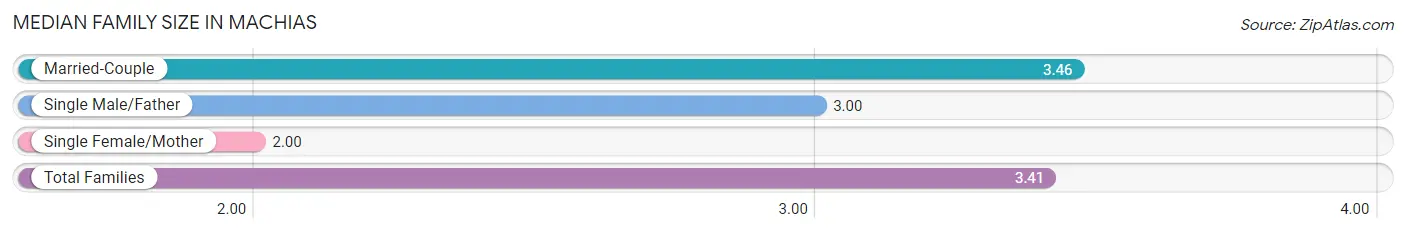
| Family Type | # Families | Family Size |
| Married-Couple | 292 (93.9%) | 3.46 |
| Single Male/Father | 11 (3.5%) | 3.00 |
| Single Female/Mother | 8 (2.6%) | 2.00 |
| Total Families | 311 (100.0%) | 3.41 |
Median Household Size in Machias
The median household size in Machias is 2.55 persons per household, with married-couple households (292 | 59.0%) accounting for the largest median household size of 3.46 persons per household. non-family households (184 | 37.2%) represent the smallest median household size with 1.04 persons per household.
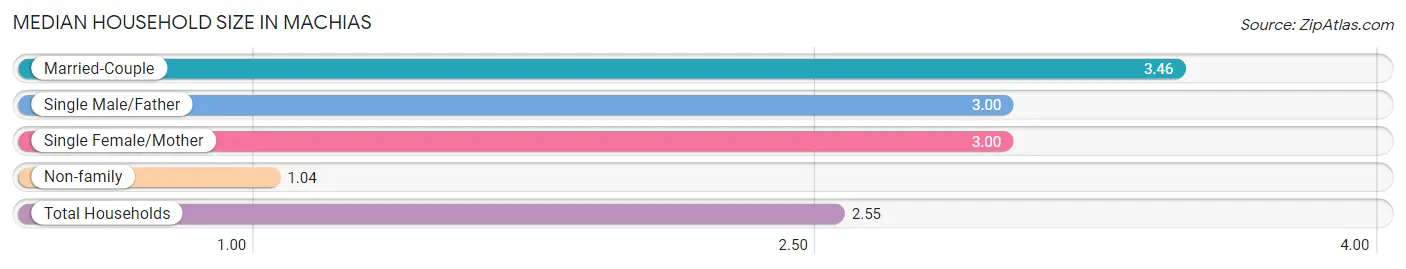
| Household Type | # Households | Household Size |
| Married-Couple | 292 (59.0%) | 3.46 |
| Single Male/Father | 11 (2.2%) | 3.00 |
| Single Female/Mother | 8 (1.6%) | 3.00 |
| Non-family | 184 (37.2%) | 1.04 |
| Total Households | 495 (100.0%) | 2.55 |
Household Size by Marriage Status in Machias
Out of a total of 495 households in Machias, 311 (62.8%) are family households, while 184 (37.2%) are nonfamily households. The most numerous type of family households are 3-person households, comprising 121, and the most common type of nonfamily households are 1-person households, comprising 175.
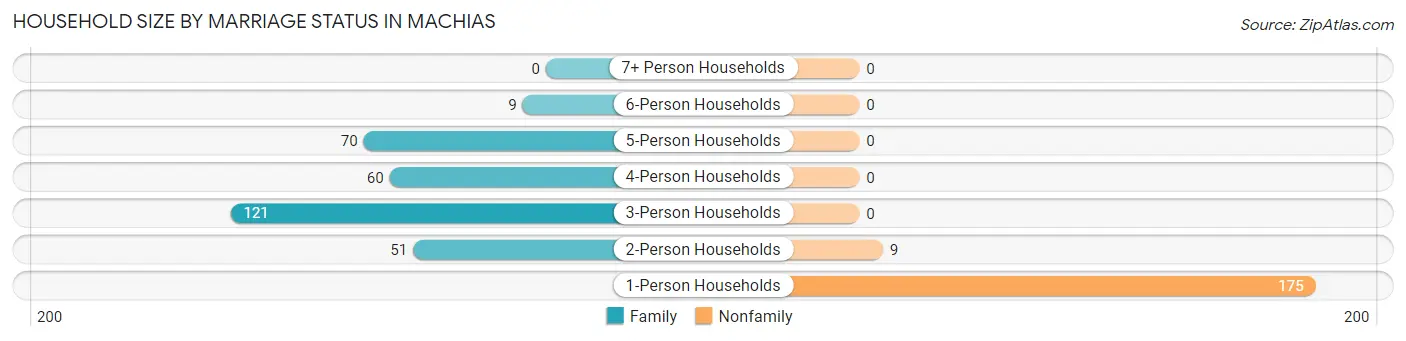
| Household Size | Family Households | Nonfamily Households |
| 1-Person Households | - | 175 (35.3%) |
| 2-Person Households | 51 (10.3%) | 9 (1.8%) |
| 3-Person Households | 121 (24.4%) | 0 (0.0%) |
| 4-Person Households | 60 (12.1%) | 0 (0.0%) |
| 5-Person Households | 70 (14.1%) | 0 (0.0%) |
| 6-Person Households | 9 (1.8%) | 0 (0.0%) |
| 7+ Person Households | 0 (0.0%) | 0 (0.0%) |
| Total | 311 (62.8%) | 184 (37.2%) |
Female Fertility in Machias
Fertility by Age in Machias
Average fertility rate in Machias is 101.0 births per 1,000 women. Women in the age bracket of 20 to 34 years have the highest fertility rate with 342.0 births per 1,000 women. Women in the age bracket of 20 to 34 years acount for 100.0% of all women with births.
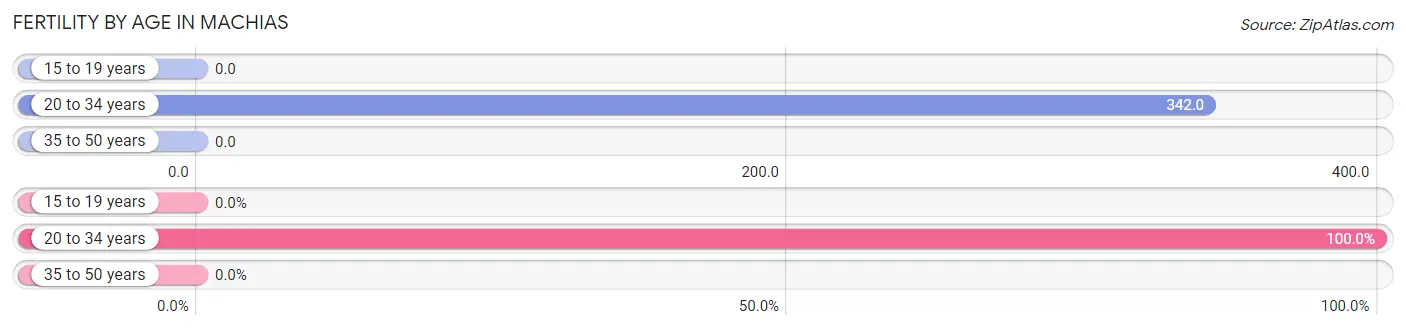
| Age Bracket | Women with Births | Births / 1,000 Women |
| 15 to 19 years | 0 (0.0%) | 0.0 |
| 20 to 34 years | 26 (100.0%) | 342.0 |
| 35 to 50 years | 0 (0.0%) | 0.0 |
| Total | 26 (100.0%) | 101.0 |
Fertility by Age by Marriage Status in Machias
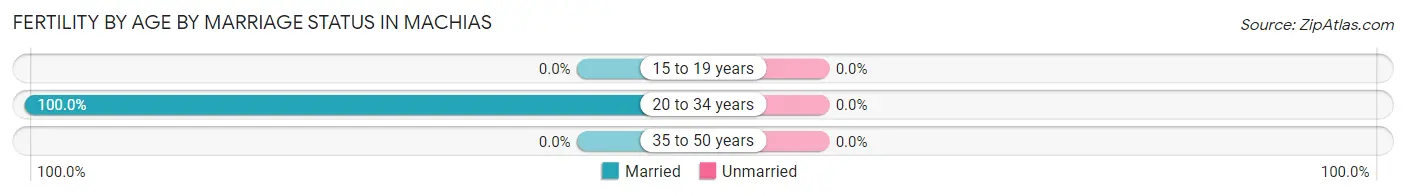
| Age Bracket | Married | Unmarried |
| 15 to 19 years | 0 (0.0%) | 0 (0.0%) |
| 20 to 34 years | 26 (100.0%) | 0 (0.0%) |
| 35 to 50 years | 0 (0.0%) | 0 (0.0%) |
| Total | 26 (100.0%) | 0 (0.0%) |
Fertility by Education in Machias
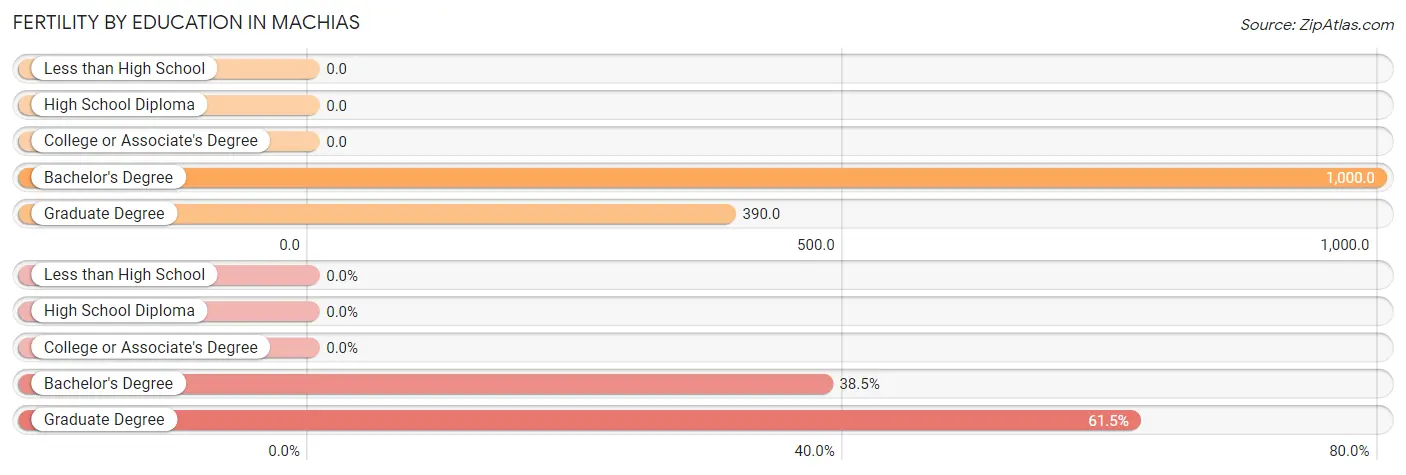
| Educational Attainment | Women with Births | Births / 1,000 Women |
| Less than High School | 0 (0.0%) | 0.0 |
| High School Diploma | 0 (0.0%) | 0.0 |
| College or Associate's Degree | 0 (0.0%) | 0.0 |
| Bachelor's Degree | 10 (38.5%) | 1,000.0 |
| Graduate Degree | 16 (61.5%) | 390.0 |
| Total | 26 (100.0%) | 101.0 |
Fertility by Education by Marriage Status in Machias
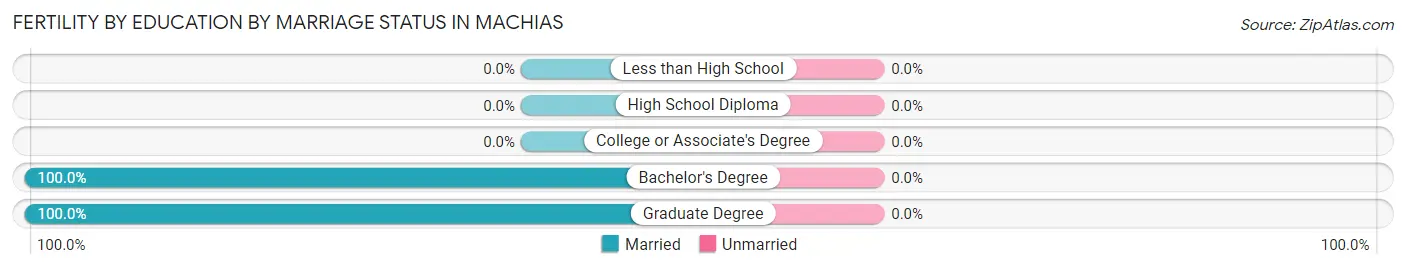
| Educational Attainment | Married | Unmarried |
| Less than High School | 0 (0.0%) | 0 (0.0%) |
| High School Diploma | 0 (0.0%) | 0 (0.0%) |
| College or Associate's Degree | 0 (0.0%) | 0 (0.0%) |
| Bachelor's Degree | 10 (100.0%) | 0 (0.0%) |
| Graduate Degree | 16 (100.0%) | 0 (0.0%) |
| Total | 26 (100.0%) | 0 (0.0%) |
Employment Characteristics in Machias
Employment by Class of Employer in Machias
Among the 627 employed individuals in Machias, private company employees (437 | 69.7%), local government employees (135 | 21.5%), and federal government employees (33 | 5.3%) make up the most common classes of employment.
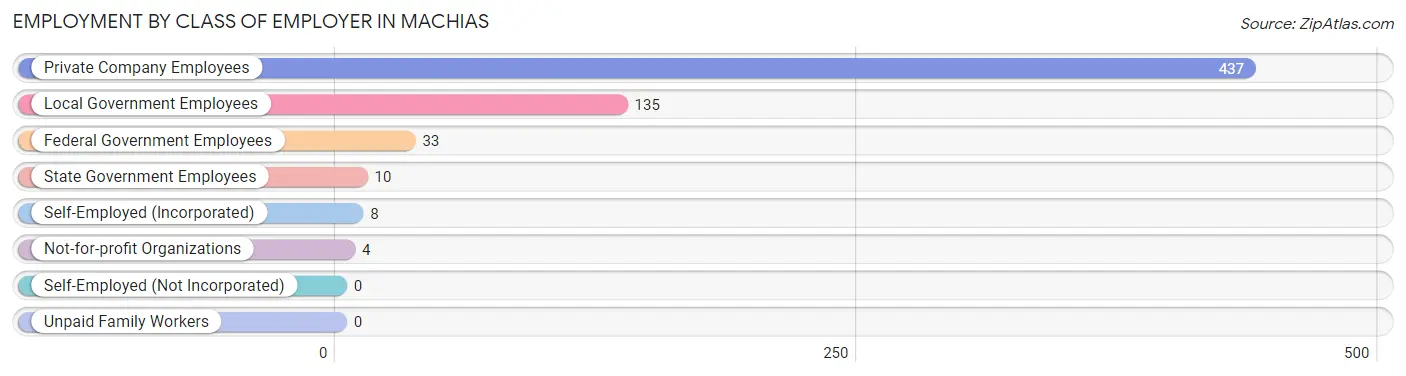
| Employer Class | # Employees | % Employees |
| Private Company Employees | 437 | 69.7% |
| Self-Employed (Incorporated) | 8 | 1.3% |
| Self-Employed (Not Incorporated) | 0 | 0.0% |
| Not-for-profit Organizations | 4 | 0.6% |
| Local Government Employees | 135 | 21.5% |
| State Government Employees | 10 | 1.6% |
| Federal Government Employees | 33 | 5.3% |
| Unpaid Family Workers | 0 | 0.0% |
| Total | 627 | 100.0% |
Employment Status by Age in Machias
According to the labor force statistics for Machias, out of the total population over 16 years of age (1,018), 78.3% or 797 individuals are in the labor force, with 8.4% or 67 of them unemployed. The age group with the highest labor force participation rate is 20 to 24 years, with 100.0% or 58 individuals in the labor force. Within the labor force, the 55 to 59 years age range has the highest percentage of unemployed individuals, with 37.7% or 55 of them being unemployed.
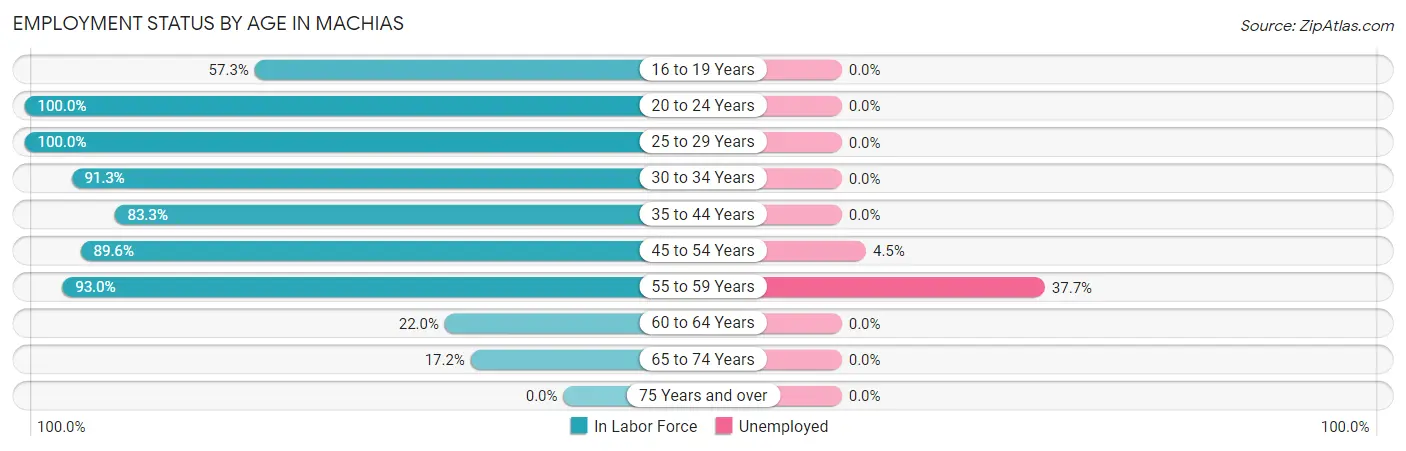
| Age Bracket | In Labor Force | Unemployed |
| 16 to 19 Years | 59 (57.3%) | 0 (0.0%) |
| 20 to 24 Years | 58 (100.0%) | 0 (0.0%) |
| 25 to 29 Years | 109 (100.0%) | 0 (0.0%) |
| 30 to 34 Years | 94 (91.3%) | 0 (0.0%) |
| 35 to 44 Years | 45 (83.3%) | 0 (0.0%) |
| 45 to 54 Years | 267 (89.6%) | 12 (4.5%) |
| 55 to 59 Years | 146 (93.0%) | 55 (37.7%) |
| 60 to 64 Years | 9 (22.0%) | 0 (0.0%) |
| 65 to 74 Years | 10 (17.2%) | 0 (0.0%) |
| 75 Years and over | 0 (0.0%) | 0 (0.0%) |
| Total | 797 (78.3%) | 67 (8.4%) |
Employment Status by Educational Attainment in Machias
According to labor force statistics for Machias, 87.9% of individuals (670) out of the total population between 25 and 64 years of age (762) are in the labor force, with 10.0% or 67 of them being unemployed. The group with the highest labor force participation rate are those with the educational attainment of bachelor's degree or higher, with 100.0% or 193 individuals in the labor force. Within the labor force, individuals with bachelor's degree or higher education have the highest percentage of unemployment, with 28.5% or 55 of them being unemployed.
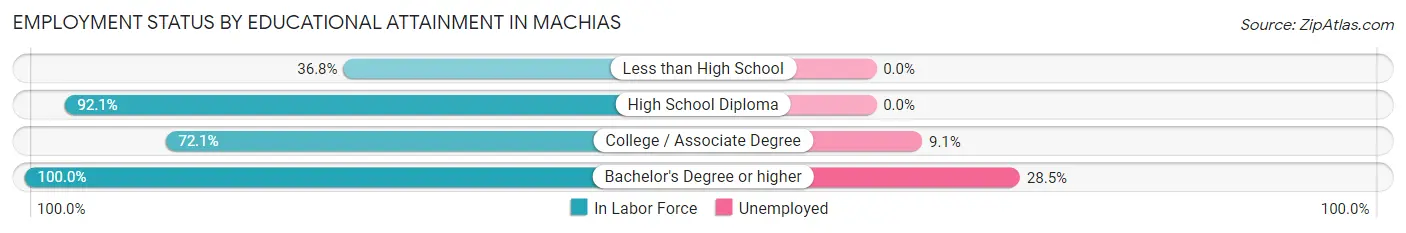
| Educational Attainment | In Labor Force | Unemployed |
| Less than High School | 7 (36.8%) | 0 (0.0%) |
| High School Diploma | 338 (92.1%) | 0 (0.0%) |
| College / Associate Degree | 132 (72.1%) | 17 (9.1%) |
| Bachelor's Degree or higher | 193 (100.0%) | 55 (28.5%) |
| Total | 670 (87.9%) | 76 (10.0%) |
Employment Occupations by Sex in Machias
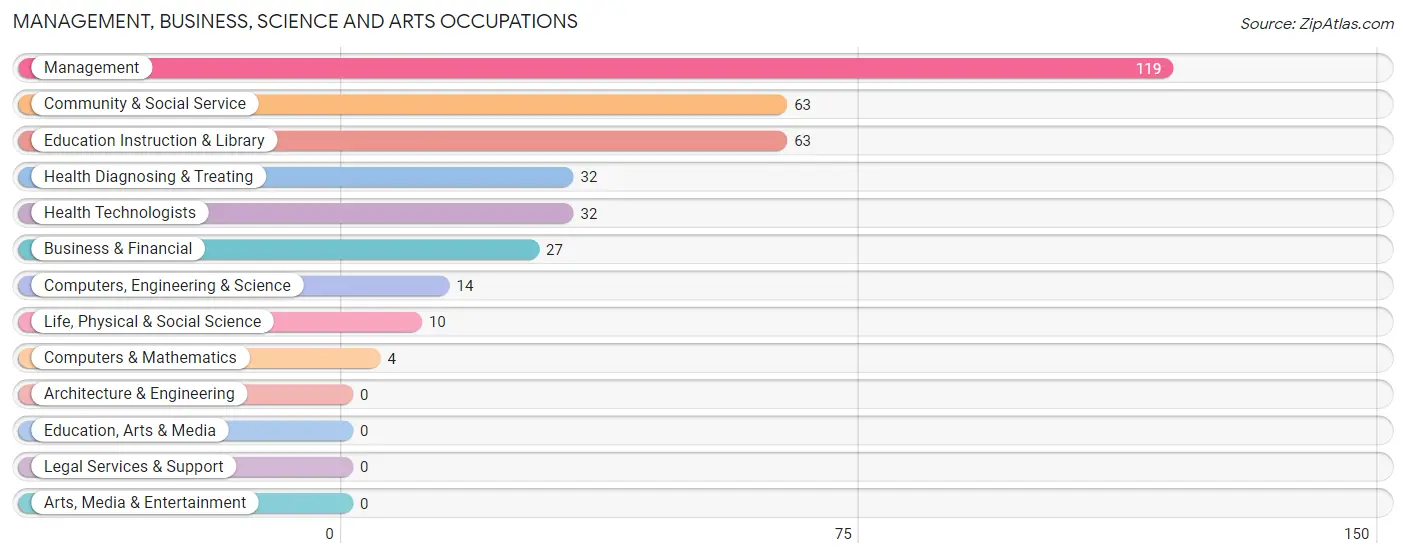
Management, Business, Science and Arts Occupations
The most common Management, Business, Science and Arts occupations in Machias are Management (119 | 16.3%), Community & Social Service (63 | 8.6%), Education Instruction & Library (63 | 8.6%), Health Diagnosing & Treating (32 | 4.4%), and Health Technologists (32 | 4.4%).
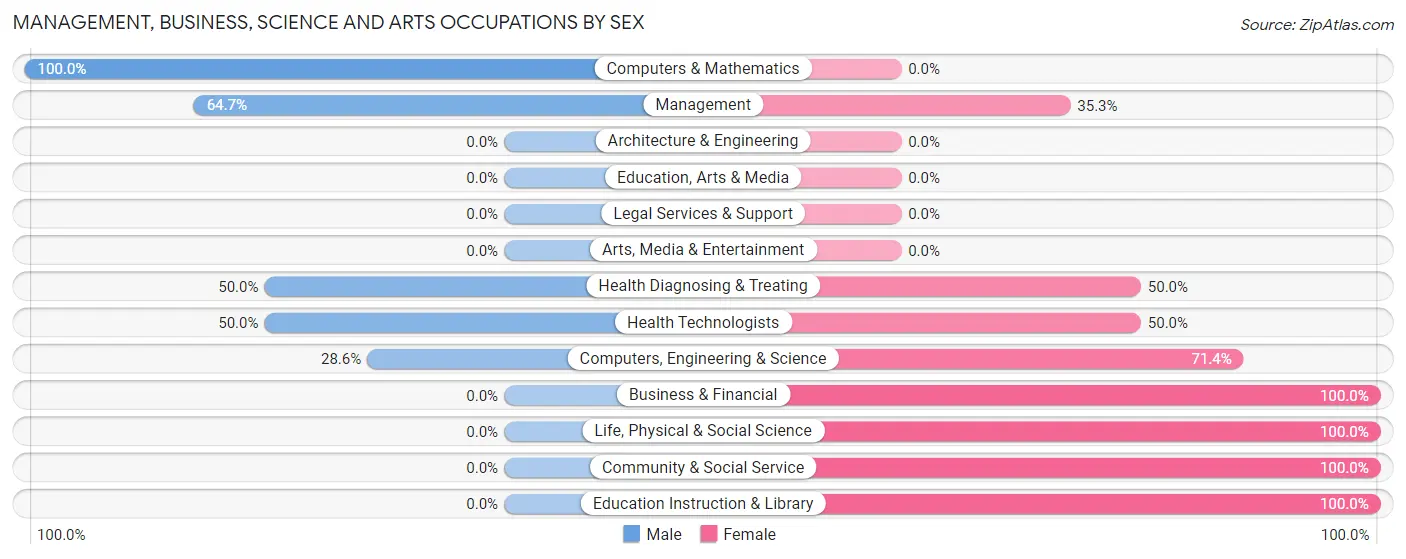
Management, Business, Science and Arts Occupations by Sex
Within the Management, Business, Science and Arts occupations in Machias, the most male-oriented occupations are Computers & Mathematics (100.0%), Management (64.7%), and Health Diagnosing & Treating (50.0%), while the most female-oriented occupations are Business & Financial (100.0%), Life, Physical & Social Science (100.0%), and Community & Social Service (100.0%).
| Occupation | Male | Female |
| Management | 77 (64.7%) | 42 (35.3%) |
| Business & Financial | 0 (0.0%) | 27 (100.0%) |
| Computers, Engineering & Science | 4 (28.6%) | 10 (71.4%) |
| Computers & Mathematics | 4 (100.0%) | 0 (0.0%) |
| Architecture & Engineering | 0 (0.0%) | 0 (0.0%) |
| Life, Physical & Social Science | 0 (0.0%) | 10 (100.0%) |
| Community & Social Service | 0 (0.0%) | 63 (100.0%) |
| Education, Arts & Media | 0 (0.0%) | 0 (0.0%) |
| Legal Services & Support | 0 (0.0%) | 0 (0.0%) |
| Education Instruction & Library | 0 (0.0%) | 63 (100.0%) |
| Arts, Media & Entertainment | 0 (0.0%) | 0 (0.0%) |
| Health Diagnosing & Treating | 16 (50.0%) | 16 (50.0%) |
| Health Technologists | 16 (50.0%) | 16 (50.0%) |
| Total (Category) | 97 (38.0%) | 158 (62.0%) |
| Total (Overall) | 451 (61.8%) | 279 (38.2%) |
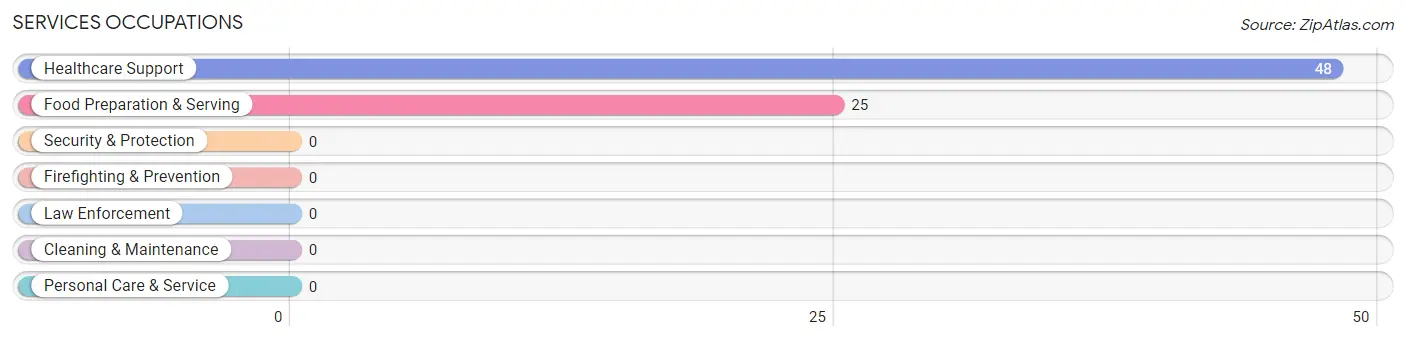
Services Occupations
The most common Services occupations in Machias are Healthcare Support (48 | 6.6%), and Food Preparation & Serving (25 | 3.4%).
Services Occupations by Sex
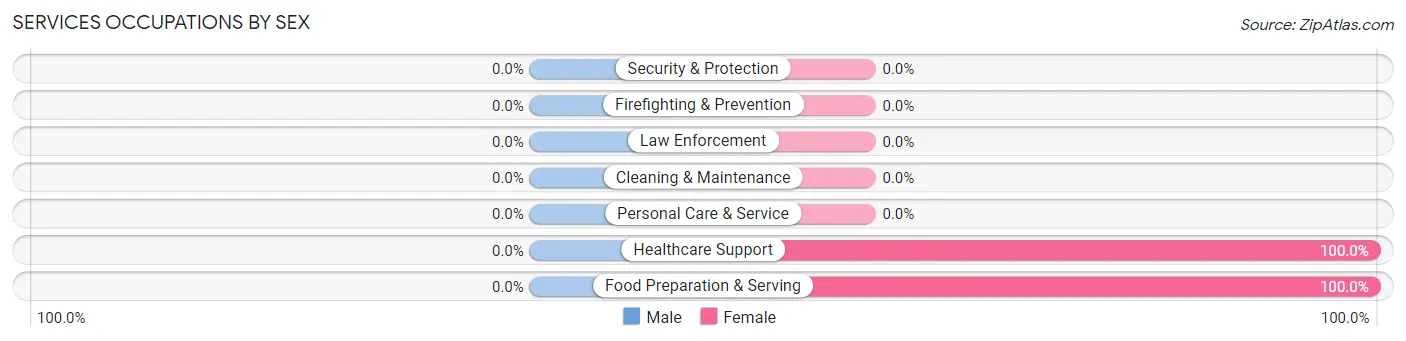
| Occupation | Male | Female |
| Healthcare Support | 0 (0.0%) | 48 (100.0%) |
| Security & Protection | 0 (0.0%) | 0 (0.0%) |
| Firefighting & Prevention | 0 (0.0%) | 0 (0.0%) |
| Law Enforcement | 0 (0.0%) | 0 (0.0%) |
| Food Preparation & Serving | 0 (0.0%) | 25 (100.0%) |
| Cleaning & Maintenance | 0 (0.0%) | 0 (0.0%) |
| Personal Care & Service | 0 (0.0%) | 0 (0.0%) |
| Total (Category) | 0 (0.0%) | 73 (100.0%) |
| Total (Overall) | 451 (61.8%) | 279 (38.2%) |
Sales and Office Occupations
The most common Sales and Office occupations in Machias are Sales & Related (30 | 4.1%), and Office & Administration (15 | 2.1%).
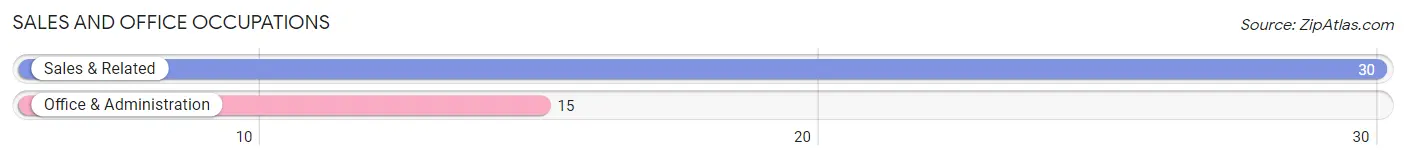
Sales and Office Occupations by Sex

| Occupation | Male | Female |
| Sales & Related | 30 (100.0%) | 0 (0.0%) |
| Office & Administration | 7 (46.7%) | 8 (53.3%) |
| Total (Category) | 37 (82.2%) | 8 (17.8%) |
| Total (Overall) | 451 (61.8%) | 279 (38.2%) |
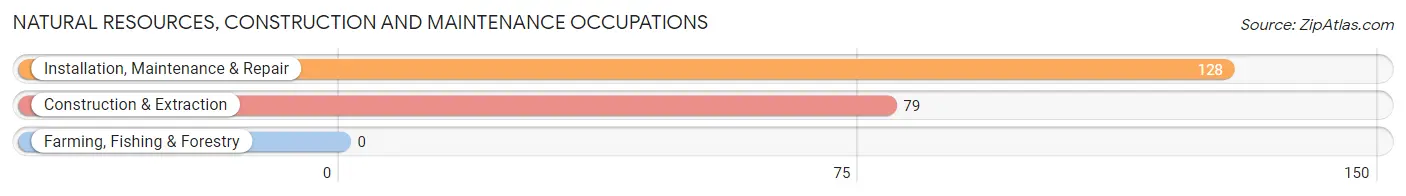
Natural Resources, Construction and Maintenance Occupations
The most common Natural Resources, Construction and Maintenance occupations in Machias are Installation, Maintenance & Repair (128 | 17.5%), and Construction & Extraction (79 | 10.8%).
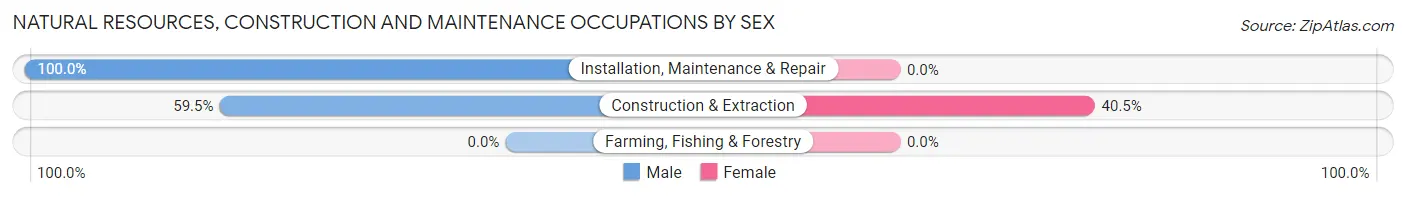
Natural Resources, Construction and Maintenance Occupations by Sex
| Occupation | Male | Female |
| Farming, Fishing & Forestry | 0 (0.0%) | 0 (0.0%) |
| Construction & Extraction | 47 (59.5%) | 32 (40.5%) |
| Installation, Maintenance & Repair | 128 (100.0%) | 0 (0.0%) |
| Total (Category) | 175 (84.5%) | 32 (15.5%) |
| Total (Overall) | 451 (61.8%) | 279 (38.2%) |
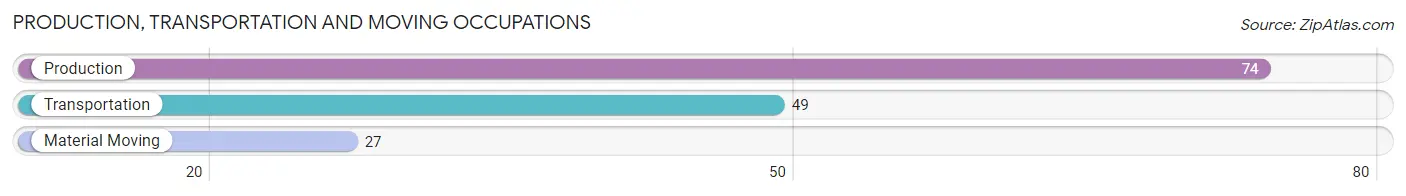
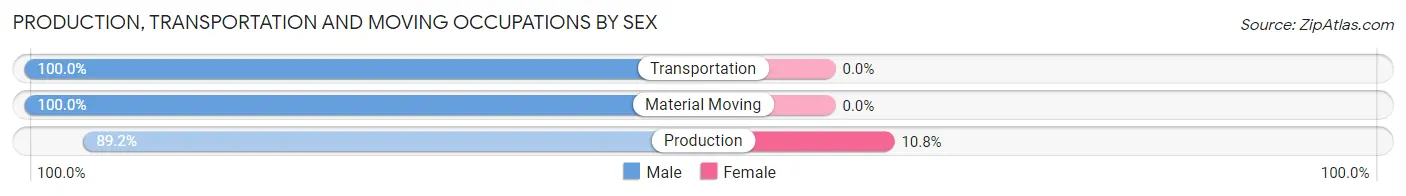
Production, Transportation and Moving Occupations
The most common Production, Transportation and Moving occupations in Machias are Production (74 | 10.1%), Transportation (49 | 6.7%), and Material Moving (27 | 3.7%).
Production, Transportation and Moving Occupations by Sex
| Occupation | Male | Female |
| Production | 66 (89.2%) | 8 (10.8%) |
| Transportation | 49 (100.0%) | 0 (0.0%) |
| Material Moving | 27 (100.0%) | 0 (0.0%) |
| Total (Category) | 142 (94.7%) | 8 (5.3%) |
| Total (Overall) | 451 (61.8%) | 279 (38.2%) |
Employment Industries by Sex in Machias
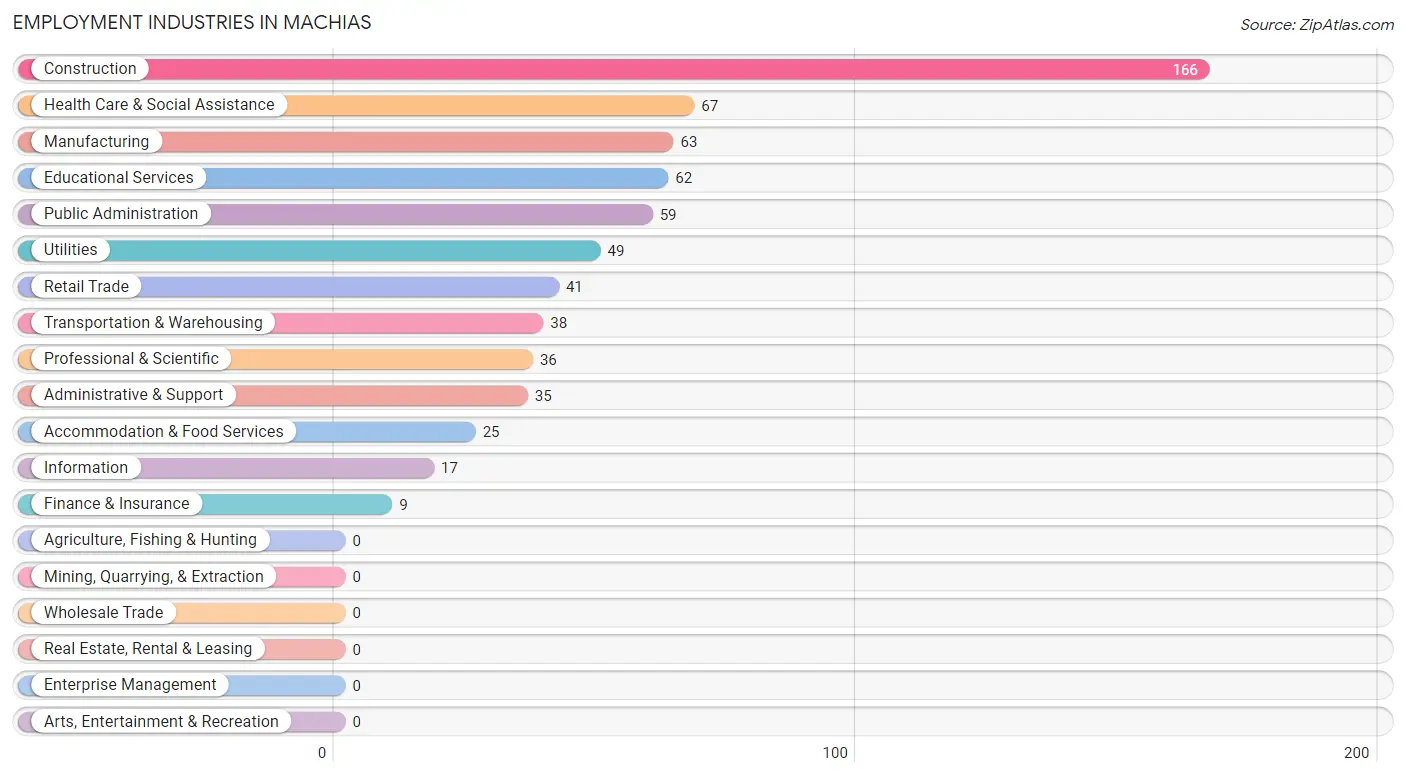
Employment Industries in Machias
The major employment industries in Machias include Construction (166 | 22.7%), Health Care & Social Assistance (67 | 9.2%), Manufacturing (63 | 8.6%), Educational Services (62 | 8.5%), and Public Administration (59 | 8.1%).
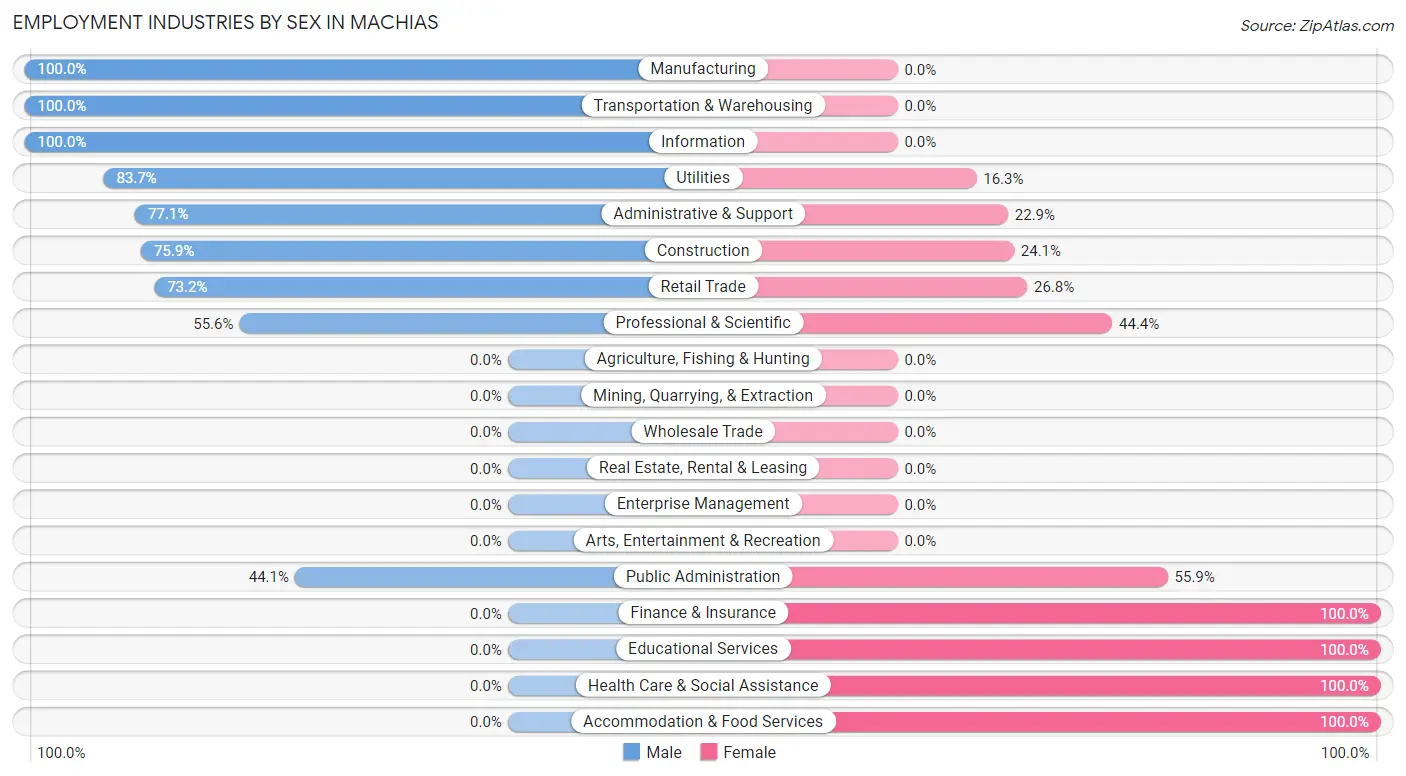
Employment Industries by Sex in Machias
The Machias industries that see more men than women are Manufacturing (100.0%), Transportation & Warehousing (100.0%), and Information (100.0%), whereas the industries that tend to have a higher number of women are Finance & Insurance (100.0%), Educational Services (100.0%), and Health Care & Social Assistance (100.0%).
| Industry | Male | Female |
| Agriculture, Fishing & Hunting | 0 (0.0%) | 0 (0.0%) |
| Mining, Quarrying, & Extraction | 0 (0.0%) | 0 (0.0%) |
| Construction | 126 (75.9%) | 40 (24.1%) |
| Manufacturing | 63 (100.0%) | 0 (0.0%) |
| Wholesale Trade | 0 (0.0%) | 0 (0.0%) |
| Retail Trade | 30 (73.2%) | 11 (26.8%) |
| Transportation & Warehousing | 38 (100.0%) | 0 (0.0%) |
| Utilities | 41 (83.7%) | 8 (16.3%) |
| Information | 17 (100.0%) | 0 (0.0%) |
| Finance & Insurance | 0 (0.0%) | 9 (100.0%) |
| Real Estate, Rental & Leasing | 0 (0.0%) | 0 (0.0%) |
| Professional & Scientific | 20 (55.6%) | 16 (44.4%) |
| Enterprise Management | 0 (0.0%) | 0 (0.0%) |
| Administrative & Support | 27 (77.1%) | 8 (22.9%) |
| Educational Services | 0 (0.0%) | 62 (100.0%) |
| Health Care & Social Assistance | 0 (0.0%) | 67 (100.0%) |
| Arts, Entertainment & Recreation | 0 (0.0%) | 0 (0.0%) |
| Accommodation & Food Services | 0 (0.0%) | 25 (100.0%) |
| Public Administration | 26 (44.1%) | 33 (55.9%) |
| Total | 451 (61.8%) | 279 (38.2%) |
Education in Machias
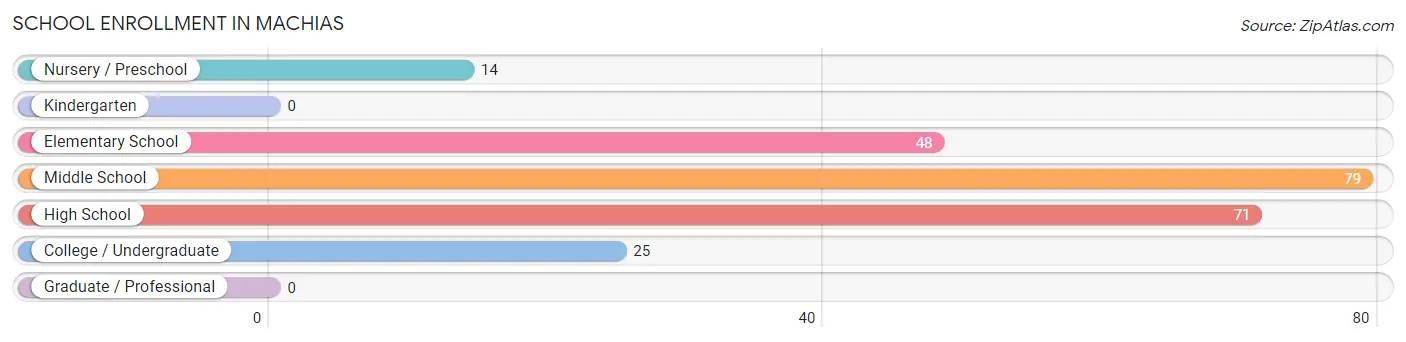
School Enrollment in Machias
The most common levels of schooling among the 237 students in Machias are middle school (79 | 33.3%), high school (71 | 30.0%), and elementary school (48 | 20.3%).
| School Level | # Students | % Students |
| Nursery / Preschool | 14 | 5.9% |
| Kindergarten | 0 | 0.0% |
| Elementary School | 48 | 20.3% |
| Middle School | 79 | 33.3% |
| High School | 71 | 30.0% |
| College / Undergraduate | 25 | 10.5% |
| Graduate / Professional | 0 | 0.0% |
| Total | 237 | 100.0% |
School Enrollment by Age by Funding Source in Machias
Out of a total of 237 students who are enrolled in schools in Machias, 36 (15.2%) attend a private institution, while the remaining 201 (84.8%) are enrolled in public schools. The age group of 3 to 4 year olds has the highest likelihood of being enrolled in private schools, with 9 (64.3% in the age bracket) enrolled. Conversely, the age group of 5 to 9 year old has the lowest likelihood of being enrolled in a private school, with 48 (100.0% in the age bracket) attending a public institution.
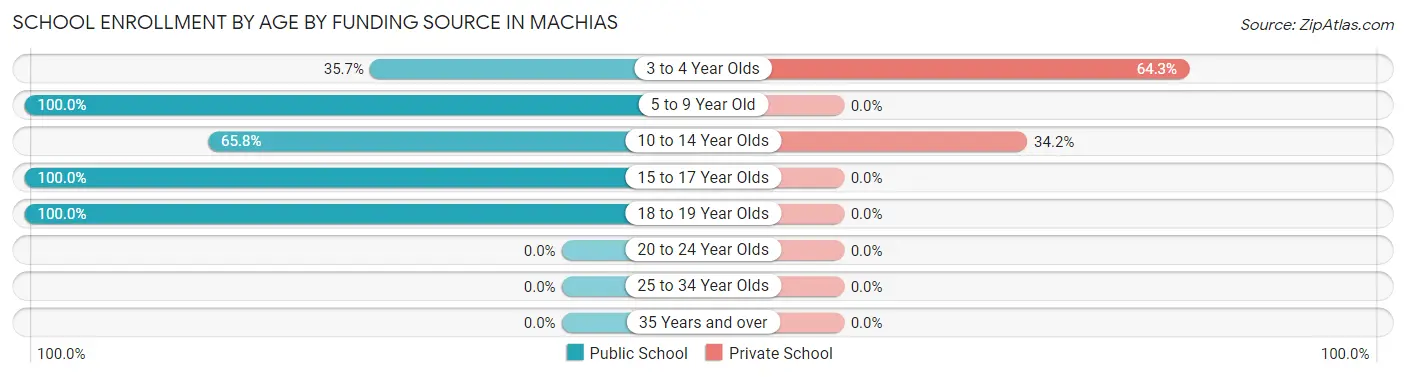
| Age Bracket | Public School | Private School |
| 3 to 4 Year Olds | 5 (35.7%) | 9 (64.3%) |
| 5 to 9 Year Old | 48 (100.0%) | 0 (0.0%) |
| 10 to 14 Year Olds | 52 (65.8%) | 27 (34.2%) |
| 15 to 17 Year Olds | 45 (100.0%) | 0 (0.0%) |
| 18 to 19 Year Olds | 51 (100.0%) | 0 (0.0%) |
| 20 to 24 Year Olds | 0 (0.0%) | 0 (0.0%) |
| 25 to 34 Year Olds | 0 (0.0%) | 0 (0.0%) |
| 35 Years and over | 0 (0.0%) | 0 (0.0%) |
| Total | 201 (84.8%) | 36 (15.2%) |
Educational Attainment by Field of Study in Machias
Business (91 | 38.2%), bio, nature & agricultural (46 | 19.3%), education (28 | 11.8%), science & technology (27 | 11.3%), and engineering (18 | 7.6%) are the most common fields of study among 238 individuals in Machias who have obtained a bachelor's degree or higher.
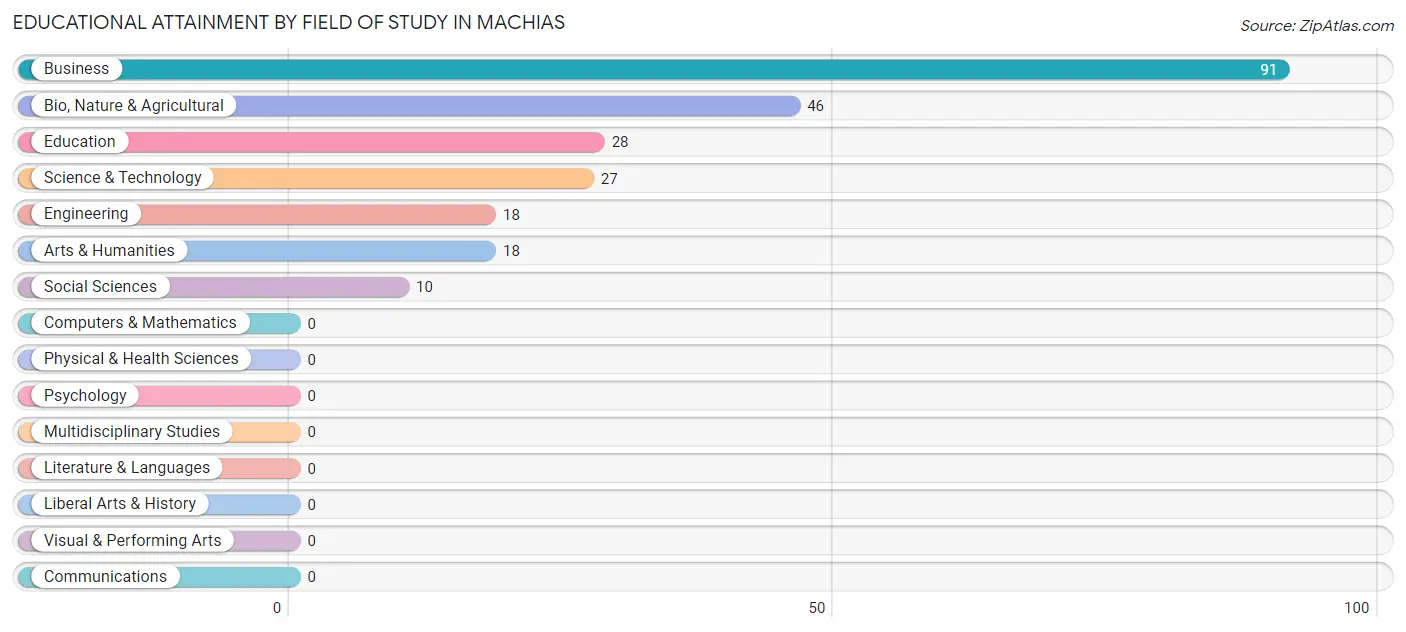
| Field of Study | # Graduates | % Graduates |
| Computers & Mathematics | 0 | 0.0% |
| Bio, Nature & Agricultural | 46 | 19.3% |
| Physical & Health Sciences | 0 | 0.0% |
| Psychology | 0 | 0.0% |
| Social Sciences | 10 | 4.2% |
| Engineering | 18 | 7.6% |
| Multidisciplinary Studies | 0 | 0.0% |
| Science & Technology | 27 | 11.3% |
| Business | 91 | 38.2% |
| Education | 28 | 11.8% |
| Literature & Languages | 0 | 0.0% |
| Liberal Arts & History | 0 | 0.0% |
| Visual & Performing Arts | 0 | 0.0% |
| Communications | 0 | 0.0% |
| Arts & Humanities | 18 | 7.6% |
| Total | 238 | 100.0% |
Transportation & Commute in Machias
Vehicle Availability by Sex in Machias
The most prevalent vehicle ownership categories in Machias are males with 5 or more vehicles (213, accounting for 52.5%) and females with 5 or more vehicles (89, making up 96.4%).
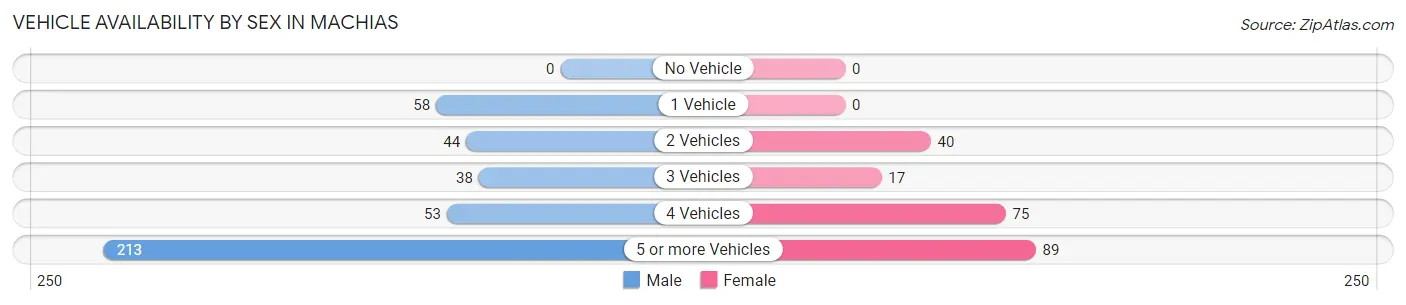
| Vehicles Available | Male | Female |
| No Vehicle | 0 (0.0%) | 0 (0.0%) |
| 1 Vehicle | 58 (14.3%) | 0 (0.0%) |
| 2 Vehicles | 44 (10.8%) | 40 (18.1%) |
| 3 Vehicles | 38 (9.4%) | 17 (7.7%) |
| 4 Vehicles | 53 (13.1%) | 75 (33.9%) |
| 5 or more Vehicles | 213 (52.5%) | 89 (40.3%) |
| Total | 406 (100.0%) | 221 (100.0%) |
Commute Time in Machias
The most frequently occuring commute durations in Machias are 20 to 24 minutes (159 commuters, 25.7%), 10 to 14 minutes (124 commuters, 20.0%), and 25 to 29 minutes (124 commuters, 20.0%).
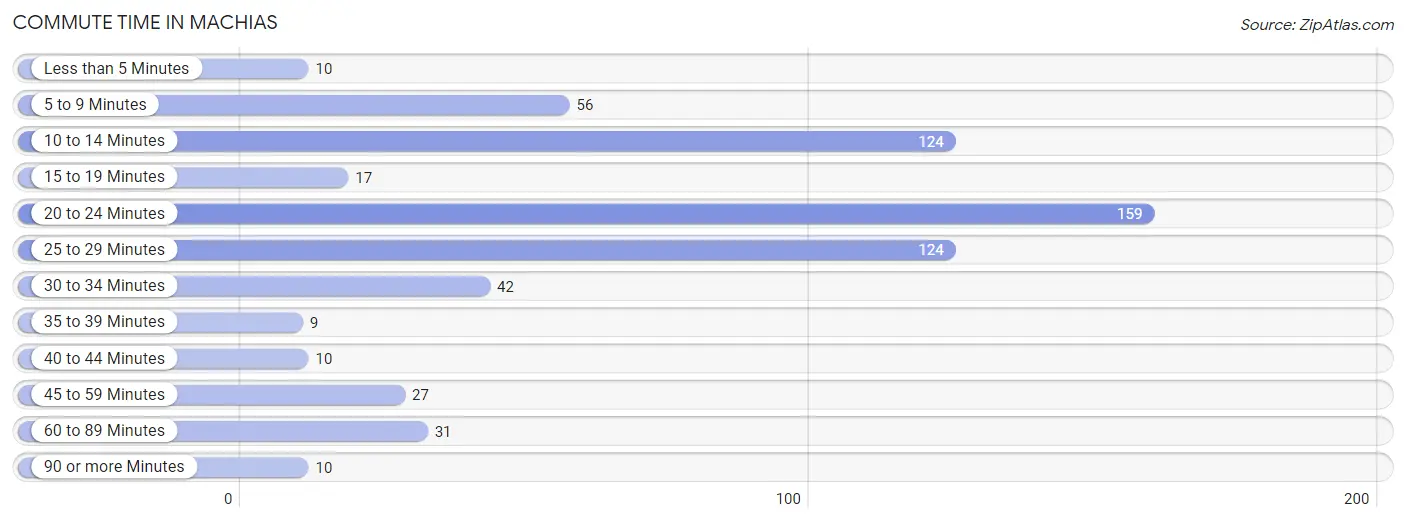
| Commute Time | # Commuters | % Commuters |
| Less than 5 Minutes | 10 | 1.6% |
| 5 to 9 Minutes | 56 | 9.0% |
| 10 to 14 Minutes | 124 | 20.0% |
| 15 to 19 Minutes | 17 | 2.8% |
| 20 to 24 Minutes | 159 | 25.7% |
| 25 to 29 Minutes | 124 | 20.0% |
| 30 to 34 Minutes | 42 | 6.8% |
| 35 to 39 Minutes | 9 | 1.5% |
| 40 to 44 Minutes | 10 | 1.6% |
| 45 to 59 Minutes | 27 | 4.4% |
| 60 to 89 Minutes | 31 | 5.0% |
| 90 or more Minutes | 10 | 1.6% |
Commute Time by Sex in Machias
The most common commute times in Machias are 20 to 24 minutes (116 commuters, 28.6%) for males and 10 to 14 minutes (107 commuters, 50.2%) for females.
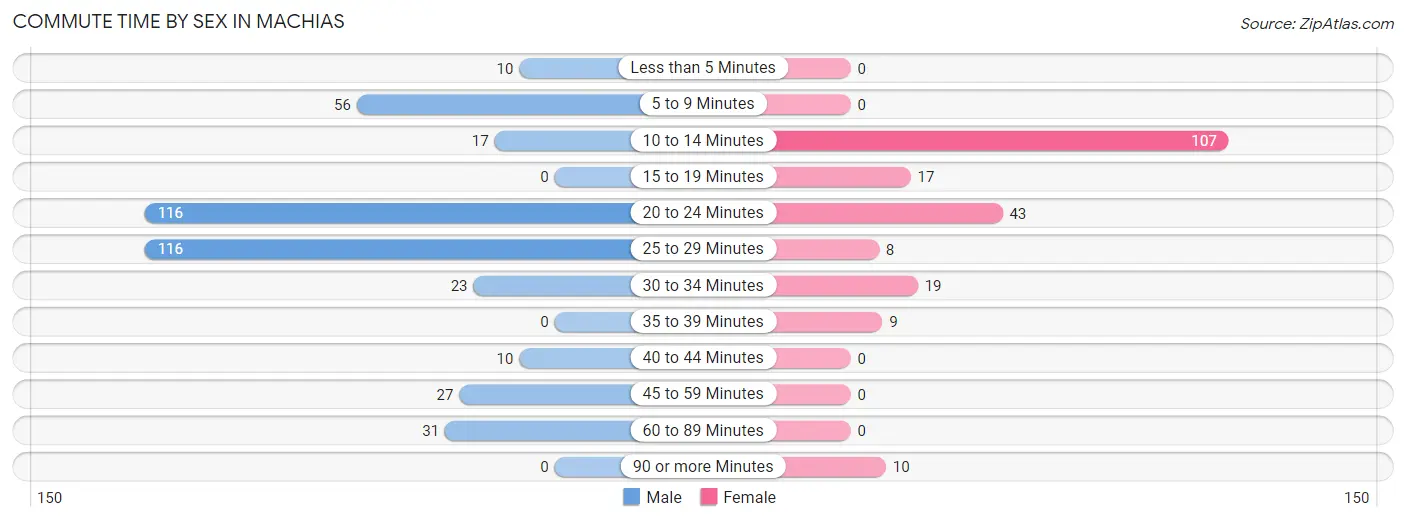
| Commute Time | Male | Female |
| Less than 5 Minutes | 10 (2.5%) | 0 (0.0%) |
| 5 to 9 Minutes | 56 (13.8%) | 0 (0.0%) |
| 10 to 14 Minutes | 17 (4.2%) | 107 (50.2%) |
| 15 to 19 Minutes | 0 (0.0%) | 17 (8.0%) |
| 20 to 24 Minutes | 116 (28.6%) | 43 (20.2%) |
| 25 to 29 Minutes | 116 (28.6%) | 8 (3.8%) |
| 30 to 34 Minutes | 23 (5.7%) | 19 (8.9%) |
| 35 to 39 Minutes | 0 (0.0%) | 9 (4.2%) |
| 40 to 44 Minutes | 10 (2.5%) | 0 (0.0%) |
| 45 to 59 Minutes | 27 (6.7%) | 0 (0.0%) |
| 60 to 89 Minutes | 31 (7.6%) | 0 (0.0%) |
| 90 or more Minutes | 0 (0.0%) | 10 (4.7%) |
Time of Departure to Work by Sex in Machias
The most frequent times of departure to work in Machias are 8:00 AM to 8:29 AM (96, 23.6%) for males and 10:00 AM to 10:59 AM (48, 22.5%) for females.
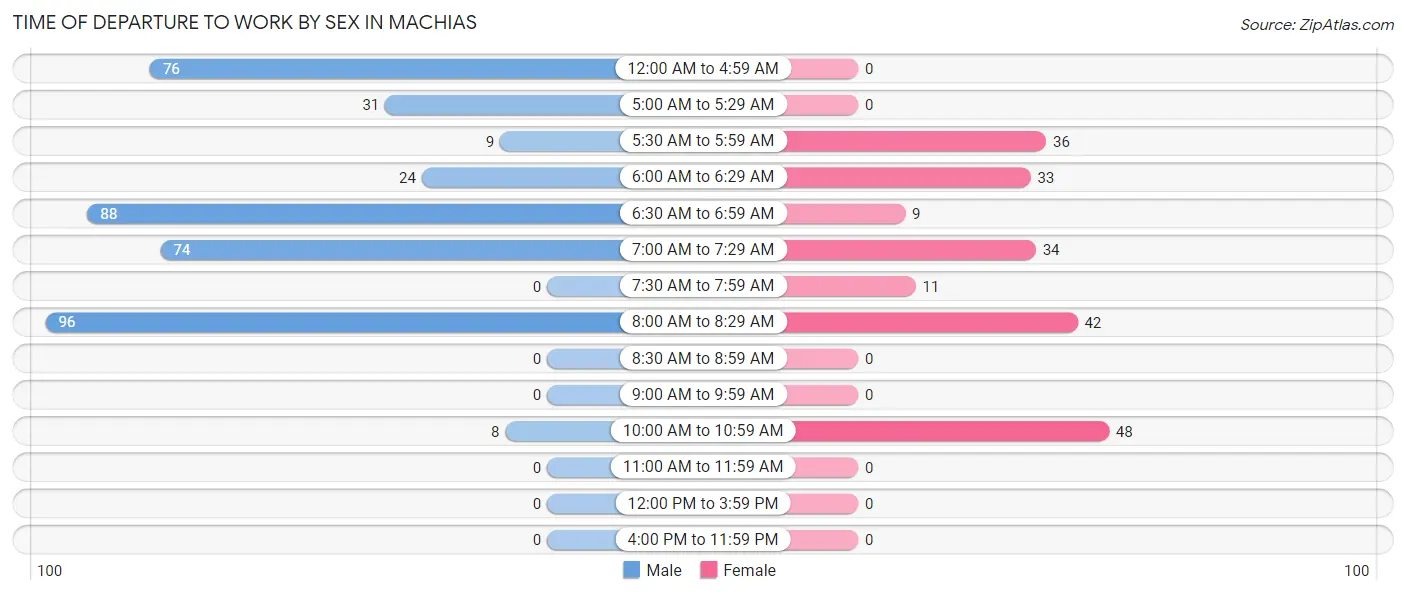
| Time of Departure | Male | Female |
| 12:00 AM to 4:59 AM | 76 (18.7%) | 0 (0.0%) |
| 5:00 AM to 5:29 AM | 31 (7.6%) | 0 (0.0%) |
| 5:30 AM to 5:59 AM | 9 (2.2%) | 36 (16.9%) |
| 6:00 AM to 6:29 AM | 24 (5.9%) | 33 (15.5%) |
| 6:30 AM to 6:59 AM | 88 (21.7%) | 9 (4.2%) |
| 7:00 AM to 7:29 AM | 74 (18.2%) | 34 (16.0%) |
| 7:30 AM to 7:59 AM | 0 (0.0%) | 11 (5.2%) |
| 8:00 AM to 8:29 AM | 96 (23.6%) | 42 (19.7%) |
| 8:30 AM to 8:59 AM | 0 (0.0%) | 0 (0.0%) |
| 9:00 AM to 9:59 AM | 0 (0.0%) | 0 (0.0%) |
| 10:00 AM to 10:59 AM | 8 (2.0%) | 48 (22.5%) |
| 11:00 AM to 11:59 AM | 0 (0.0%) | 0 (0.0%) |
| 12:00 PM to 3:59 PM | 0 (0.0%) | 0 (0.0%) |
| 4:00 PM to 11:59 PM | 0 (0.0%) | 0 (0.0%) |
| Total | 406 (100.0%) | 213 (100.0%) |
Housing Occupancy in Machias
Occupancy by Ownership in Machias
Of the total 495 dwellings in Machias, owner-occupied units account for 372 (75.1%), while renter-occupied units make up 123 (24.8%).
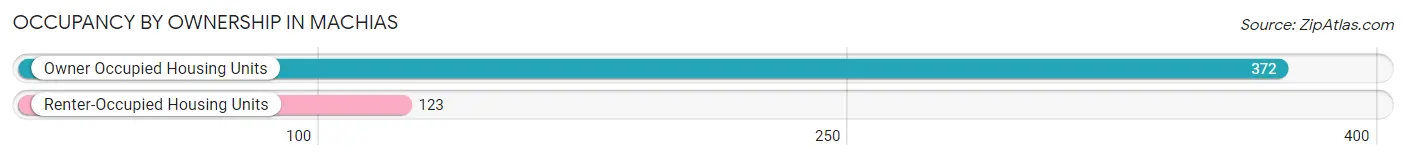
| Occupancy | # Housing Units | % Housing Units |
| Owner Occupied Housing Units | 372 | 75.1% |
| Renter-Occupied Housing Units | 123 | 24.8% |
| Total Occupied Housing Units | 495 | 100.0% |
Occupancy by Household Size in Machias
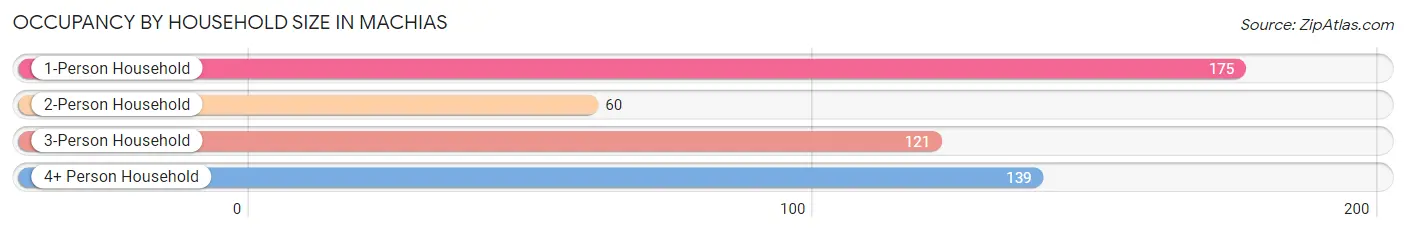
| Household Size | # Housing Units | % Housing Units |
| 1-Person Household | 175 | 35.3% |
| 2-Person Household | 60 | 12.1% |
| 3-Person Household | 121 | 24.4% |
| 4+ Person Household | 139 | 28.1% |
| Total Housing Units | 495 | 100.0% |
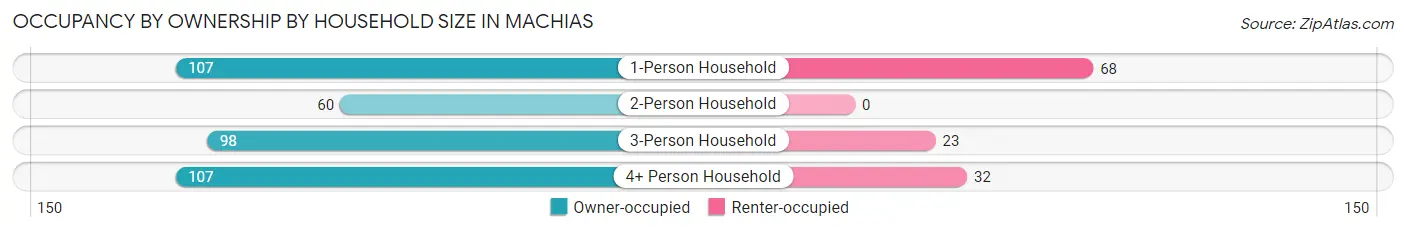
Occupancy by Ownership by Household Size in Machias
| Household Size | Owner-occupied | Renter-occupied |
| 1-Person Household | 107 (61.1%) | 68 (38.9%) |
| 2-Person Household | 60 (100.0%) | 0 (0.0%) |
| 3-Person Household | 98 (81.0%) | 23 (19.0%) |
| 4+ Person Household | 107 (77.0%) | 32 (23.0%) |
| Total Housing Units | 372 (75.1%) | 123 (24.8%) |
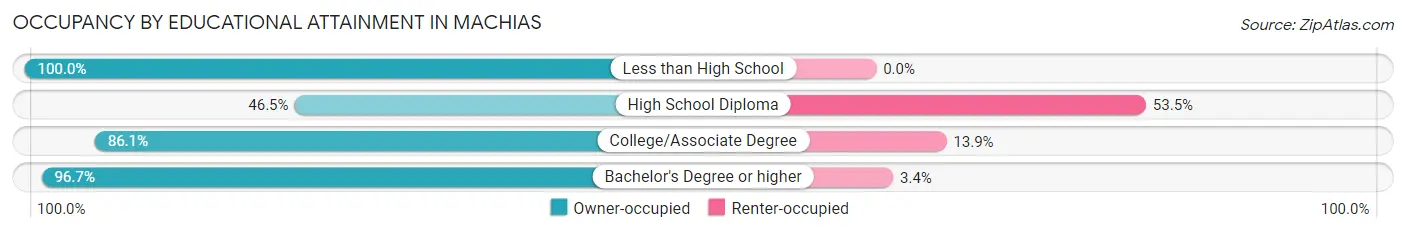
Occupancy by Educational Attainment in Machias
| Household Size | Owner-occupied | Renter-occupied |
| Less than High School | 7 (100.0%) | 0 (0.0%) |
| High School Diploma | 87 (46.5%) | 100 (53.5%) |
| College/Associate Degree | 105 (86.1%) | 17 (13.9%) |
| Bachelor's Degree or higher | 173 (96.7%) | 6 (3.4%) |
Occupancy by Age of Householder in Machias
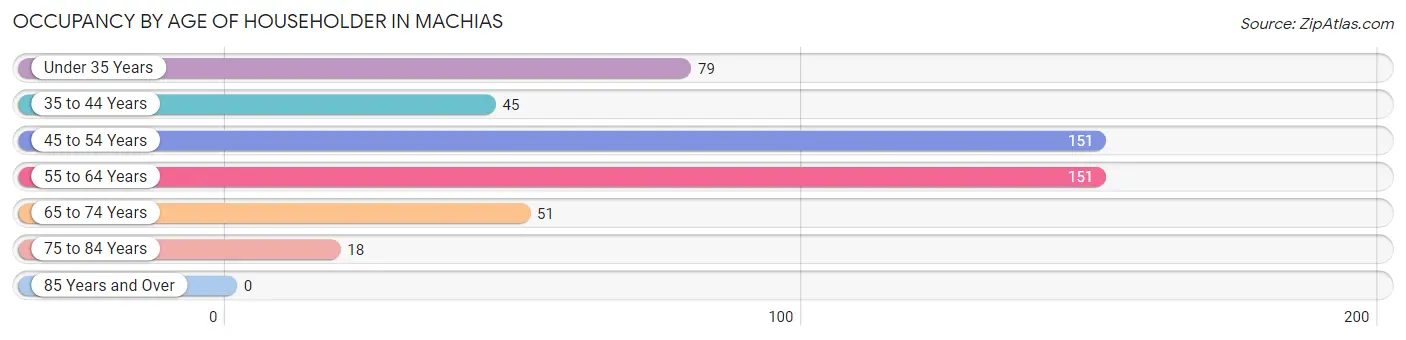
| Age Bracket | # Households | % Households |
| Under 35 Years | 79 | 16.0% |
| 35 to 44 Years | 45 | 9.1% |
| 45 to 54 Years | 151 | 30.5% |
| 55 to 64 Years | 151 | 30.5% |
| 65 to 74 Years | 51 | 10.3% |
| 75 to 84 Years | 18 | 3.6% |
| 85 Years and Over | 0 | 0.0% |
| Total | 495 | 100.0% |
Housing Finances in Machias
Median Income by Occupancy in Machias
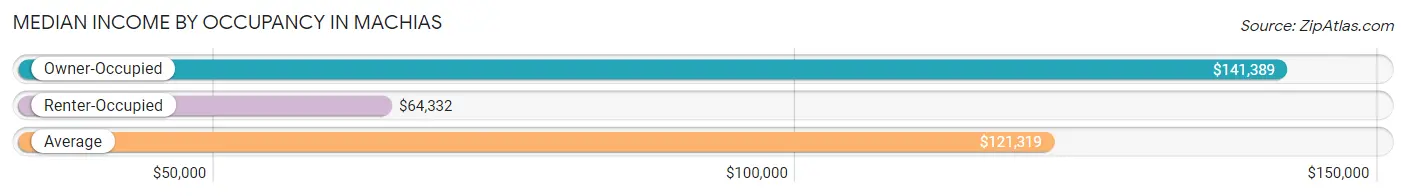
| Occupancy Type | # Households | Median Income |
| Owner-Occupied | 372 (75.1%) | $141,389 |
| Renter-Occupied | 123 (24.8%) | $64,332 |
| Average | 495 (100.0%) | $121,319 |
Occupancy by Householder Income Bracket in Machias
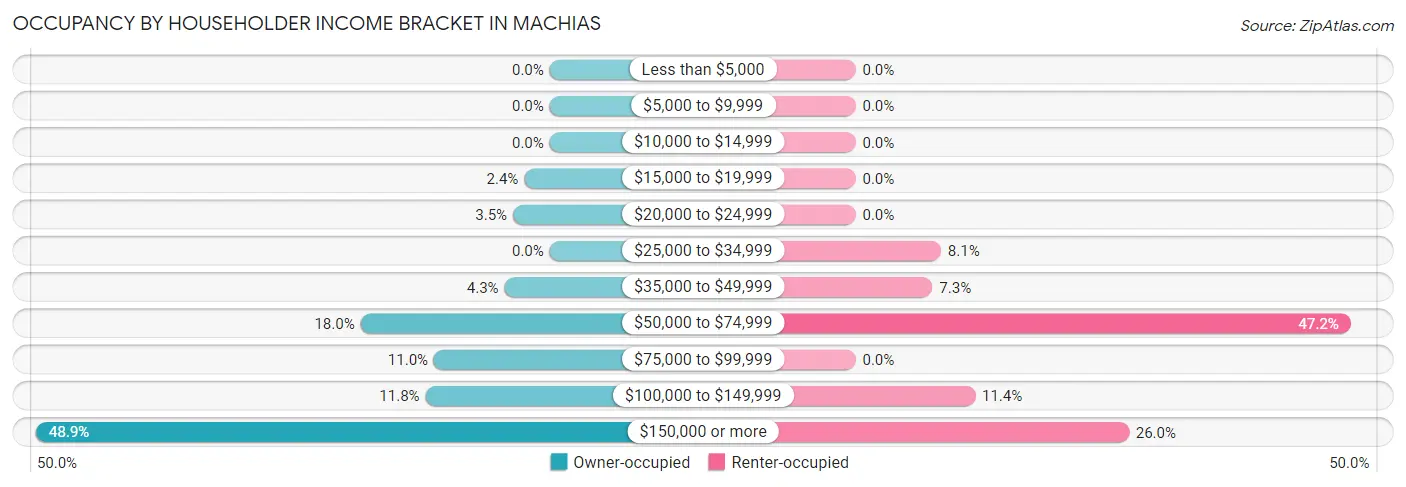
| Income Bracket | Owner-occupied | Renter-occupied |
| Less than $5,000 | 0 (0.0%) | 0 (0.0%) |
| $5,000 to $9,999 | 0 (0.0%) | 0 (0.0%) |
| $10,000 to $14,999 | 0 (0.0%) | 0 (0.0%) |
| $15,000 to $19,999 | 9 (2.4%) | 0 (0.0%) |
| $20,000 to $24,999 | 13 (3.5%) | 0 (0.0%) |
| $25,000 to $34,999 | 0 (0.0%) | 10 (8.1%) |
| $35,000 to $49,999 | 16 (4.3%) | 9 (7.3%) |
| $50,000 to $74,999 | 67 (18.0%) | 58 (47.1%) |
| $75,000 to $99,999 | 41 (11.0%) | 0 (0.0%) |
| $100,000 to $149,999 | 44 (11.8%) | 14 (11.4%) |
| $150,000 or more | 182 (48.9%) | 32 (26.0%) |
| Total | 372 (100.0%) | 123 (100.0%) |
Monthly Housing Cost Tiers in Machias
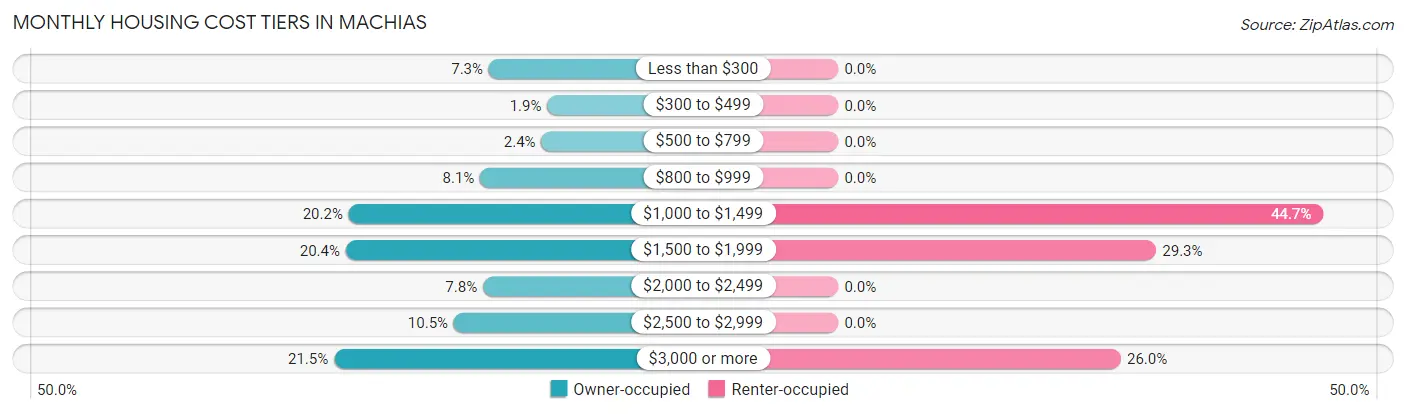
| Monthly Cost | Owner-occupied | Renter-occupied |
| Less than $300 | 27 (7.3%) | 0 (0.0%) |
| $300 to $499 | 7 (1.9%) | 0 (0.0%) |
| $500 to $799 | 9 (2.4%) | 0 (0.0%) |
| $800 to $999 | 30 (8.1%) | 0 (0.0%) |
| $1,000 to $1,499 | 75 (20.2%) | 55 (44.7%) |
| $1,500 to $1,999 | 76 (20.4%) | 36 (29.3%) |
| $2,000 to $2,499 | 29 (7.8%) | 0 (0.0%) |
| $2,500 to $2,999 | 39 (10.5%) | 0 (0.0%) |
| $3,000 or more | 80 (21.5%) | 32 (26.0%) |
| Total | 372 (100.0%) | 123 (100.0%) |
Physical Housing Characteristics in Machias
Housing Structures in Machias
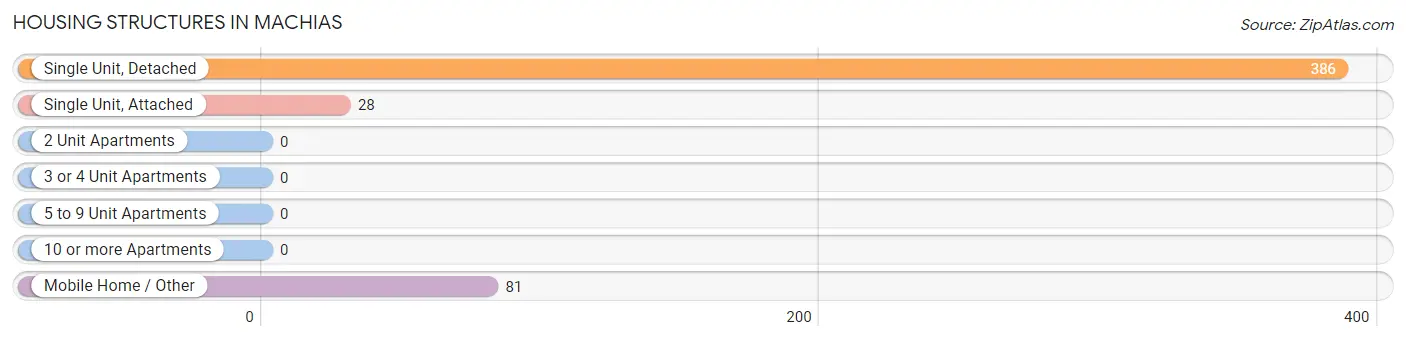
| Structure Type | # Housing Units | % Housing Units |
| Single Unit, Detached | 386 | 78.0% |
| Single Unit, Attached | 28 | 5.7% |
| 2 Unit Apartments | 0 | 0.0% |
| 3 or 4 Unit Apartments | 0 | 0.0% |
| 5 to 9 Unit Apartments | 0 | 0.0% |
| 10 or more Apartments | 0 | 0.0% |
| Mobile Home / Other | 81 | 16.4% |
| Total | 495 | 100.0% |
Housing Structures by Occupancy in Machias
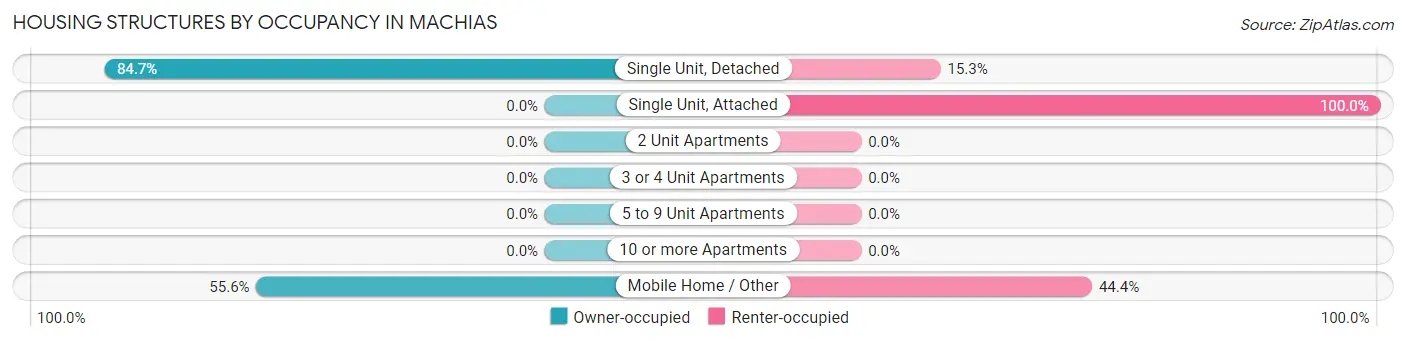
| Structure Type | Owner-occupied | Renter-occupied |
| Single Unit, Detached | 327 (84.7%) | 59 (15.3%) |
| Single Unit, Attached | 0 (0.0%) | 28 (100.0%) |
| 2 Unit Apartments | 0 (0.0%) | 0 (0.0%) |
| 3 or 4 Unit Apartments | 0 (0.0%) | 0 (0.0%) |
| 5 to 9 Unit Apartments | 0 (0.0%) | 0 (0.0%) |
| 10 or more Apartments | 0 (0.0%) | 0 (0.0%) |
| Mobile Home / Other | 45 (55.6%) | 36 (44.4%) |
| Total | 372 (75.1%) | 123 (24.8%) |
Housing Structures by Number of Rooms in Machias
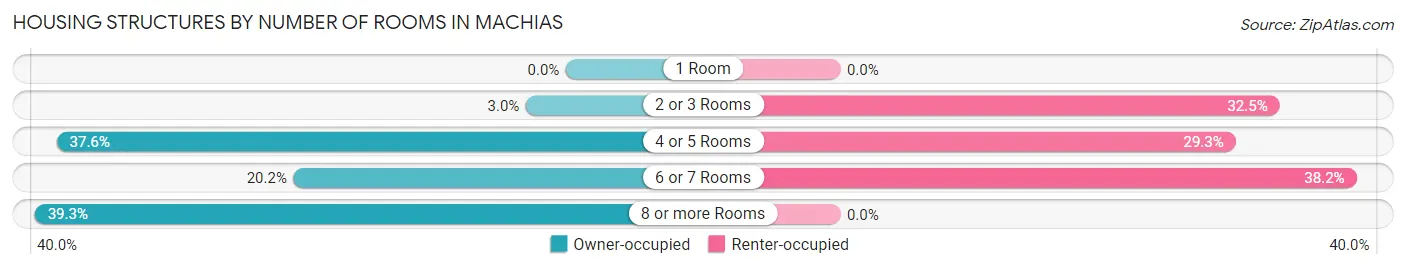
| Number of Rooms | Owner-occupied | Renter-occupied |
| 1 Room | 0 (0.0%) | 0 (0.0%) |
| 2 or 3 Rooms | 11 (3.0%) | 40 (32.5%) |
| 4 or 5 Rooms | 140 (37.6%) | 36 (29.3%) |
| 6 or 7 Rooms | 75 (20.2%) | 47 (38.2%) |
| 8 or more Rooms | 146 (39.3%) | 0 (0.0%) |
| Total | 372 (100.0%) | 123 (100.0%) |
Housing Structure by Heating Type in Machias
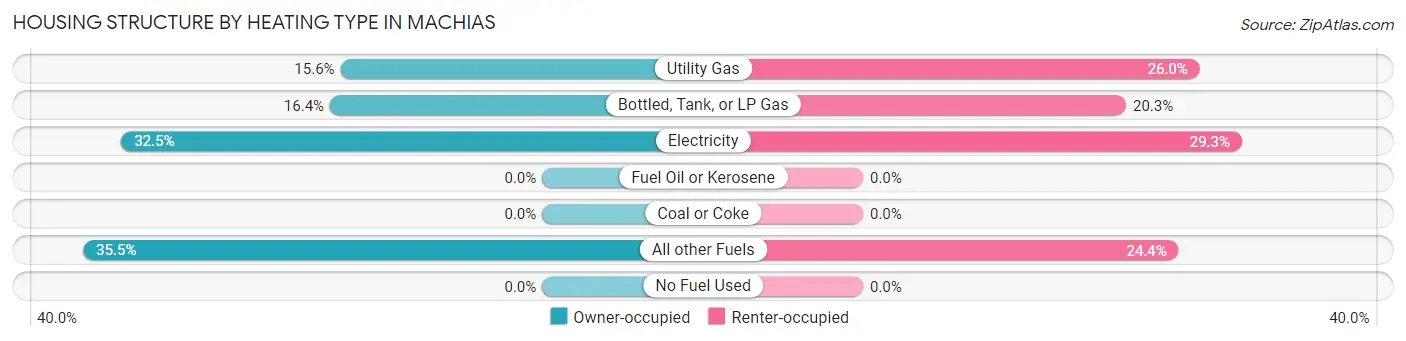
| Heating Type | Owner-occupied | Renter-occupied |
| Utility Gas | 58 (15.6%) | 32 (26.0%) |
| Bottled, Tank, or LP Gas | 61 (16.4%) | 25 (20.3%) |
| Electricity | 121 (32.5%) | 36 (29.3%) |
| Fuel Oil or Kerosene | 0 (0.0%) | 0 (0.0%) |
| Coal or Coke | 0 (0.0%) | 0 (0.0%) |
| All other Fuels | 132 (35.5%) | 30 (24.4%) |
| No Fuel Used | 0 (0.0%) | 0 (0.0%) |
| Total | 372 (100.0%) | 123 (100.0%) |
Household Vehicle Usage in Machias
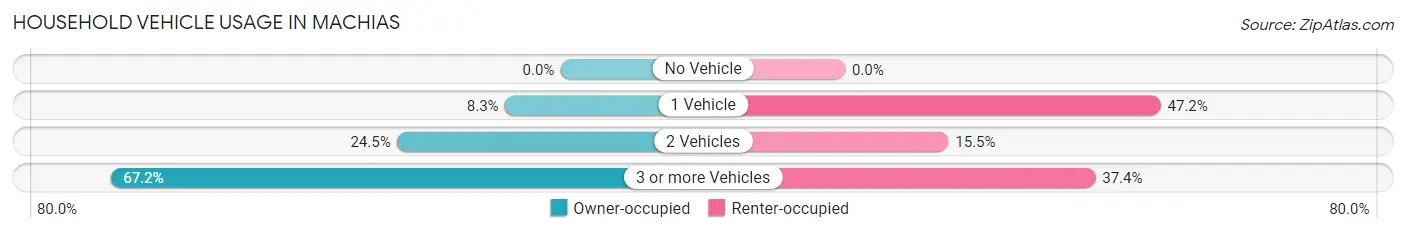
| Vehicles per Household | Owner-occupied | Renter-occupied |
| No Vehicle | 0 (0.0%) | 0 (0.0%) |
| 1 Vehicle | 31 (8.3%) | 58 (47.1%) |
| 2 Vehicles | 91 (24.5%) | 19 (15.4%) |
| 3 or more Vehicles | 250 (67.2%) | 46 (37.4%) |
| Total | 372 (100.0%) | 123 (100.0%) |
Real Estate & Mortgages in Machias
Real Estate and Mortgage Overview in Machias
| Characteristic | Without Mortgage | With Mortgage |
| Housing Units | 102 | 270 |
| Median Property Value | $573,900 | $591,800 |
| Median Household Income | $83,409 | $154 |
| Monthly Housing Costs | $838 | $80 |
| Real Estate Taxes | $5,385 | $0 |
Property Value by Mortgage Status in Machias
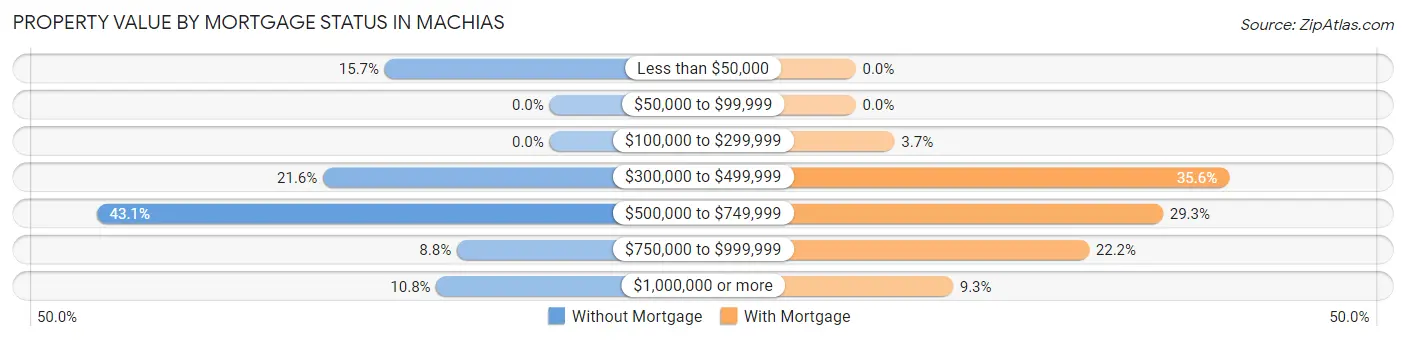
| Property Value | Without Mortgage | With Mortgage |
| Less than $50,000 | 16 (15.7%) | 0 (0.0%) |
| $50,000 to $99,999 | 0 (0.0%) | 0 (0.0%) |
| $100,000 to $299,999 | 0 (0.0%) | 10 (3.7%) |
| $300,000 to $499,999 | 22 (21.6%) | 96 (35.6%) |
| $500,000 to $749,999 | 44 (43.1%) | 79 (29.3%) |
| $750,000 to $999,999 | 9 (8.8%) | 60 (22.2%) |
| $1,000,000 or more | 11 (10.8%) | 25 (9.3%) |
| Total | 102 (100.0%) | 270 (100.0%) |
Household Income by Mortgage Status in Machias
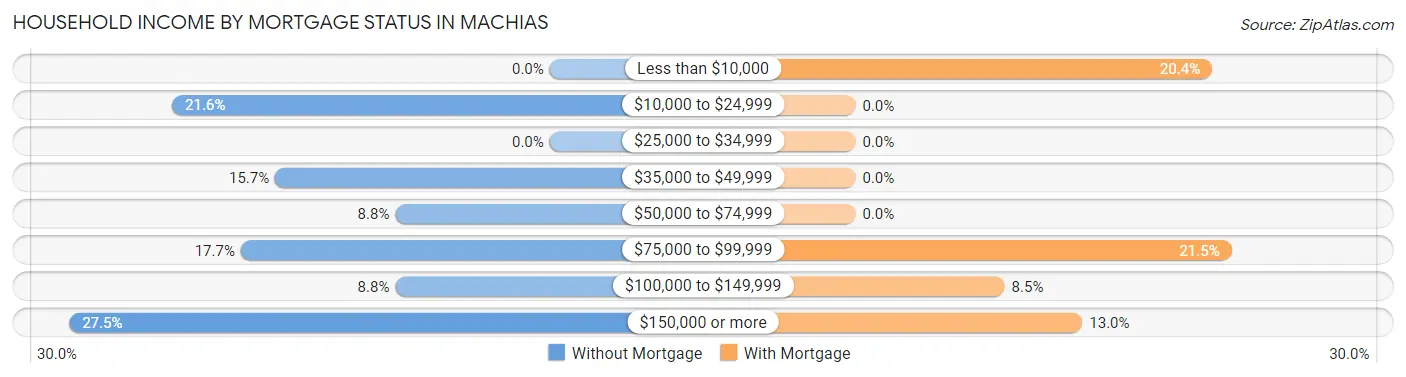
| Household Income | Without Mortgage | With Mortgage |
| Less than $10,000 | 0 (0.0%) | 55 (20.4%) |
| $10,000 to $24,999 | 22 (21.6%) | 0 (0.0%) |
| $25,000 to $34,999 | 0 (0.0%) | 0 (0.0%) |
| $35,000 to $49,999 | 16 (15.7%) | 0 (0.0%) |
| $50,000 to $74,999 | 9 (8.8%) | 0 (0.0%) |
| $75,000 to $99,999 | 18 (17.6%) | 58 (21.5%) |
| $100,000 to $149,999 | 9 (8.8%) | 23 (8.5%) |
| $150,000 or more | 28 (27.5%) | 35 (13.0%) |
| Total | 102 (100.0%) | 270 (100.0%) |
Property Value to Household Income Ratio in Machias
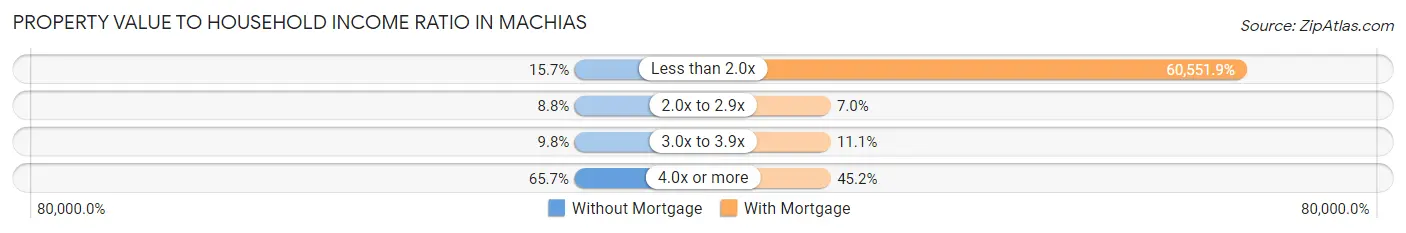
| Value-to-Income Ratio | Without Mortgage | With Mortgage |
| Less than 2.0x | 16 (15.7%) | 163,490 (60,551.9%) |
| 2.0x to 2.9x | 9 (8.8%) | 19 (7.0%) |
| 3.0x to 3.9x | 10 (9.8%) | 30 (11.1%) |
| 4.0x or more | 67 (65.7%) | 122 (45.2%) |
| Total | 102 (100.0%) | 270 (100.0%) |
Real Estate Taxes by Mortgage Status in Machias
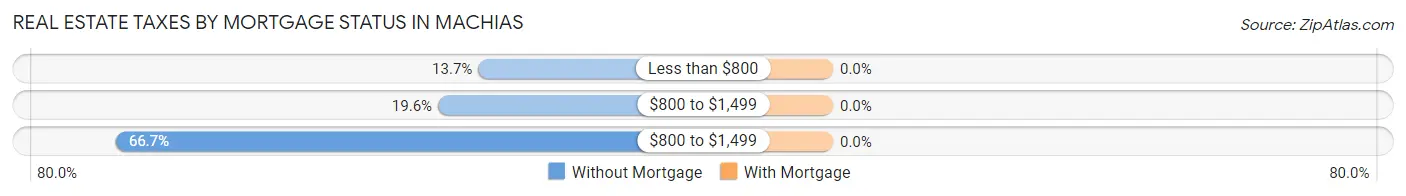
| Property Taxes | Without Mortgage | With Mortgage |
| Less than $800 | 14 (13.7%) | 0 (0.0%) |
| $800 to $1,499 | 20 (19.6%) | 0 (0.0%) |
| $800 to $1,499 | 68 (66.7%) | 0 (0.0%) |
| Total | 102 (100.0%) | 270 (100.0%) |
Health & Disability in Machias
Health Insurance Coverage by Age in Machias
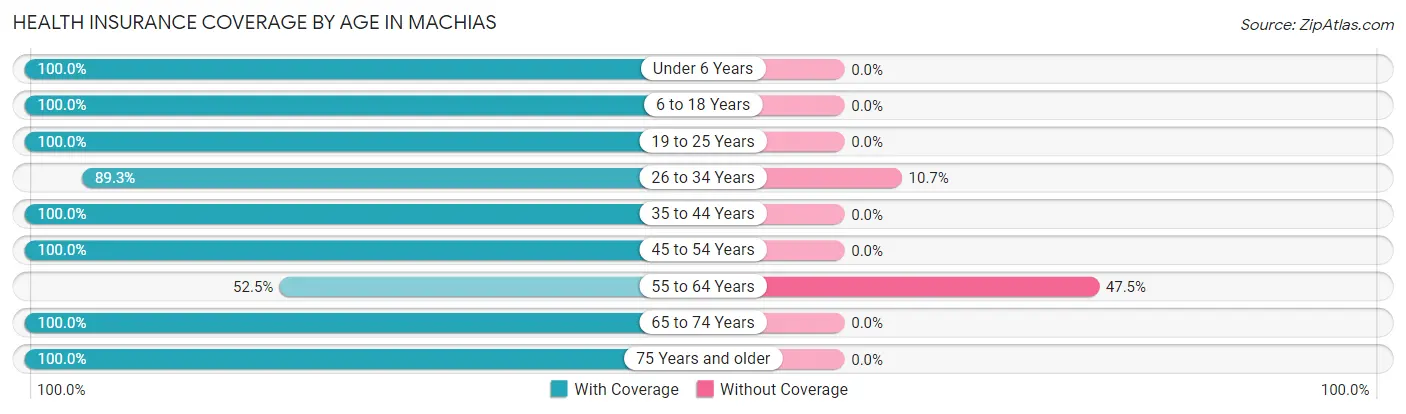
| Age Bracket | With Coverage | Without Coverage |
| Under 6 Years | 88 (100.0%) | 0 (0.0%) |
| 6 to 18 Years | 193 (100.0%) | 0 (0.0%) |
| 19 to 25 Years | 175 (100.0%) | 0 (0.0%) |
| 26 to 34 Years | 142 (89.3%) | 17 (10.7%) |
| 35 to 44 Years | 54 (100.0%) | 0 (0.0%) |
| 45 to 54 Years | 298 (100.0%) | 0 (0.0%) |
| 55 to 64 Years | 104 (52.5%) | 94 (47.5%) |
| 65 to 74 Years | 58 (100.0%) | 0 (0.0%) |
| 75 Years and older | 37 (100.0%) | 0 (0.0%) |
| Total | 1,149 (91.2%) | 111 (8.8%) |
Health Insurance Coverage by Citizenship Status in Machias
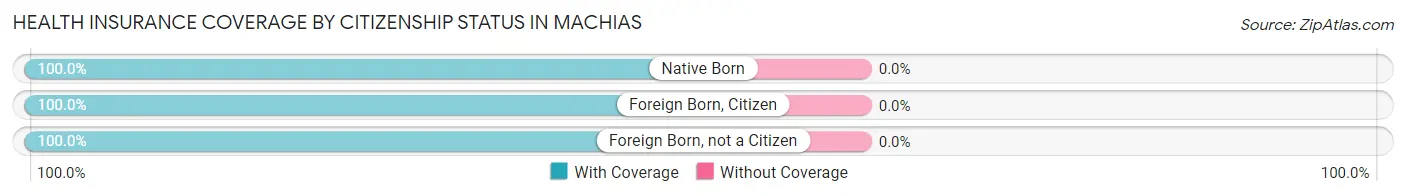
| Citizenship Status | With Coverage | Without Coverage |
| Native Born | 88 (100.0%) | 0 (0.0%) |
| Foreign Born, Citizen | 193 (100.0%) | 0 (0.0%) |
| Foreign Born, not a Citizen | 175 (100.0%) | 0 (0.0%) |
Health Insurance Coverage by Household Income in Machias
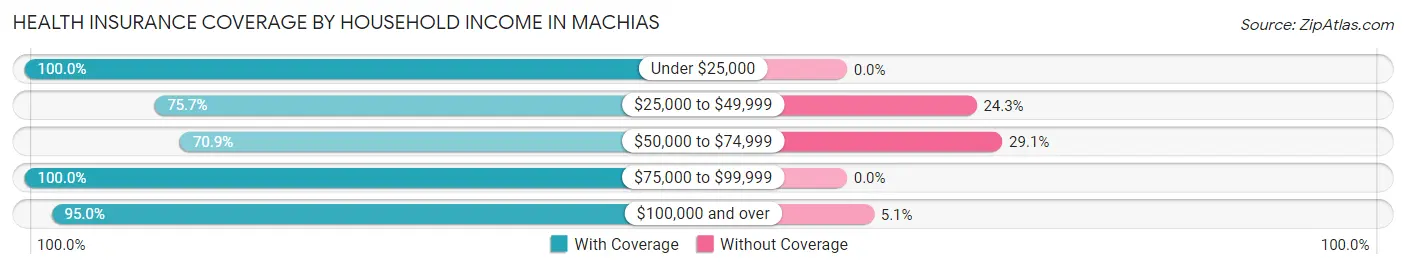
| Household Income | With Coverage | Without Coverage |
| Under $25,000 | 22 (100.0%) | 0 (0.0%) |
| $25,000 to $49,999 | 53 (75.7%) | 17 (24.3%) |
| $50,000 to $74,999 | 112 (70.9%) | 46 (29.1%) |
| $75,000 to $99,999 | 59 (100.0%) | 0 (0.0%) |
| $100,000 and over | 903 (95.0%) | 48 (5.1%) |
Public vs Private Health Insurance Coverage by Age in Machias
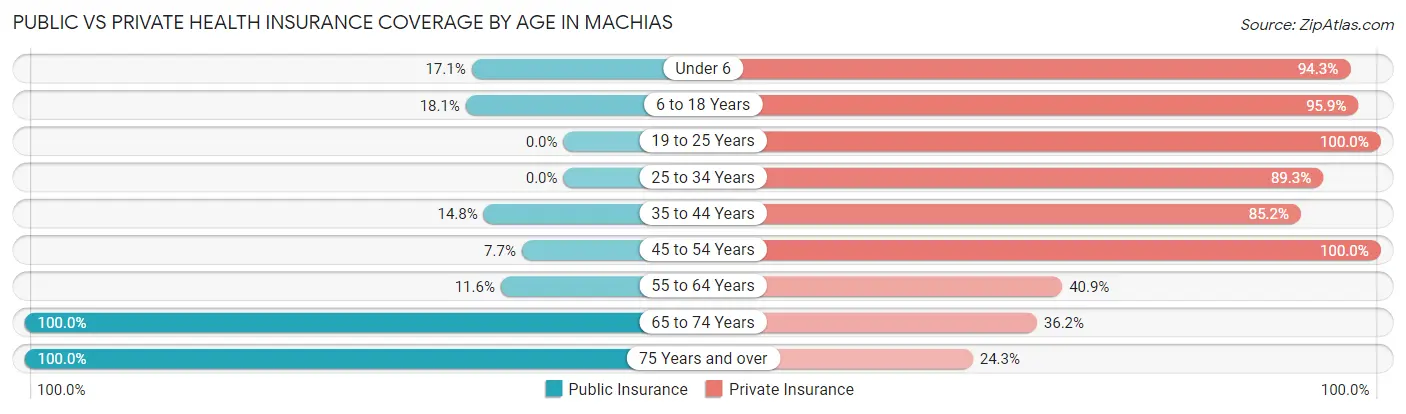
| Age Bracket | Public Insurance | Private Insurance |
| Under 6 | 15 (17.1%) | 83 (94.3%) |
| 6 to 18 Years | 35 (18.1%) | 185 (95.9%) |
| 19 to 25 Years | 0 (0.0%) | 175 (100.0%) |
| 25 to 34 Years | 0 (0.0%) | 142 (89.3%) |
| 35 to 44 Years | 8 (14.8%) | 46 (85.2%) |
| 45 to 54 Years | 23 (7.7%) | 298 (100.0%) |
| 55 to 64 Years | 23 (11.6%) | 81 (40.9%) |
| 65 to 74 Years | 58 (100.0%) | 21 (36.2%) |
| 75 Years and over | 37 (100.0%) | 9 (24.3%) |
| Total | 199 (15.8%) | 1,040 (82.5%) |
Disability Status by Sex by Age in Machias
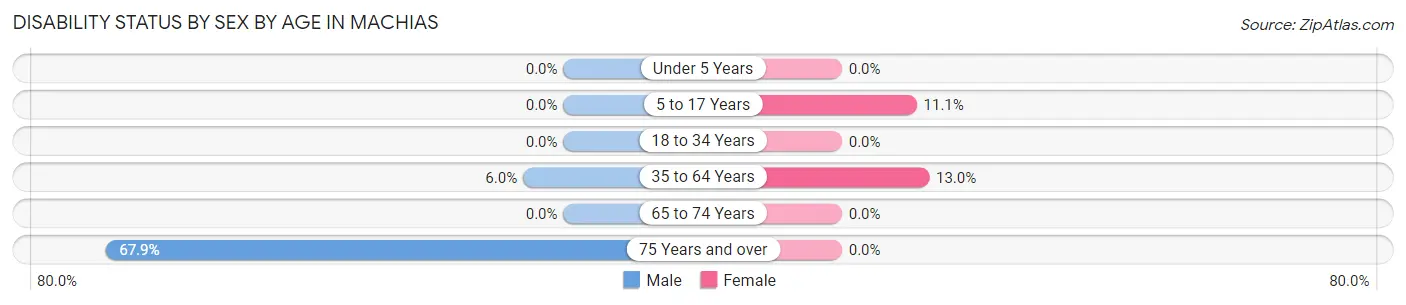
| Age Bracket | Male | Female |
| Under 5 Years | 0 (0.0%) | 0 (0.0%) |
| 5 to 17 Years | 0 (0.0%) | 8 (11.1%) |
| 18 to 34 Years | 0 (0.0%) | 0 (0.0%) |
| 35 to 64 Years | 20 (6.0%) | 28 (13.0%) |
| 65 to 74 Years | 0 (0.0%) | 0 (0.0%) |
| 75 Years and over | 19 (67.9%) | 0 (0.0%) |
Disability Class by Sex by Age in Machias
Disability Class: Hearing Difficulty
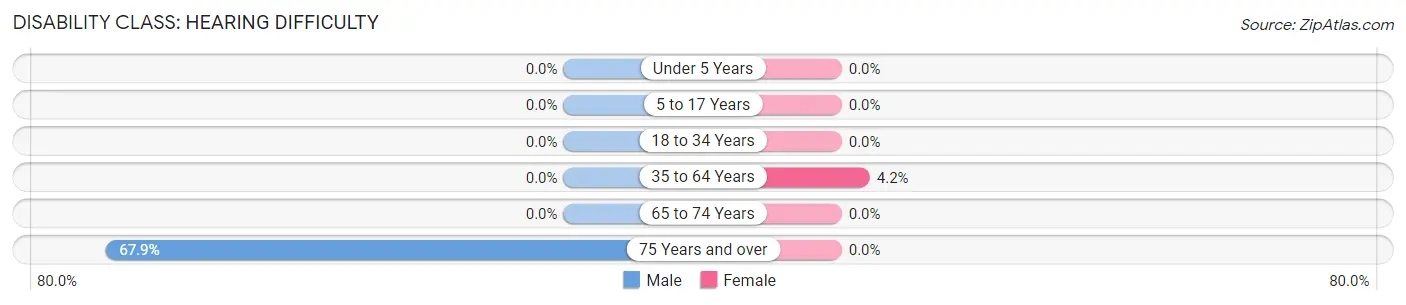
| Age Bracket | Male | Female |
| Under 5 Years | 0 (0.0%) | 0 (0.0%) |
| 5 to 17 Years | 0 (0.0%) | 0 (0.0%) |
| 18 to 34 Years | 0 (0.0%) | 0 (0.0%) |
| 35 to 64 Years | 0 (0.0%) | 9 (4.2%) |
| 65 to 74 Years | 0 (0.0%) | 0 (0.0%) |
| 75 Years and over | 19 (67.9%) | 0 (0.0%) |
Disability Class: Vision Difficulty
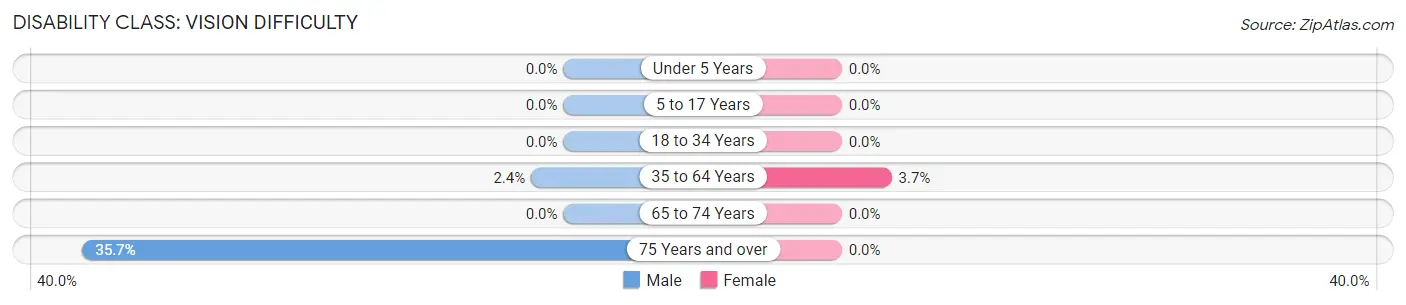
| Age Bracket | Male | Female |
| Under 5 Years | 0 (0.0%) | 0 (0.0%) |
| 5 to 17 Years | 0 (0.0%) | 0 (0.0%) |
| 18 to 34 Years | 0 (0.0%) | 0 (0.0%) |
| 35 to 64 Years | 8 (2.4%) | 8 (3.7%) |
| 65 to 74 Years | 0 (0.0%) | 0 (0.0%) |
| 75 Years and over | 10 (35.7%) | 0 (0.0%) |
Disability Class: Cognitive Difficulty
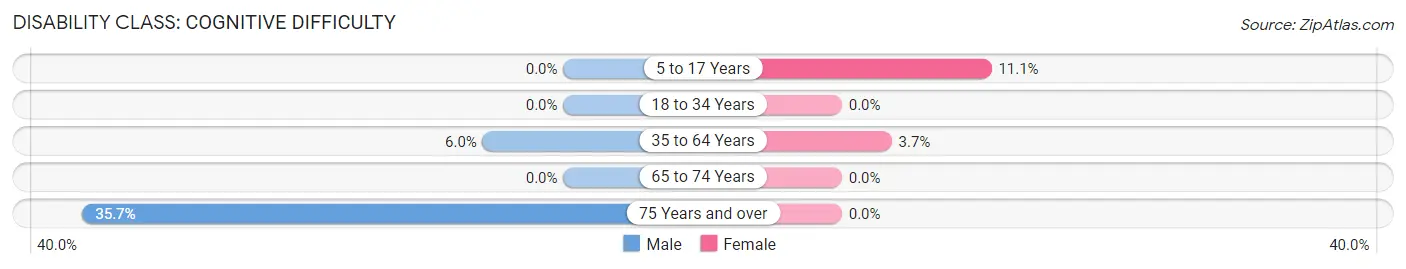
| Age Bracket | Male | Female |
| 5 to 17 Years | 0 (0.0%) | 8 (11.1%) |
| 18 to 34 Years | 0 (0.0%) | 0 (0.0%) |
| 35 to 64 Years | 20 (6.0%) | 8 (3.7%) |
| 65 to 74 Years | 0 (0.0%) | 0 (0.0%) |
| 75 Years and over | 10 (35.7%) | 0 (0.0%) |
Disability Class: Ambulatory Difficulty
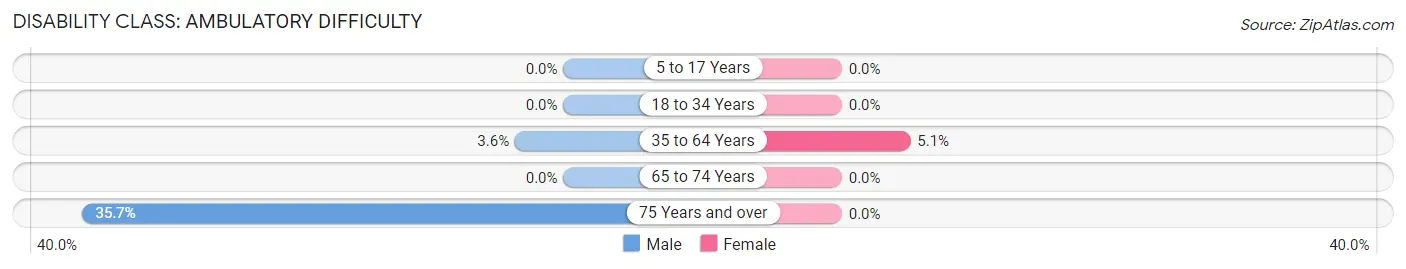
| Age Bracket | Male | Female |
| 5 to 17 Years | 0 (0.0%) | 0 (0.0%) |
| 18 to 34 Years | 0 (0.0%) | 0 (0.0%) |
| 35 to 64 Years | 12 (3.6%) | 11 (5.1%) |
| 65 to 74 Years | 0 (0.0%) | 0 (0.0%) |
| 75 Years and over | 10 (35.7%) | 0 (0.0%) |
Disability Class: Self-Care Difficulty
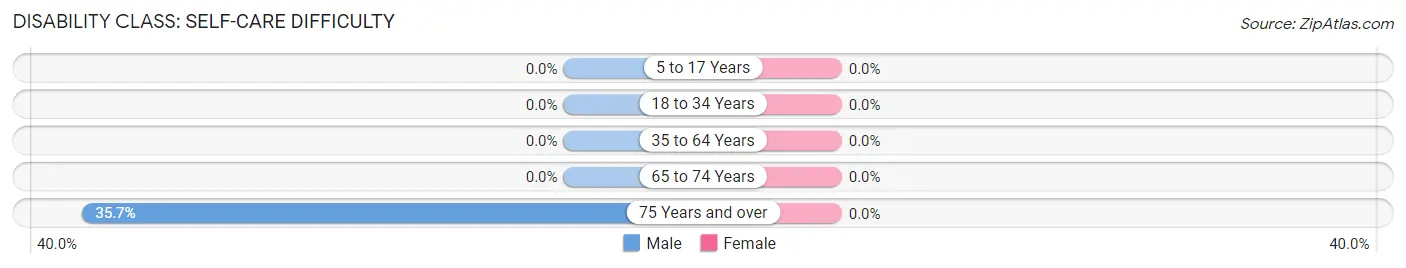
| Age Bracket | Male | Female |
| 5 to 17 Years | 0 (0.0%) | 0 (0.0%) |
| 18 to 34 Years | 0 (0.0%) | 0 (0.0%) |
| 35 to 64 Years | 0 (0.0%) | 0 (0.0%) |
| 65 to 74 Years | 0 (0.0%) | 0 (0.0%) |
| 75 Years and over | 10 (35.7%) | 0 (0.0%) |
Technology Access in Machias
Computing Device Access in Machias
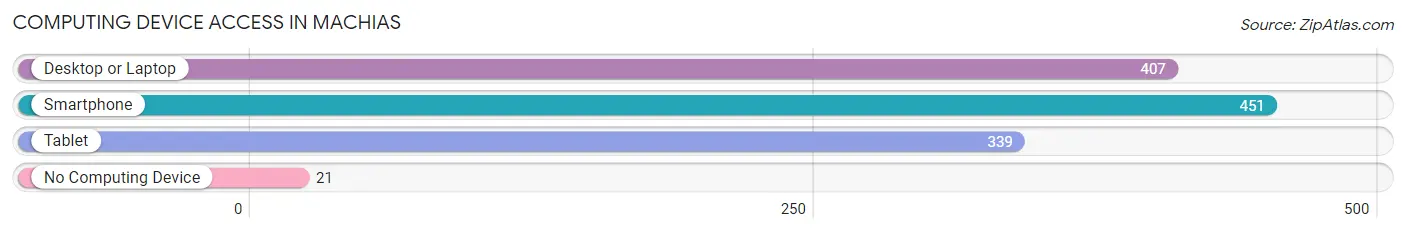
| Device Type | # Households | % Households |
| Desktop or Laptop | 407 | 82.2% |
| Smartphone | 451 | 91.1% |
| Tablet | 339 | 68.5% |
| No Computing Device | 21 | 4.2% |
| Total | 495 | 100.0% |
Internet Access in Machias
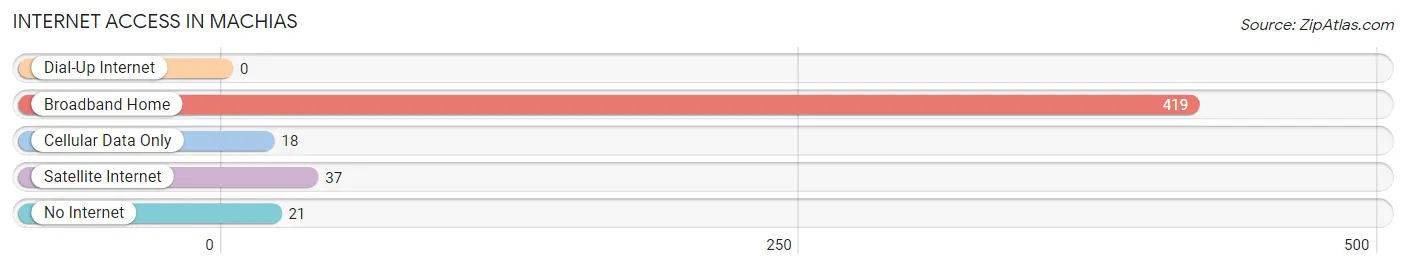
| Internet Type | # Households | % Households |
| Dial-Up Internet | 0 | 0.0% |
| Broadband Home | 419 | 84.7% |
| Cellular Data Only | 18 | 3.6% |
| Satellite Internet | 37 | 7.5% |
| No Internet | 21 | 4.2% |
| Total | 495 | 100.0% |
Machias Summary
History
The town of Machias, Washington is located in Snohomish County, approximately 25 miles northeast of Seattle. The area was first settled in the late 1800s by homesteaders, and the town was officially incorporated in 1909. The town was named after Machias, Maine, which was the hometown of one of the original settlers.
The town of Machias has a rich history of logging and farming. In the early 1900s, the town was home to several sawmills and logging camps. The town also had a thriving dairy industry, with several dairy farms located in the area. The town was also home to a number of small businesses, including a general store, a blacksmith shop, and a hotel.
In the 1950s, the town began to experience a decline in population as many of the local businesses closed. However, in the late 1970s, the town began to experience a resurgence as new businesses opened and the population began to grow again.
Today, Machias is a small, rural town with a population of approximately 1,500 people. The town is home to several small businesses, including a grocery store, a hardware store, and a few restaurants. The town also has a post office, a library, and a community center.
Geography
The town of Machias is located in the Cascade Mountains of Washington State. The town is situated at the confluence of the Stillaguamish and Skykomish Rivers. The town is surrounded by lush forests and rolling hills, and is home to several small lakes and streams.
The town is located approximately 25 miles northeast of Seattle, and is accessible by car via Highway 2. The town is also served by a small airport, which is located just outside of town.
Economy
The economy of Machias is largely based on tourism and agriculture. The town is home to several small businesses, including a grocery store, a hardware store, and a few restaurants. The town also has a post office, a library, and a community center.
The town is also home to several small farms, which produce a variety of crops, including apples, cherries, and vegetables. The town is also home to several wineries, which produce a variety of wines.
Demographics
As of the 2010 census, the population of Machias was 1,521. The town is predominantly white, with approximately 95% of the population being white. The town also has a small Hispanic population, with approximately 4% of the population being Hispanic. The median household income in the town is approximately $50,000. The town has a low unemployment rate, with only 4.2% of the population being unemployed.
Common Questions
What is Per Capita Income in Machias?
Per Capita income in Machias is $51,636.
What is the Median Family Income in Machias?
Median Family Income in Machias is $165,117.
What is the Median Household income in Machias?
Median Household Income in Machias is $121,319.
What is Income or Wage Gap in Machias?
Income or Wage Gap in Machias is 1.2%.
Women in Machias earn 98.8 cents for every dollar earned by a man.
What is Inequality or Gini Index in Machias?
Inequality or Gini Index in Machias is 0.35.
What is the Total Population of Machias?
Total Population of Machias is 1,260.
What is the Total Male Population of Machias?
Total Male Population of Machias is 764.
What is the Total Female Population of Machias?
Total Female Population of Machias is 496.
What is the Ratio of Males per 100 Females in Machias?
There are 154.03 Males per 100 Females in Machias.
What is the Ratio of Females per 100 Males in Machias?
There are 64.92 Females per 100 Males in Machias.
What is the Median Population Age in Machias?
Median Population Age in Machias is 36.4 Years.
What is the Average Family Size in Machias
Average Family Size in Machias is 3.4 People.
What is the Average Household Size in Machias
Average Household Size in Machias is 2.5 People.
How Large is the Labor Force in Machias?
There are 797 People in the Labor Forcein in Machias.
What is the Percentage of People in the Labor Force in Machias?
78.3% of People are in the Labor Force in Machias.
What is the Unemployment Rate in Machias?
Unemployment Rate in Machias is 8.4%.