Zip Codes with the Highest Percentage of Families with Income Above $200,000 in Washington
RELATED REPORTS & OPTIONS
Family Income | $200k+
Washington
Compare Zip Codes
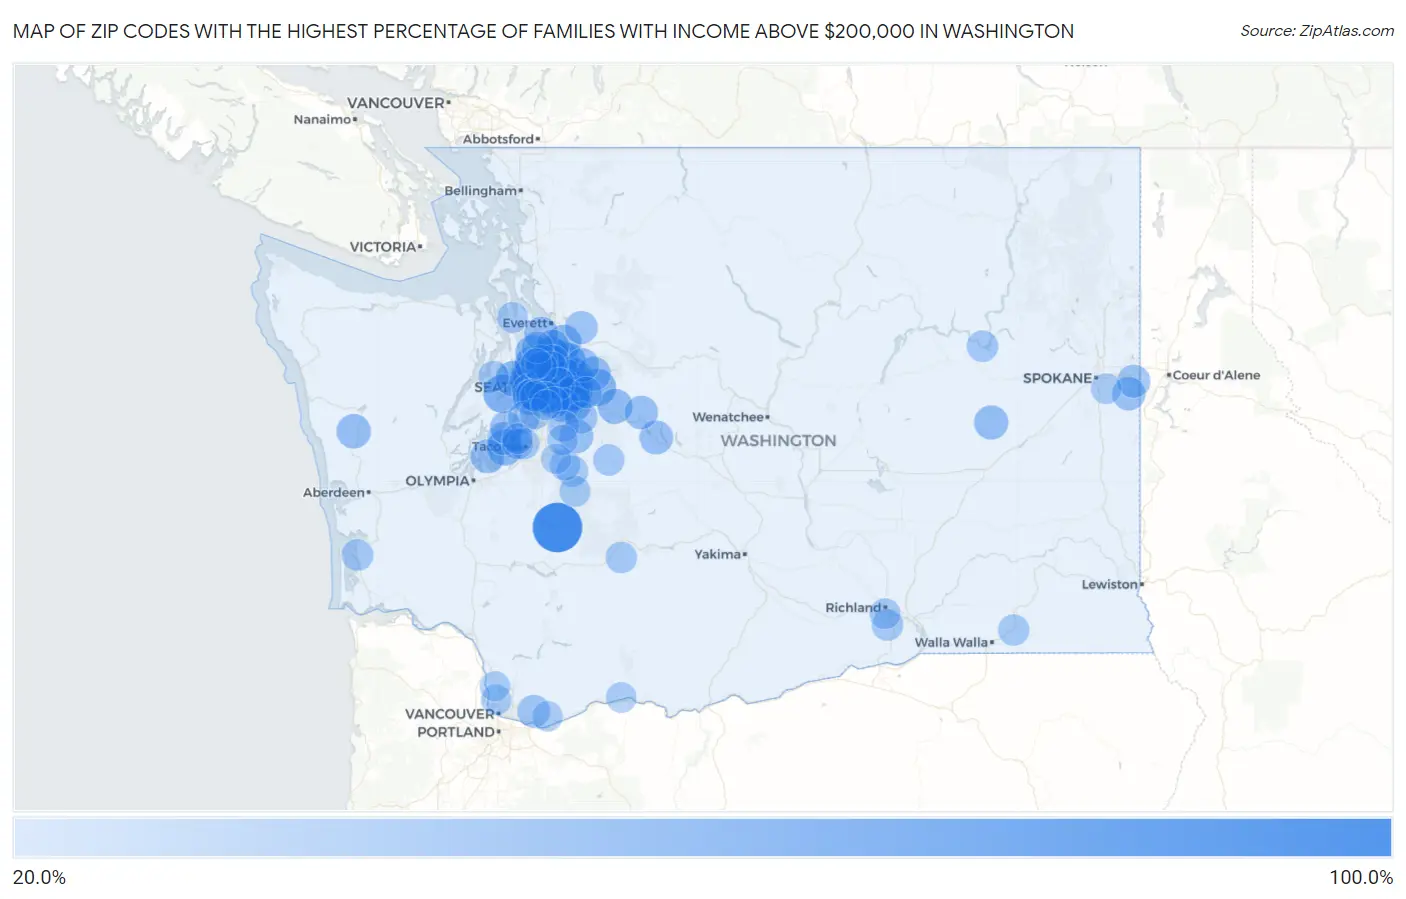
Map of Zip Codes with the Highest Percentage of Families with Income Above $200,000 in Washington
20.0%
100.0%
Zip Codes with the Highest Percentage of Families with Income Above $200,000 in Washington
| Zip Code | Families with Income > $200k | vs State | vs National | |
| 1. | 98330 | 100.0% | 19.4%(+80.6)#1 | 14.8%(+85.2)#41 |
| 2. | 98164 | 80.9% | 19.4%(+61.5)#2 | 14.8%(+66.1)#67 |
| 3. | 98039 | 65.1% | 19.4%(+45.7)#3 | 14.8%(+50.3)#187 |
| 4. | 98075 | 63.2% | 19.4%(+43.8)#4 | 14.8%(+48.4)#217 |
| 5. | 98040 | 61.4% | 19.4%(+42.0)#5 | 14.8%(+46.6)#260 |
| 6. | 98074 | 60.7% | 19.4%(+41.3)#6 | 14.8%(+45.9)#274 |
| 7. | 98112 | 59.7% | 19.4%(+40.3)#7 | 14.8%(+44.9)#305 |
| 8. | 98004 | 54.8% | 19.4%(+35.4)#8 | 14.8%(+40.0)#459 |
| 9. | 98117 | 54.7% | 19.4%(+35.3)#9 | 14.8%(+39.9)#465 |
| 10. | 98314 | 53.8% | 19.4%(+34.4)#10 | 14.8%(+39.0)#504 |
| 11. | 98105 | 53.6% | 19.4%(+34.2)#11 | 14.8%(+38.8)#511 |
| 12. | 98121 | 53.2% | 19.4%(+33.8)#12 | 14.8%(+38.4)#524 |
| 13. | 98033 | 52.6% | 19.4%(+33.2)#13 | 14.8%(+37.8)#549 |
| 14. | 98119 | 52.4% | 19.4%(+33.0)#14 | 14.8%(+37.6)#556 |
| 15. | 98109 | 52.1% | 19.4%(+32.7)#15 | 14.8%(+37.3)#569 |
| 16. | 98053 | 52.0% | 19.4%(+32.6)#16 | 14.8%(+37.2)#572 |
| 17. | 98006 | 51.3% | 19.4%(+31.9)#17 | 14.8%(+36.5)#600 |
| 18. | 98115 | 50.9% | 19.4%(+31.5)#18 | 14.8%(+36.1)#624 |
| 19. | 98199 | 50.8% | 19.4%(+31.4)#19 | 14.8%(+36.0)#630 |
| 20. | 98134 | 50.0% | 19.4%(+30.6)#20 | 14.8%(+35.2)#662 |
| 21. | 98101 | 49.8% | 19.4%(+30.4)#21 | 14.8%(+35.0)#679 |
| 22. | 98065 | 49.6% | 19.4%(+30.2)#22 | 14.8%(+34.8)#687 |
| 23. | 98103 | 49.3% | 19.4%(+29.9)#23 | 14.8%(+34.5)#701 |
| 24. | 98102 | 49.3% | 19.4%(+29.9)#24 | 14.8%(+34.5)#703 |
| 25. | 98107 | 49.2% | 19.4%(+29.8)#25 | 14.8%(+34.4)#707 |
| 26. | 98072 | 47.2% | 19.4%(+27.8)#26 | 14.8%(+32.4)#802 |
| 27. | 98077 | 46.8% | 19.4%(+27.4)#27 | 14.8%(+32.0)#826 |
| 28. | 98052 | 46.2% | 19.4%(+26.8)#28 | 14.8%(+31.4)#853 |
| 29. | 98333 | 45.3% | 19.4%(+25.9)#29 | 14.8%(+30.5)#924 |
| 30. | 98008 | 44.6% | 19.4%(+25.2)#30 | 14.8%(+29.8)#954 |
| 31. | 98110 | 44.3% | 19.4%(+24.9)#31 | 14.8%(+29.5)#974 |
| 32. | 98005 | 44.2% | 19.4%(+24.8)#32 | 14.8%(+29.4)#981 |
| 33. | 98177 | 43.6% | 19.4%(+24.2)#33 | 14.8%(+28.8)#1,018 |
| 34. | 98116 | 43.4% | 19.4%(+24.0)#34 | 14.8%(+28.6)#1,029 |
| 35. | 98296 | 42.2% | 19.4%(+22.8)#35 | 14.8%(+27.4)#1,120 |
| 36. | 98021 | 42.0% | 19.4%(+22.6)#36 | 14.8%(+27.2)#1,133 |
| 37. | 98029 | 42.0% | 19.4%(+22.6)#37 | 14.8%(+27.2)#1,134 |
| 38. | 98027 | 42.0% | 19.4%(+22.6)#38 | 14.8%(+27.2)#1,135 |
| 39. | 98122 | 41.5% | 19.4%(+22.1)#39 | 14.8%(+26.7)#1,182 |
| 40. | 98136 | 40.6% | 19.4%(+21.2)#40 | 14.8%(+25.8)#1,267 |
| 41. | 98045 | 40.5% | 19.4%(+21.1)#41 | 14.8%(+25.7)#1,273 |
| 42. | 98028 | 40.1% | 19.4%(+20.7)#42 | 14.8%(+25.3)#1,301 |
| 43. | 98020 | 38.3% | 19.4%(+18.9)#43 | 14.8%(+23.5)#1,480 |
| 44. | 98552 | 38.3% | 19.4%(+18.9)#44 | 14.8%(+23.5)#1,486 |
| 45. | 99154 | 37.5% | 19.4%(+18.1)#45 | 14.8%(+22.7)#1,562 |
| 46. | 98059 | 37.4% | 19.4%(+18.0)#46 | 14.8%(+22.6)#1,564 |
| 47. | 98014 | 37.1% | 19.4%(+17.7)#47 | 14.8%(+22.3)#1,596 |
| 48. | 98275 | 36.7% | 19.4%(+17.3)#48 | 14.8%(+21.9)#1,641 |
| 49. | 98010 | 36.7% | 19.4%(+17.3)#49 | 14.8%(+21.9)#1,647 |
| 50. | 98351 | 36.4% | 19.4%(+17.0)#50 | 14.8%(+21.6)#1,693 |
| 51. | 98925 | 36.0% | 19.4%(+16.6)#51 | 14.8%(+21.2)#1,734 |
| 52. | 98068 | 34.7% | 19.4%(+15.3)#52 | 14.8%(+19.9)#1,882 |
| 53. | 98012 | 34.5% | 19.4%(+15.1)#53 | 14.8%(+19.7)#1,899 |
| 54. | 98019 | 34.5% | 19.4%(+15.1)#54 | 14.8%(+19.7)#1,905 |
| 55. | 99023 | 34.3% | 19.4%(+14.9)#55 | 14.8%(+19.5)#1,928 |
| 56. | 98335 | 33.3% | 19.4%(+13.9)#56 | 14.8%(+18.5)#2,047 |
| 57. | 98011 | 33.1% | 19.4%(+13.7)#57 | 14.8%(+18.3)#2,092 |
| 58. | 99019 | 32.7% | 19.4%(+13.3)#58 | 14.8%(+17.9)#2,140 |
| 59. | 98144 | 32.5% | 19.4%(+13.1)#59 | 14.8%(+17.7)#2,164 |
| 60. | 98290 | 31.9% | 19.4%(+12.5)#60 | 14.8%(+17.1)#2,231 |
| 61. | 98126 | 31.8% | 19.4%(+12.4)#61 | 14.8%(+17.0)#2,257 |
| 62. | 98155 | 31.6% | 19.4%(+12.2)#62 | 14.8%(+16.8)#2,280 |
| 63. | 98332 | 31.3% | 19.4%(+11.9)#63 | 14.8%(+16.5)#2,324 |
| 64. | 98607 | 31.0% | 19.4%(+11.6)#64 | 14.8%(+16.2)#2,365 |
| 65. | 98034 | 29.8% | 19.4%(+10.4)#65 | 14.8%(+15.0)#2,535 |
| 66. | 98038 | 29.8% | 19.4%(+10.4)#66 | 14.8%(+15.0)#2,538 |
| 67. | 98007 | 29.0% | 19.4%(+9.60)#67 | 14.8%(+14.2)#2,668 |
| 68. | 98125 | 28.5% | 19.4%(+9.10)#68 | 14.8%(+13.7)#2,776 |
| 69. | 98070 | 28.5% | 19.4%(+9.10)#69 | 14.8%(+13.7)#2,786 |
| 70. | 98026 | 27.8% | 19.4%(+8.40)#70 | 14.8%(+13.0)#2,889 |
| 71. | 98118 | 27.5% | 19.4%(+8.10)#71 | 14.8%(+12.7)#2,943 |
| 72. | 98527 | 27.5% | 19.4%(+8.10)#72 | 14.8%(+12.7)#2,965 |
| 73. | 98024 | 26.9% | 19.4%(+7.50)#73 | 14.8%(+12.1)#3,070 |
| 74. | 98056 | 26.7% | 19.4%(+7.30)#74 | 14.8%(+11.9)#3,102 |
| 75. | 99338 | 26.7% | 19.4%(+7.30)#75 | 14.8%(+11.9)#3,105 |
| 76. | 99147 | 26.6% | 19.4%(+7.20)#76 | 14.8%(+11.8)#3,143 |
| 77. | 98022 | 26.0% | 19.4%(+6.60)#77 | 14.8%(+11.2)#3,242 |
| 78. | 98361 | 26.0% | 19.4%(+6.60)#78 | 14.8%(+11.2)#3,259 |
| 79. | 98403 | 25.9% | 19.4%(+6.50)#79 | 14.8%(+11.1)#3,272 |
| 80. | 98396 | 25.8% | 19.4%(+6.40)#80 | 14.8%(+11.0)#3,295 |
| 81. | 99329 | 25.5% | 19.4%(+6.10)#81 | 14.8%(+10.7)#3,358 |
| 82. | 98406 | 25.0% | 19.4%(+5.60)#82 | 14.8%(+10.2)#3,458 |
| 83. | 98323 | 24.9% | 19.4%(+5.50)#83 | 14.8%(+10.1)#3,513 |
| 84. | 98042 | 24.5% | 19.4%(+5.10)#84 | 14.8%(+9.70)#3,589 |
| 85. | 98133 | 24.1% | 19.4%(+4.70)#85 | 14.8%(+9.30)#3,673 |
| 86. | 99352 | 24.0% | 19.4%(+4.60)#86 | 14.8%(+9.20)#3,696 |
| 87. | 98249 | 24.0% | 19.4%(+4.60)#87 | 14.8%(+9.20)#3,709 |
| 88. | 98166 | 23.9% | 19.4%(+4.50)#88 | 14.8%(+9.10)#3,729 |
| 89. | 98385 | 23.9% | 19.4%(+4.50)#89 | 14.8%(+9.10)#3,746 |
| 90. | 98407 | 23.8% | 19.4%(+4.40)#90 | 14.8%(+9.00)#3,764 |
| 91. | 98383 | 23.4% | 19.4%(+4.00)#91 | 14.8%(+8.60)#3,852 |
| 92. | 98092 | 23.1% | 19.4%(+3.70)#92 | 14.8%(+8.30)#3,914 |
| 93. | 98106 | 23.0% | 19.4%(+3.60)#93 | 14.8%(+8.20)#3,941 |
| 94. | 99223 | 22.9% | 19.4%(+3.50)#94 | 14.8%(+8.10)#3,964 |
| 95. | 98685 | 22.4% | 19.4%(+3.00)#95 | 14.8%(+7.60)#4,107 |
| 96. | 98178 | 22.4% | 19.4%(+3.00)#96 | 14.8%(+7.60)#4,110 |
| 97. | 98671 | 22.4% | 19.4%(+3.00)#97 | 14.8%(+7.60)#4,114 |
| 98. | 98651 | 22.3% | 19.4%(+2.90)#98 | 14.8%(+7.50)#4,145 |
| 99. | 98391 | 22.2% | 19.4%(+2.80)#99 | 14.8%(+7.40)#4,150 |
| 100. | 98642 | 22.1% | 19.4%(+2.70)#100 | 14.8%(+7.30)#4,182 |
Common Questions
What are the Top 10 Zip Codes with the Highest Percentage of Families with Income Above $200,000 in Washington?
Top 10 Zip Codes with the Highest Percentage of Families with Income Above $200,000 in Washington are:
What zip code has the Highest Percentage of Families with Income Above $200,000 in Washington?
98330 has the Highest Percentage of Families with Income Above $200,000 in Washington with 100.0%.
What is the Percentage of Families with Income Above $200,000 in the State of Washington?
Percentage of Families with Income Above $200,000 in Washington is 19.4%.
What is the Percentage of Families with Income Above $200,000 in the United States?
Percentage of Families with Income Above $200,000 in the United States is 14.8%.