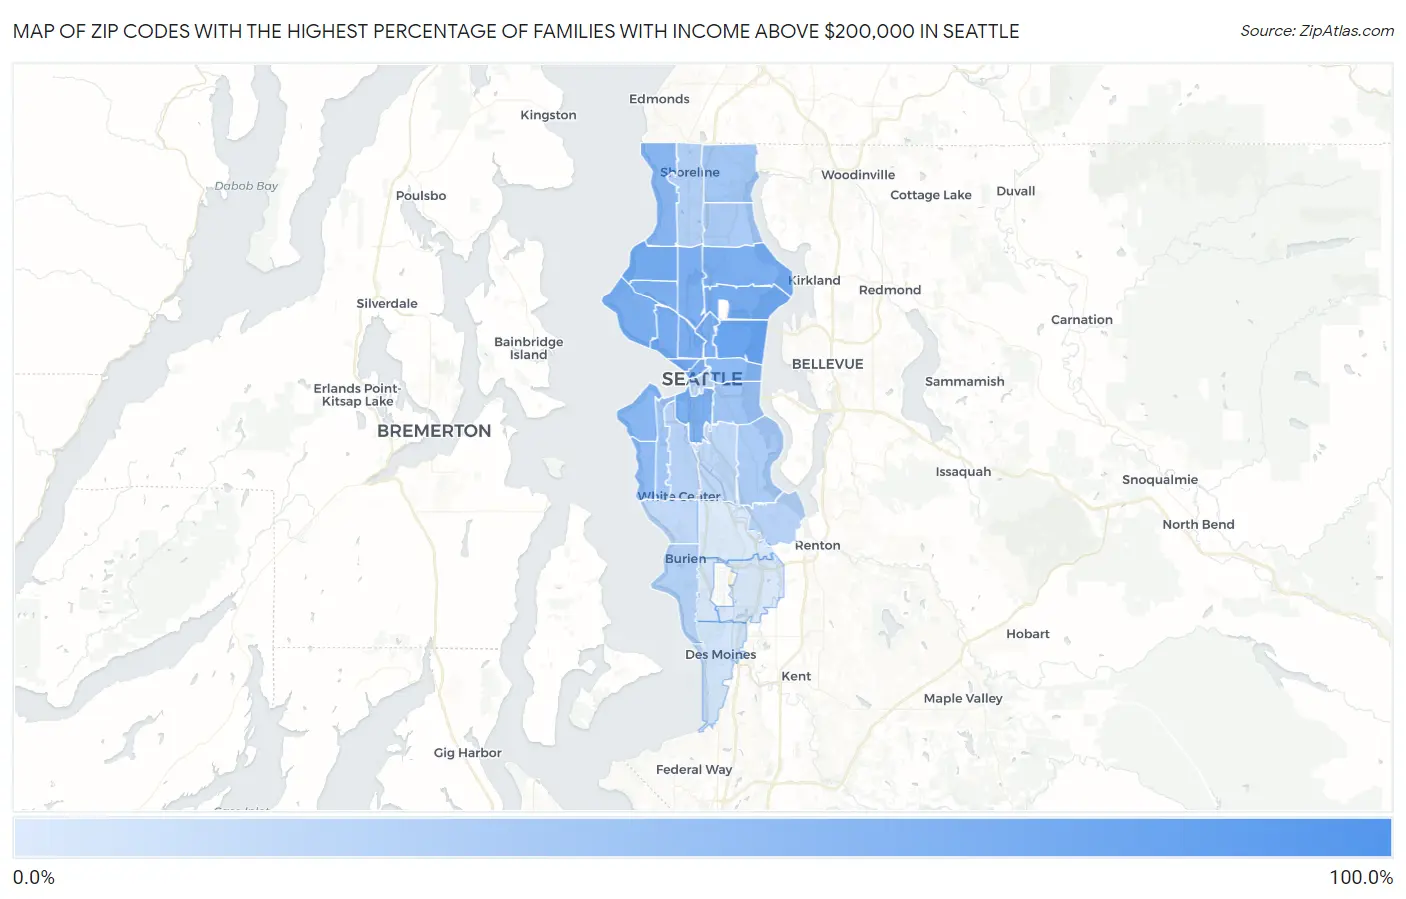
Zip Codes with the Highest Percentage of Families with Income Above $200,000 in Seattle, WA
RELATED REPORTS & OPTIONS
Family Income | $200k+
Seattle
Compare Zip Codes
Map of Zip Codes with the Highest Percentage of Families with Income Above $200,000 in Seattle
7.9%
80.9%
Zip Codes with the Highest Percentage of Families with Income Above $200,000 in Seattle, WA
| Zip Code | Families with Income > $200k | vs State | vs National | |
| 1. | 98164 | 80.9% | 19.4%(+61.5)#2 | 14.8%(+66.1)#67 |
| 2. | 98112 | 59.7% | 19.4%(+40.3)#7 | 14.8%(+44.9)#305 |
| 3. | 98117 | 54.7% | 19.4%(+35.3)#9 | 14.8%(+39.9)#465 |
| 4. | 98105 | 53.6% | 19.4%(+34.2)#11 | 14.8%(+38.8)#511 |
| 5. | 98121 | 53.2% | 19.4%(+33.8)#12 | 14.8%(+38.4)#524 |
| 6. | 98119 | 52.4% | 19.4%(+33.0)#14 | 14.8%(+37.6)#556 |
| 7. | 98109 | 52.1% | 19.4%(+32.7)#15 | 14.8%(+37.3)#569 |
| 8. | 98115 | 50.9% | 19.4%(+31.5)#18 | 14.8%(+36.1)#624 |
| 9. | 98199 | 50.8% | 19.4%(+31.4)#19 | 14.8%(+36.0)#630 |
| 10. | 98134 | 50.0% | 19.4%(+30.6)#20 | 14.8%(+35.2)#662 |
| 11. | 98101 | 49.8% | 19.4%(+30.4)#21 | 14.8%(+35.0)#679 |
| 12. | 98103 | 49.3% | 19.4%(+29.9)#23 | 14.8%(+34.5)#701 |
| 13. | 98102 | 49.3% | 19.4%(+29.9)#24 | 14.8%(+34.5)#703 |
| 14. | 98107 | 49.2% | 19.4%(+29.8)#25 | 14.8%(+34.4)#707 |
| 15. | 98177 | 43.6% | 19.4%(+24.2)#33 | 14.8%(+28.8)#1,018 |
| 16. | 98116 | 43.4% | 19.4%(+24.0)#34 | 14.8%(+28.6)#1,029 |
| 17. | 98122 | 41.5% | 19.4%(+22.1)#39 | 14.8%(+26.7)#1,182 |
| 18. | 98136 | 40.6% | 19.4%(+21.2)#40 | 14.8%(+25.8)#1,267 |
| 19. | 98144 | 32.5% | 19.4%(+13.1)#59 | 14.8%(+17.7)#2,164 |
| 20. | 98126 | 31.8% | 19.4%(+12.4)#61 | 14.8%(+17.0)#2,257 |
| 21. | 98155 | 31.6% | 19.4%(+12.2)#62 | 14.8%(+16.8)#2,280 |
| 22. | 98125 | 28.5% | 19.4%(+9.10)#68 | 14.8%(+13.7)#2,776 |
| 23. | 98118 | 27.5% | 19.4%(+8.10)#71 | 14.8%(+12.7)#2,943 |
| 24. | 98133 | 24.1% | 19.4%(+4.70)#85 | 14.8%(+9.30)#3,673 |
| 25. | 98166 | 23.9% | 19.4%(+4.50)#88 | 14.8%(+9.10)#3,729 |
| 26. | 98106 | 23.0% | 19.4%(+3.60)#93 | 14.8%(+8.20)#3,941 |
| 27. | 98178 | 22.4% | 19.4%(+3.00)#96 | 14.8%(+7.60)#4,110 |
| 28. | 98104 | 19.7% | 19.4%(+0.300)#114 | 14.8%(+4.90)#4,910 |
| 29. | 98108 | 19.2% | 19.4%(-0.200)#118 | 14.8%(+4.40)#5,083 |
| 30. | 98146 | 18.9% | 19.4%(-0.500)#121 | 14.8%(+4.10)#5,186 |
| 31. | 98198 | 11.8% | 19.4%(-7.60)#230 | 14.8%(-3.00)#9,113 |
| 32. | 98188 | 9.6% | 19.4%(-9.80)#290 | 14.8%(-5.20)#11,210 |
| 33. | 98148 | 9.3% | 19.4%(-10.1)#299 | 14.8%(-5.50)#11,554 |
| 34. | 98168 | 7.9% | 19.4%(-11.5)#328 | 14.8%(-6.90)#13,293 |
1
Common Questions
What are the Top 10 Zip Codes with the Highest Percentage of Families with Income Above $200,000 in Seattle, WA?
Top 10 Zip Codes with the Highest Percentage of Families with Income Above $200,000 in Seattle, WA are:
What zip code has the Highest Percentage of Families with Income Above $200,000 in Seattle, WA?
98164 has the Highest Percentage of Families with Income Above $200,000 in Seattle, WA with 80.9%.
What is the Percentage of Families with Income Above $200,000 in Seattle, WA?
Percentage of Families with Income Above $200,000 in Seattle is 41.8%.
What is the Percentage of Families with Income Above $200,000 in Washington?
Percentage of Families with Income Above $200,000 in Washington is 19.4%.
What is the Percentage of Families with Income Above $200,000 in the United States?
Percentage of Families with Income Above $200,000 in the United States is 14.8%.