Haworth borough, NJ Map & Demographics
Haworth borough Overview
$80,677
PER CAPITA INCOME
$227,661
AVG FAMILY INCOME
$215,972
AVG HOUSEHOLD INCOME
47.4%
WAGE / INCOME GAP [ % ]
52.6¢/ $1
WAGE / INCOME GAP [ $ ]
0.38
INEQUALITY / GINI INDEX
3,342
TOTAL POPULATION
1,784
MALE POPULATION
1,558
FEMALE POPULATION
114.51
MALES / 100 FEMALES
87.33
FEMALES / 100 MALES
46.5
MEDIAN AGE
3.3
AVG FAMILY SIZE
3.1
AVG HOUSEHOLD SIZE
1,646
LABOR FORCE [ PEOPLE ]
65.9%
PERCENT IN LABOR FORCE
3.4%
UNEMPLOYMENT RATE
Income in Haworth borough
Income Overview in Haworth borough
Per Capita Income in Haworth borough is $80,677, while median incomes of families and households are $227,661 and $215,972 respectively.
| Characteristic | Number | Measure |
| Per Capita Income | 3,342 | $80,677 |
| Median Family Income | 963 | $227,661 |
| Mean Family Income | 963 | $264,261 |
| Median Household Income | 1,069 | $215,972 |
| Mean Household Income | 1,069 | $252,024 |
| Income Deficit | 963 | $0 |
| Wage / Income Gap (%) | 3,342 | 47.35% |
| Wage / Income Gap ($) | 3,342 | 52.65¢ per $1 |
| Gini / Inequality Index | 3,342 | 0.38 |
Earnings by Sex in Haworth borough
Average Earnings in Haworth borough are $82,589, $113,015 for men and $59,500 for women, a difference of 47.3%.
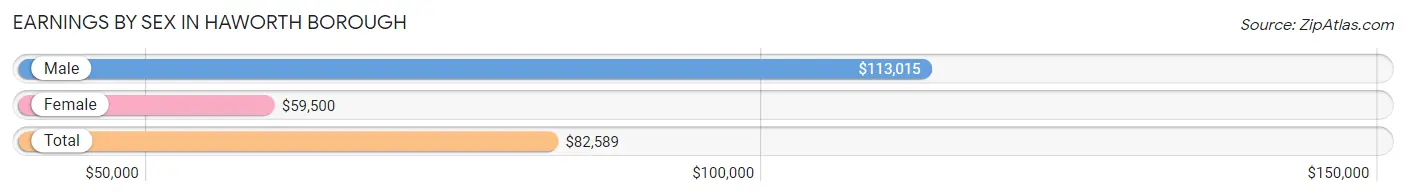
| Sex | Number | Average Earnings |
| Male | 995 (57.6%) | $113,015 |
| Female | 732 (42.4%) | $59,500 |
| Total | 1,727 (100.0%) | $82,589 |
Earnings by Sex by Income Bracket in Haworth borough
The most common earnings brackets in Haworth borough are $100,000+ for men (555 | 55.8%) and $100,000+ for women (209 | 28.5%).
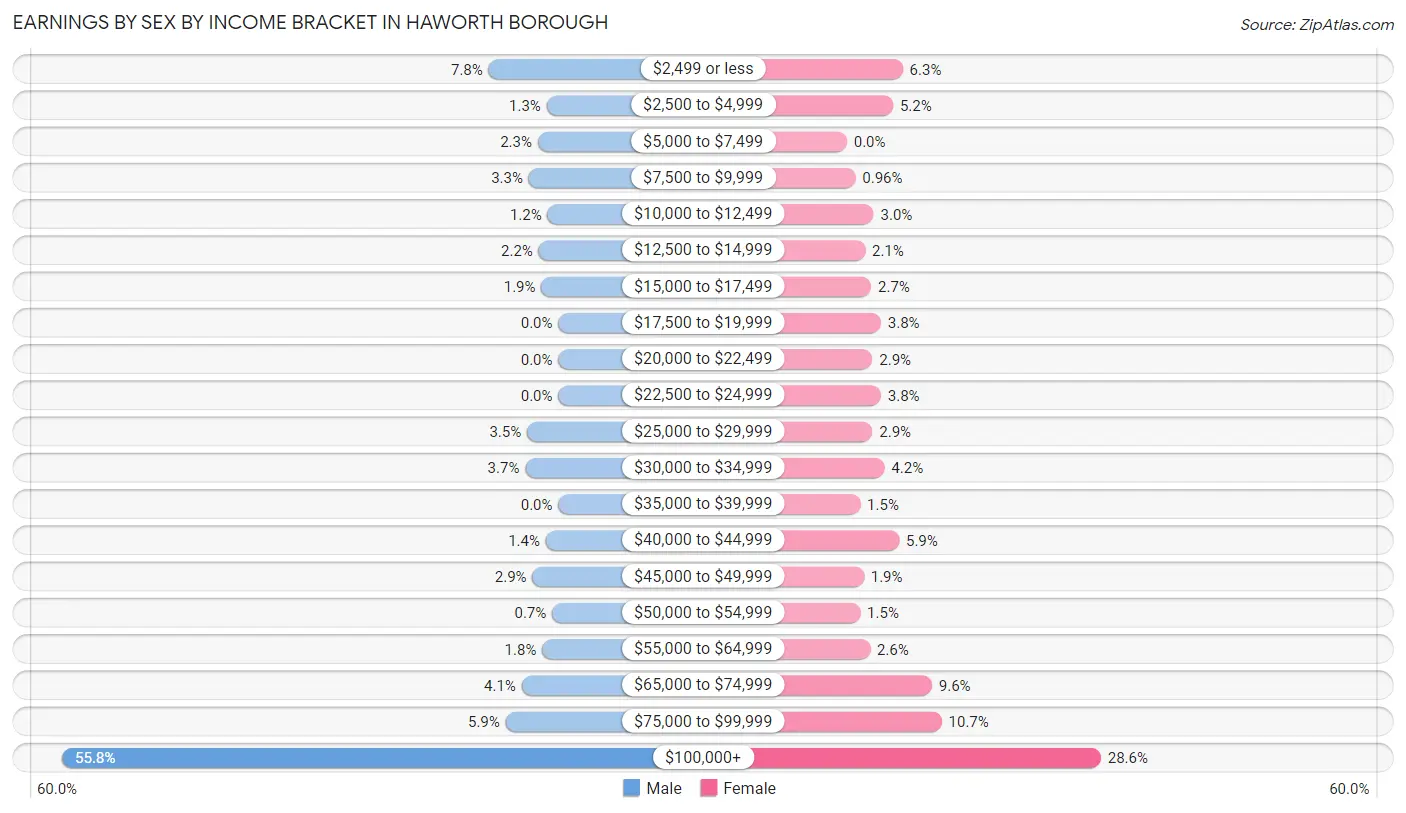
| Income | Male | Female |
| $2,499 or less | 78 (7.8%) | 46 (6.3%) |
| $2,500 to $4,999 | 13 (1.3%) | 38 (5.2%) |
| $5,000 to $7,499 | 23 (2.3%) | 0 (0.0%) |
| $7,500 to $9,999 | 33 (3.3%) | 7 (1.0%) |
| $10,000 to $12,499 | 12 (1.2%) | 22 (3.0%) |
| $12,500 to $14,999 | 22 (2.2%) | 15 (2.1%) |
| $15,000 to $17,499 | 19 (1.9%) | 20 (2.7%) |
| $17,500 to $19,999 | 0 (0.0%) | 28 (3.8%) |
| $20,000 to $22,499 | 0 (0.0%) | 21 (2.9%) |
| $22,500 to $24,999 | 0 (0.0%) | 28 (3.8%) |
| $25,000 to $29,999 | 35 (3.5%) | 21 (2.9%) |
| $30,000 to $34,999 | 37 (3.7%) | 31 (4.2%) |
| $35,000 to $39,999 | 0 (0.0%) | 11 (1.5%) |
| $40,000 to $44,999 | 14 (1.4%) | 43 (5.9%) |
| $45,000 to $49,999 | 29 (2.9%) | 14 (1.9%) |
| $50,000 to $54,999 | 7 (0.7%) | 11 (1.5%) |
| $55,000 to $64,999 | 18 (1.8%) | 19 (2.6%) |
| $65,000 to $74,999 | 41 (4.1%) | 70 (9.6%) |
| $75,000 to $99,999 | 59 (5.9%) | 78 (10.7%) |
| $100,000+ | 555 (55.8%) | 209 (28.5%) |
| Total | 995 (100.0%) | 732 (100.0%) |
Earnings by Sex by Educational Attainment in Haworth borough
Average earnings in Haworth borough are $146,607 for men and $70,882 for women, a difference of 51.6%. Men with an educational attainment of graduate degree enjoy the highest average annual earnings of $211,167, while those with high school diploma education earn the least with $28,889. Women with an educational attainment of graduate degree earn the most with the average annual earnings of $87,250, while those with high school diploma education have the smallest earnings of $24,000.
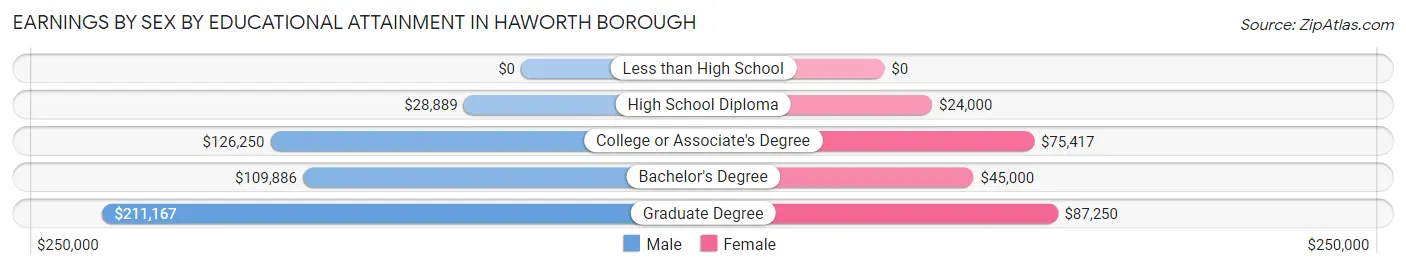
| Educational Attainment | Male Income | Female Income |
| Less than High School | - | - |
| High School Diploma | $28,889 | $24,000 |
| College or Associate's Degree | $126,250 | $75,417 |
| Bachelor's Degree | $109,886 | $45,000 |
| Graduate Degree | $211,167 | $87,250 |
| Total | $146,607 | $70,882 |
Family Income in Haworth borough
Family Income Brackets in Haworth borough
According to the Haworth borough family income data, there are 553 families falling into the $200,000+ income range, which is the most common income bracket and makes up 57.4% of all families. Conversely, the $15,000 to $24,999 income bracket is the least frequent group with only 4 families (0.4%) belonging to this category.
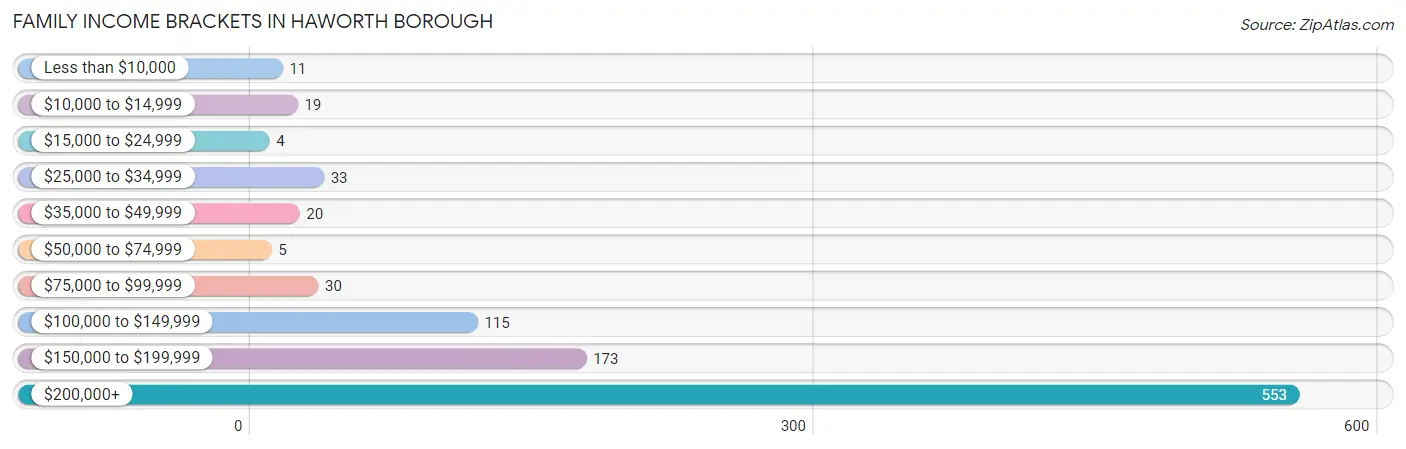
| Income Bracket | # Families | % Families |
| Less than $10,000 | 11 | 1.1% |
| $10,000 to $14,999 | 19 | 2.0% |
| $15,000 to $24,999 | 4 | 0.4% |
| $25,000 to $34,999 | 33 | 3.4% |
| $35,000 to $49,999 | 20 | 2.1% |
| $50,000 to $74,999 | 5 | 0.5% |
| $75,000 to $99,999 | 30 | 3.1% |
| $100,000 to $149,999 | 115 | 11.9% |
| $150,000 to $199,999 | 173 | 18.0% |
| $200,000+ | 553 | 57.4% |
Family Income by Famaliy Size in Haworth borough
3-person families (194 | 20.2%) account for the highest median family income in Haworth borough with $250,001 per family, while 2-person families (375 | 38.9%) have the highest median income of $85,875 per family member.
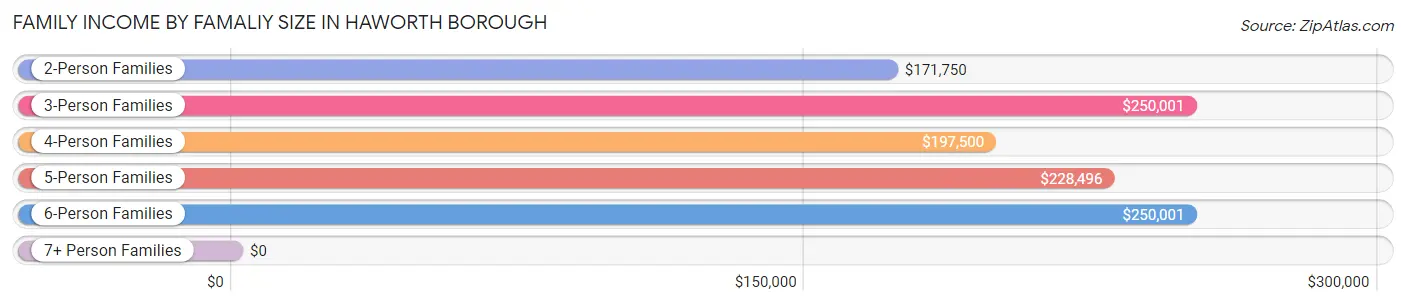
| Income Bracket | # Families | Median Income |
| 2-Person Families | 375 (38.9%) | $171,750 |
| 3-Person Families | 194 (20.2%) | $250,001 |
| 4-Person Families | 184 (19.1%) | $197,500 |
| 5-Person Families | 161 (16.7%) | $228,496 |
| 6-Person Families | 45 (4.7%) | $250,001 |
| 7+ Person Families | 4 (0.4%) | $0 |
| Total | 963 (100.0%) | $227,661 |
Family Income by Number of Earners in Haworth borough
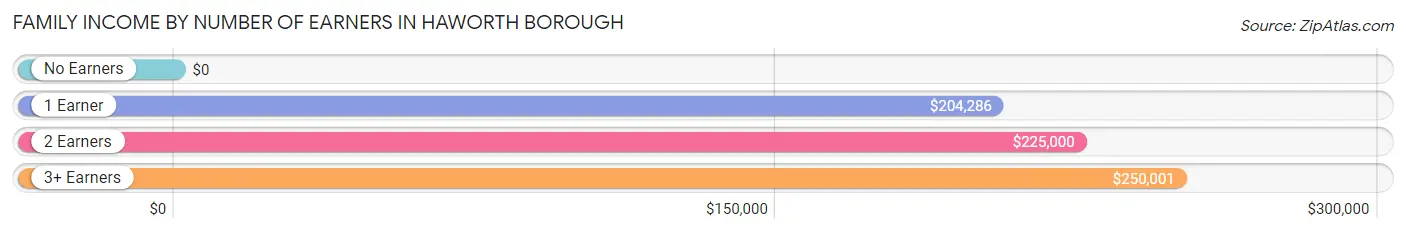
| Number of Earners | # Families | Median Income |
| No Earners | 87 (9.0%) | $0 |
| 1 Earner | 316 (32.8%) | $204,286 |
| 2 Earners | 418 (43.4%) | $225,000 |
| 3+ Earners | 142 (14.7%) | $250,001 |
| Total | 963 (100.0%) | $227,661 |
Household Income in Haworth borough
Household Income Brackets in Haworth borough
With 580 households falling in the category, the $200,000+ income range is the most frequent in Haworth borough, accounting for 54.3% of all households. In contrast, only 4 households (0.4%) fall into the $15,000 to $24,999 income bracket, making it the least populous group.
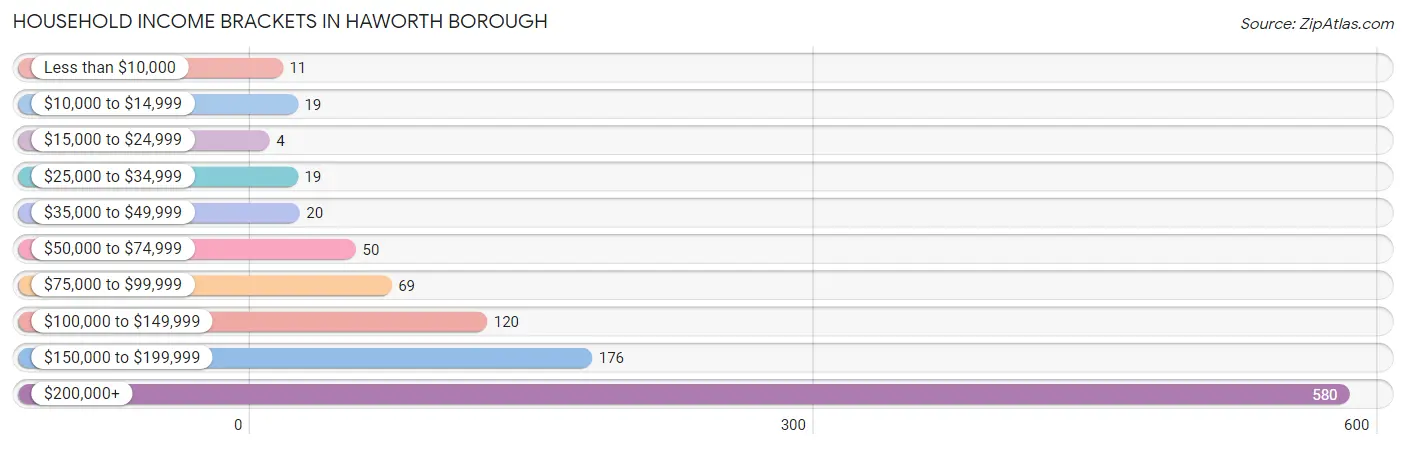
| Income Bracket | # Households | % Households |
| Less than $10,000 | 11 | 1.0% |
| $10,000 to $14,999 | 19 | 1.8% |
| $15,000 to $24,999 | 4 | 0.4% |
| $25,000 to $34,999 | 19 | 1.8% |
| $35,000 to $49,999 | 20 | 1.9% |
| $50,000 to $74,999 | 50 | 4.7% |
| $75,000 to $99,999 | 69 | 6.5% |
| $100,000 to $149,999 | 120 | 11.2% |
| $150,000 to $199,999 | 176 | 16.5% |
| $200,000+ | 580 | 54.3% |
Household Income by Householder Age in Haworth borough
The median household income in Haworth borough is $215,972, with the highest median household income of $229,339 found in the 45 to 64 years age bracket for the primary householder. A total of 605 households (56.6%) fall into this category.
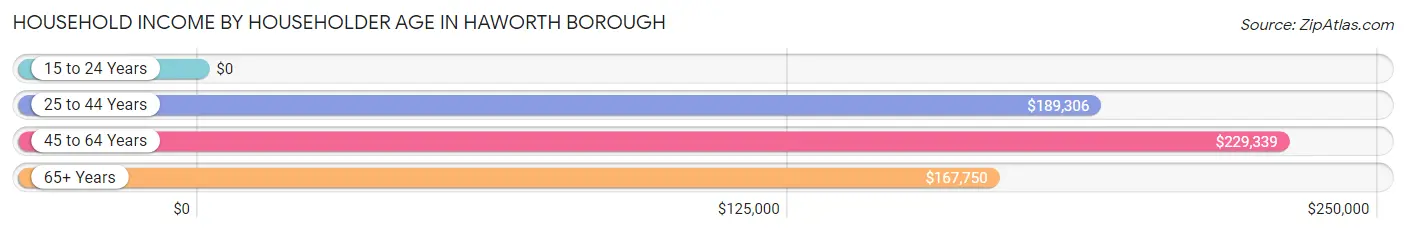
| Income Bracket | # Households | Median Income |
| 15 to 24 Years | 0 (0.0%) | $0 |
| 25 to 44 Years | 151 (14.1%) | $189,306 |
| 45 to 64 Years | 605 (56.6%) | $229,339 |
| 65+ Years | 313 (29.3%) | $167,750 |
| Total | 1,069 (100.0%) | $215,972 |
Poverty in Haworth borough
Income Below Poverty by Sex and Age in Haworth borough
With 3.7% poverty level for males and 5.7% for females among the residents of Haworth borough, 25 to 34 year old males and under 5 year old females are the most vulnerable to poverty, with 25 males (30.9%) and 30 females (50.8%) in their respective age groups living below the poverty level.
| Age Bracket | Male | Female |
| Under 5 Years | 0 (0.0%) | 30 (50.8%) |
| 5 Years | 0 (0.0%) | 0 (0.0%) |
| 6 to 11 Years | 16 (8.5%) | 0 (0.0%) |
| 12 to 14 Years | 0 (0.0%) | 0 (0.0%) |
| 15 Years | 0 (0.0%) | 0 (0.0%) |
| 16 and 17 Years | 0 (0.0%) | 0 (0.0%) |
| 18 to 24 Years | 0 (0.0%) | 0 (0.0%) |
| 25 to 34 Years | 25 (30.9%) | 1 (1.8%) |
| 35 to 44 Years | 0 (0.0%) | 7 (5.3%) |
| 45 to 54 Years | 0 (0.0%) | 17 (5.6%) |
| 55 to 64 Years | 0 (0.0%) | 8 (2.6%) |
| 65 to 74 Years | 0 (0.0%) | 0 (0.0%) |
| 75 Years and over | 25 (22.7%) | 26 (20.2%) |
| Total | 66 (3.7%) | 89 (5.7%) |
Income Above Poverty by Sex and Age in Haworth borough
According to the poverty statistics in Haworth borough, males aged under 5 years and females aged 5 years are the age groups that are most secure financially, with 100.0% of males and 100.0% of females in these age groups living above the poverty line.
| Age Bracket | Male | Female |
| Under 5 Years | 82 (100.0%) | 29 (49.1%) |
| 5 Years | 26 (100.0%) | 30 (100.0%) |
| 6 to 11 Years | 172 (91.5%) | 175 (100.0%) |
| 12 to 14 Years | 127 (100.0%) | 93 (100.0%) |
| 15 Years | 53 (100.0%) | 11 (100.0%) |
| 16 and 17 Years | 109 (100.0%) | 56 (100.0%) |
| 18 to 24 Years | 146 (100.0%) | 48 (100.0%) |
| 25 to 34 Years | 56 (69.1%) | 56 (98.3%) |
| 35 to 44 Years | 141 (100.0%) | 125 (94.7%) |
| 45 to 54 Years | 187 (100.0%) | 287 (94.4%) |
| 55 to 64 Years | 374 (100.0%) | 304 (97.4%) |
| 65 to 74 Years | 160 (100.0%) | 152 (100.0%) |
| 75 Years and over | 85 (77.3%) | 103 (79.8%) |
| Total | 1,718 (96.3%) | 1,469 (94.3%) |
Income Below Poverty Among Married-Couple Families in Haworth borough
The poverty statistics for married-couple families in Haworth borough show that 3.0% or 25 of the total 842 families live below the poverty line. Families with no children have the highest poverty rate of 5.4%, comprising of 25 families. On the other hand, families with 1 or 2 children have the lowest poverty rate of 0.0%, which includes 0 families.
| Children | Above Poverty | Below Poverty |
| No Children | 436 (94.6%) | 25 (5.4%) |
| 1 or 2 Children | 216 (100.0%) | 0 (0.0%) |
| 3 or 4 Children | 165 (100.0%) | 0 (0.0%) |
| 5 or more Children | 0 (0.0%) | 0 (0.0%) |
| Total | 817 (97.0%) | 25 (3.0%) |
Income Below Poverty Among Single-Parent Households in Haworth borough
According to the poverty data in Haworth borough, 64.5% or 20 single-father households and 5.6% or 5 single-mother households are living below the poverty line. Among single-father households, those with 3 or 4 children have the highest poverty rate, with 20 households (100.0%) experiencing poverty. Likewise, among single-mother households, those with no children have the highest poverty rate, with 5 households (7.7%) falling below the poverty line.
| Children | Single Father | Single Mother |
| No Children | 0 (0.0%) | 5 (7.7%) |
| 1 or 2 Children | 0 (0.0%) | 0 (0.0%) |
| 3 or 4 Children | 20 (100.0%) | 0 (0.0%) |
| 5 or more Children | 0 (0.0%) | 0 (0.0%) |
| Total | 20 (64.5%) | 5 (5.6%) |
Income Below Poverty Among Married-Couple vs Single-Parent Households in Haworth borough
The poverty data for Haworth borough shows that 25 of the married-couple family households (3.0%) and 25 of the single-parent households (20.7%) are living below the poverty level. Within the married-couple family households, those with no children have the highest poverty rate, with 25 households (5.4%) falling below the poverty line. Among the single-parent households, those with 3 or 4 children have the highest poverty rate, with 20 household (100.0%) living below poverty.
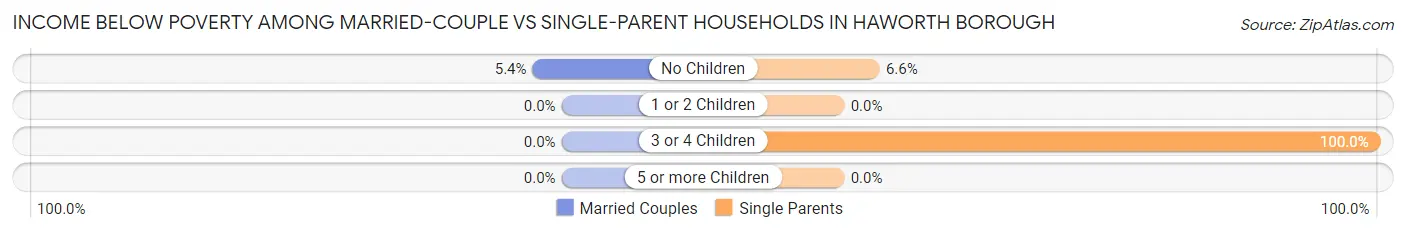
| Children | Married-Couple Families | Single-Parent Households |
| No Children | 25 (5.4%) | 5 (6.6%) |
| 1 or 2 Children | 0 (0.0%) | 0 (0.0%) |
| 3 or 4 Children | 0 (0.0%) | 20 (100.0%) |
| 5 or more Children | 0 (0.0%) | 0 (0.0%) |
| Total | 25 (3.0%) | 25 (20.7%) |
Race in Haworth borough
The most populous races in Haworth borough are White / Caucasian (2,311 | 69.2%), Two or more Races (502 | 15.0%), and Asian (408 | 12.2%).
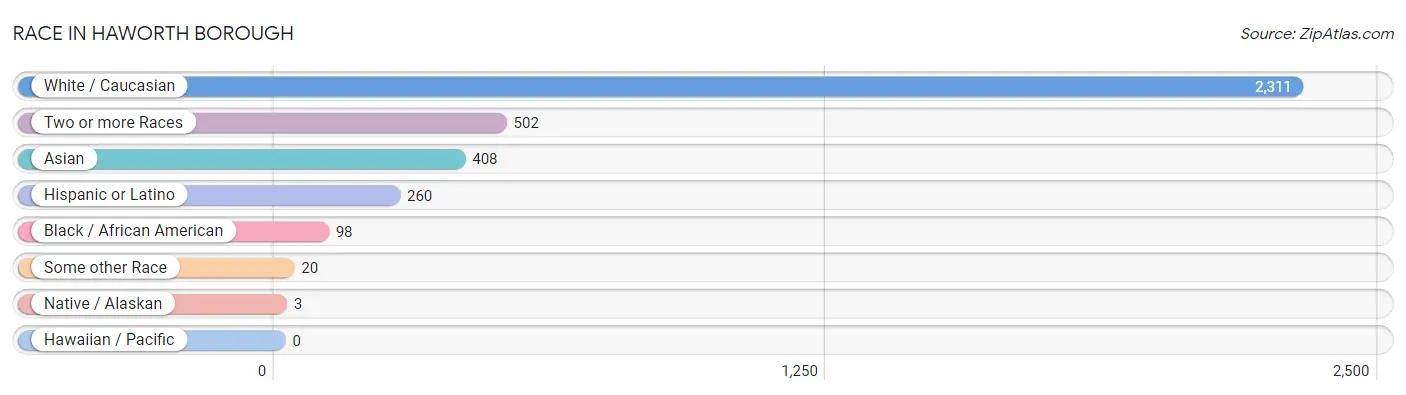
| Race | # Population | % Population |
| Asian | 408 | 12.2% |
| Black / African American | 98 | 2.9% |
| Hawaiian / Pacific | 0 | 0.0% |
| Hispanic or Latino | 260 | 7.8% |
| Native / Alaskan | 3 | 0.1% |
| White / Caucasian | 2,311 | 69.2% |
| Two or more Races | 502 | 15.0% |
| Some other Race | 20 | 0.6% |
| Total | 3,342 | 100.0% |
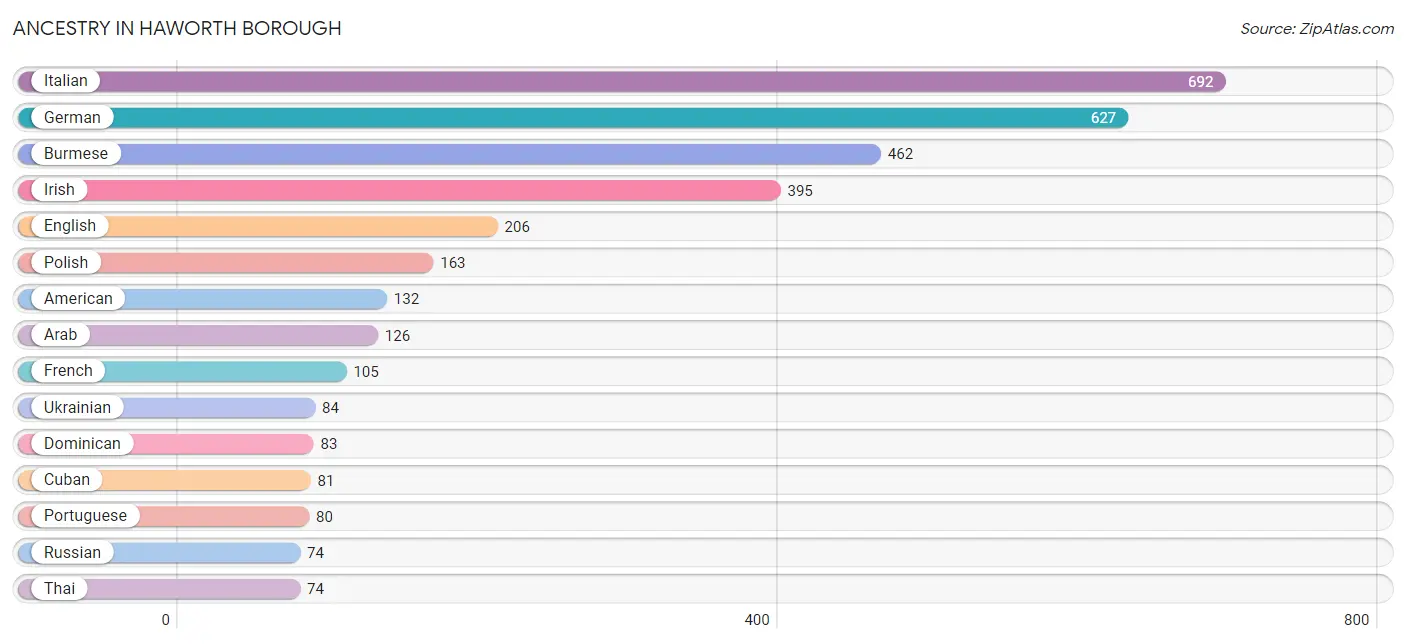
Ancestry in Haworth borough
The most populous ancestries reported in Haworth borough are Italian (692 | 20.7%), German (627 | 18.8%), Burmese (462 | 13.8%), Irish (395 | 11.8%), and English (206 | 6.2%), together accounting for 71.3% of all Haworth borough residents.
| Ancestry | # Population | % Population |
| American | 132 | 4.0% |
| Arab | 126 | 3.8% |
| Armenian | 22 | 0.7% |
| Austrian | 22 | 0.7% |
| Belgian | 6 | 0.2% |
| Belizean | 3 | 0.1% |
| Bhutanese | 45 | 1.3% |
| British | 27 | 0.8% |
| Burmese | 462 | 13.8% |
| Central American | 58 | 1.7% |
| Central American Indian | 3 | 0.1% |
| Colombian | 6 | 0.2% |
| Croatian | 14 | 0.4% |
| Cuban | 81 | 2.4% |
| Cypriot | 5 | 0.2% |
| Czech | 18 | 0.5% |
| Dominican | 83 | 2.5% |
| Dutch | 5 | 0.2% |
| Eastern European | 31 | 0.9% |
| Egyptian | 30 | 0.9% |
| English | 206 | 6.2% |
| European | 64 | 1.9% |
| Finnish | 12 | 0.4% |
| French | 105 | 3.1% |
| French Canadian | 19 | 0.6% |
| German | 627 | 18.8% |
| Greek | 56 | 1.7% |
| Guatemalan | 36 | 1.1% |
| Guyanese | 21 | 0.6% |
| Hungarian | 5 | 0.2% |
| Indian (Asian) | 25 | 0.7% |
| Iranian | 25 | 0.7% |
| Iraqi | 5 | 0.2% |
| Irish | 395 | 11.8% |
| Italian | 692 | 20.7% |
| Korean | 62 | 1.9% |
| Lebanese | 6 | 0.2% |
| Lithuanian | 19 | 0.6% |
| Norwegian | 6 | 0.2% |
| Palestinian | 4 | 0.1% |
| Polish | 163 | 4.9% |
| Portuguese | 80 | 2.4% |
| Puerto Rican | 24 | 0.7% |
| Russian | 74 | 2.2% |
| Salvadoran | 22 | 0.7% |
| Scotch-Irish | 12 | 0.4% |
| Scottish | 42 | 1.3% |
| Slavic | 5 | 0.2% |
| Slovak | 5 | 0.2% |
| South American | 6 | 0.2% |
| Spanish | 8 | 0.2% |
| Subsaharan African | 5 | 0.2% |
| Swedish | 25 | 0.7% |
| Swiss | 64 | 1.9% |
| Thai | 74 | 2.2% |
| Turkish | 6 | 0.2% |
| Ukrainian | 84 | 2.5% |
| Welsh | 43 | 1.3% |
| Zimbabwean | 5 | 0.2% | View All 59 Rows |
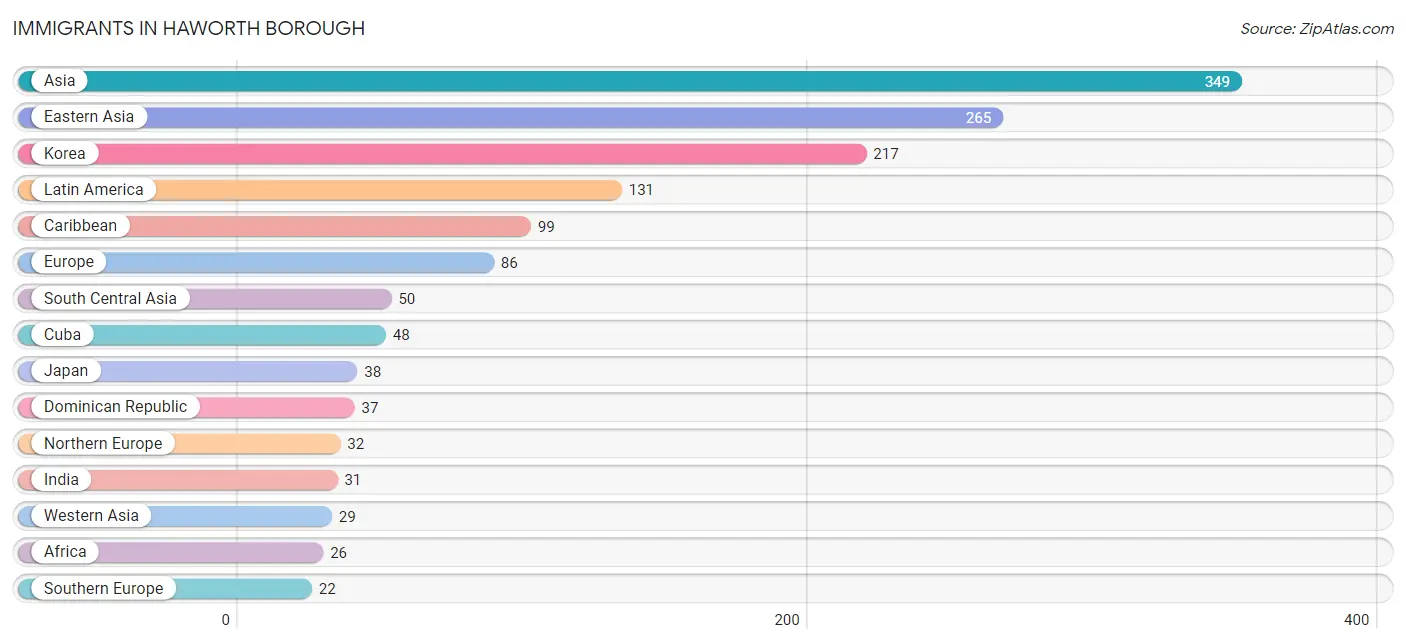
Immigrants in Haworth borough
The most numerous immigrant groups reported in Haworth borough came from Asia (349 | 10.4%), Eastern Asia (265 | 7.9%), Korea (217 | 6.5%), Latin America (131 | 3.9%), and Caribbean (99 | 3.0%), together accounting for 31.7% of all Haworth borough residents.
| Immigration Origin | # Population | % Population |
| Africa | 26 | 0.8% |
| Asia | 349 | 10.4% |
| Belize | 3 | 0.1% |
| Canada | 6 | 0.2% |
| Caribbean | 99 | 3.0% |
| Central America | 12 | 0.4% |
| China | 10 | 0.3% |
| Colombia | 6 | 0.2% |
| Cuba | 48 | 1.4% |
| Dominican Republic | 37 | 1.1% |
| Eastern Africa | 5 | 0.2% |
| Eastern Asia | 265 | 7.9% |
| Eastern Europe | 10 | 0.3% |
| Egypt | 21 | 0.6% |
| El Salvador | 9 | 0.3% |
| England | 5 | 0.2% |
| Europe | 86 | 2.6% |
| France | 11 | 0.3% |
| Germany | 11 | 0.3% |
| Greece | 6 | 0.2% |
| Guyana | 14 | 0.4% |
| Hong Kong | 5 | 0.2% |
| India | 31 | 0.9% |
| Iran | 19 | 0.6% |
| Ireland | 15 | 0.4% |
| Israel | 4 | 0.1% |
| Italy | 16 | 0.5% |
| Japan | 38 | 1.1% |
| Korea | 217 | 6.5% |
| Latin America | 131 | 3.9% |
| Northern Africa | 21 | 0.6% |
| Northern Europe | 32 | 1.0% |
| Poland | 5 | 0.2% |
| South America | 20 | 0.6% |
| South Central Asia | 50 | 1.5% |
| Southern Europe | 22 | 0.7% |
| Syria | 13 | 0.4% |
| Trinidad and Tobago | 14 | 0.4% |
| Turkey | 12 | 0.4% |
| Ukraine | 5 | 0.2% |
| Western Asia | 29 | 0.9% |
| Western Europe | 22 | 0.7% |
| Zimbabwe | 5 | 0.2% | View All 43 Rows |
Sex and Age in Haworth borough
Sex and Age in Haworth borough
The most populous age groups in Haworth borough are 55 to 59 Years (243 | 13.6%) for men and 10 to 14 Years (201 | 12.9%) for women.
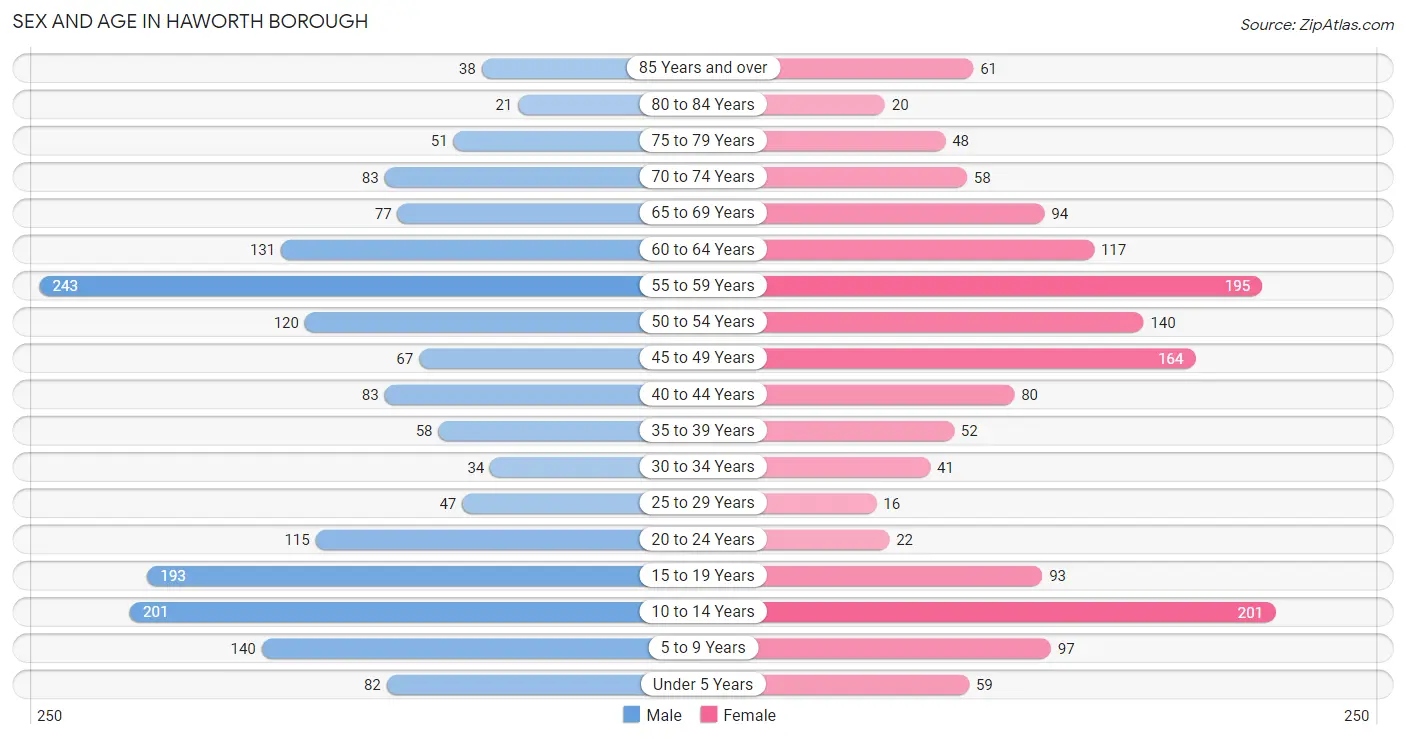
| Age Bracket | Male | Female |
| Under 5 Years | 82 (4.6%) | 59 (3.8%) |
| 5 to 9 Years | 140 (7.9%) | 97 (6.2%) |
| 10 to 14 Years | 201 (11.3%) | 201 (12.9%) |
| 15 to 19 Years | 193 (10.8%) | 93 (6.0%) |
| 20 to 24 Years | 115 (6.5%) | 22 (1.4%) |
| 25 to 29 Years | 47 (2.6%) | 16 (1.0%) |
| 30 to 34 Years | 34 (1.9%) | 41 (2.6%) |
| 35 to 39 Years | 58 (3.3%) | 52 (3.3%) |
| 40 to 44 Years | 83 (4.6%) | 80 (5.1%) |
| 45 to 49 Years | 67 (3.8%) | 164 (10.5%) |
| 50 to 54 Years | 120 (6.7%) | 140 (9.0%) |
| 55 to 59 Years | 243 (13.6%) | 195 (12.5%) |
| 60 to 64 Years | 131 (7.3%) | 117 (7.5%) |
| 65 to 69 Years | 77 (4.3%) | 94 (6.0%) |
| 70 to 74 Years | 83 (4.6%) | 58 (3.7%) |
| 75 to 79 Years | 51 (2.9%) | 48 (3.1%) |
| 80 to 84 Years | 21 (1.2%) | 20 (1.3%) |
| 85 Years and over | 38 (2.1%) | 61 (3.9%) |
| Total | 1,784 (100.0%) | 1,558 (100.0%) |
Families and Households in Haworth borough
Median Family Size in Haworth borough
The median family size in Haworth borough is 3.31 persons per family, with single male/father families (31 | 3.2%) accounting for the largest median family size of 3.58 persons per family. On the other hand, single female/mother families (90 | 9.3%) represent the smallest median family size with 2.49 persons per family.
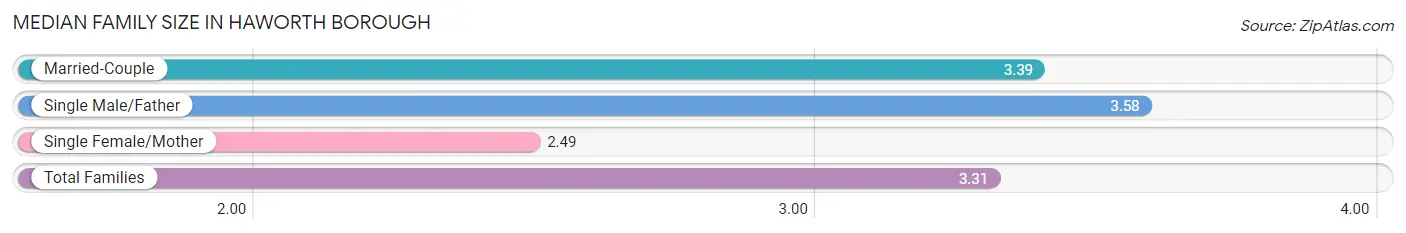
| Family Type | # Families | Family Size |
| Married-Couple | 842 (87.4%) | 3.39 |
| Single Male/Father | 31 (3.2%) | 3.58 |
| Single Female/Mother | 90 (9.3%) | 2.49 |
| Total Families | 963 (100.0%) | 3.31 |
Median Household Size in Haworth borough
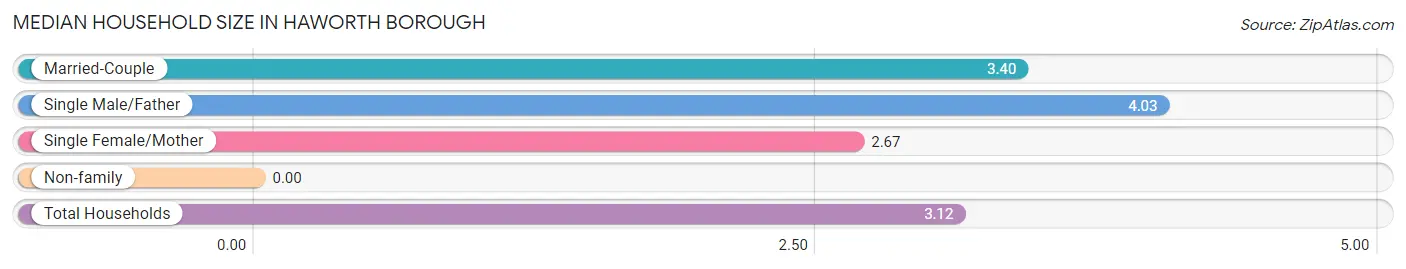
| Household Type | # Households | Household Size |
| Married-Couple | 842 (78.8%) | 3.40 |
| Single Male/Father | 31 (2.9%) | 4.03 |
| Single Female/Mother | 90 (8.4%) | 2.67 |
| Non-family | 106 (9.9%) | - |
| Total Households | 1,069 (100.0%) | 3.12 |
Household Size by Marriage Status in Haworth borough
Out of a total of 1,069 households in Haworth borough, 963 (90.1%) are family households, while 106 (9.9%) are nonfamily households. The most numerous type of family households are 2-person households, comprising 375, and the most common type of nonfamily households are 1-person households, comprising 106.
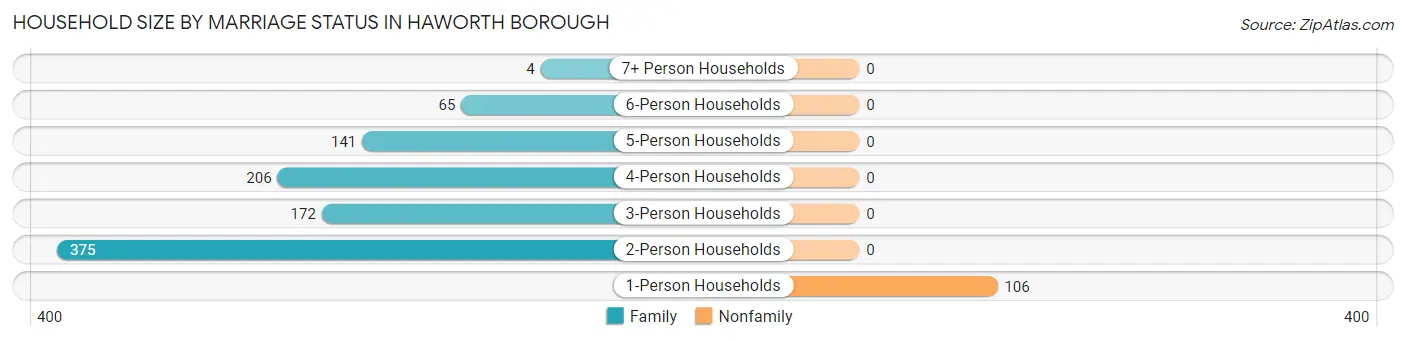
| Household Size | Family Households | Nonfamily Households |
| 1-Person Households | - | 106 (9.9%) |
| 2-Person Households | 375 (35.1%) | 0 (0.0%) |
| 3-Person Households | 172 (16.1%) | 0 (0.0%) |
| 4-Person Households | 206 (19.3%) | 0 (0.0%) |
| 5-Person Households | 141 (13.2%) | 0 (0.0%) |
| 6-Person Households | 65 (6.1%) | 0 (0.0%) |
| 7+ Person Households | 4 (0.4%) | 0 (0.0%) |
| Total | 963 (90.1%) | 106 (9.9%) |
Female Fertility in Haworth borough
Fertility by Age in Haworth borough
Average fertility rate in Haworth borough is 26.0 births per 1,000 women. Women in the age bracket of 20 to 34 years have the highest fertility rate with 127.0 births per 1,000 women. Women in the age bracket of 20 to 34 years acount for 76.9% of all women with births.
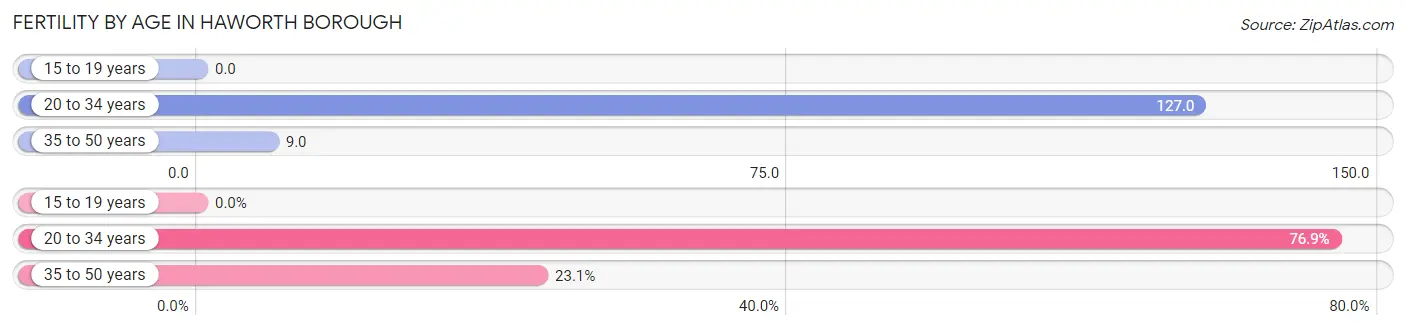
| Age Bracket | Women with Births | Births / 1,000 Women |
| 15 to 19 years | 0 (0.0%) | 0.0 |
| 20 to 34 years | 10 (76.9%) | 127.0 |
| 35 to 50 years | 3 (23.1%) | 9.0 |
| Total | 13 (100.0%) | 26.0 |
Fertility by Age by Marriage Status in Haworth borough
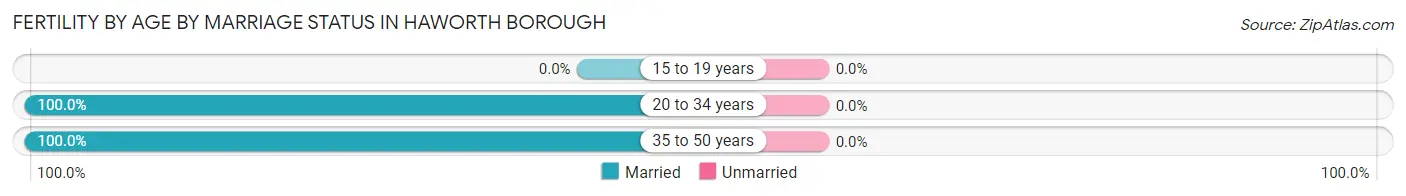
| Age Bracket | Married | Unmarried |
| 15 to 19 years | 0 (0.0%) | 0 (0.0%) |
| 20 to 34 years | 10 (100.0%) | 0 (0.0%) |
| 35 to 50 years | 3 (100.0%) | 0 (0.0%) |
| Total | 13 (100.0%) | 0 (0.0%) |
Fertility by Education in Haworth borough
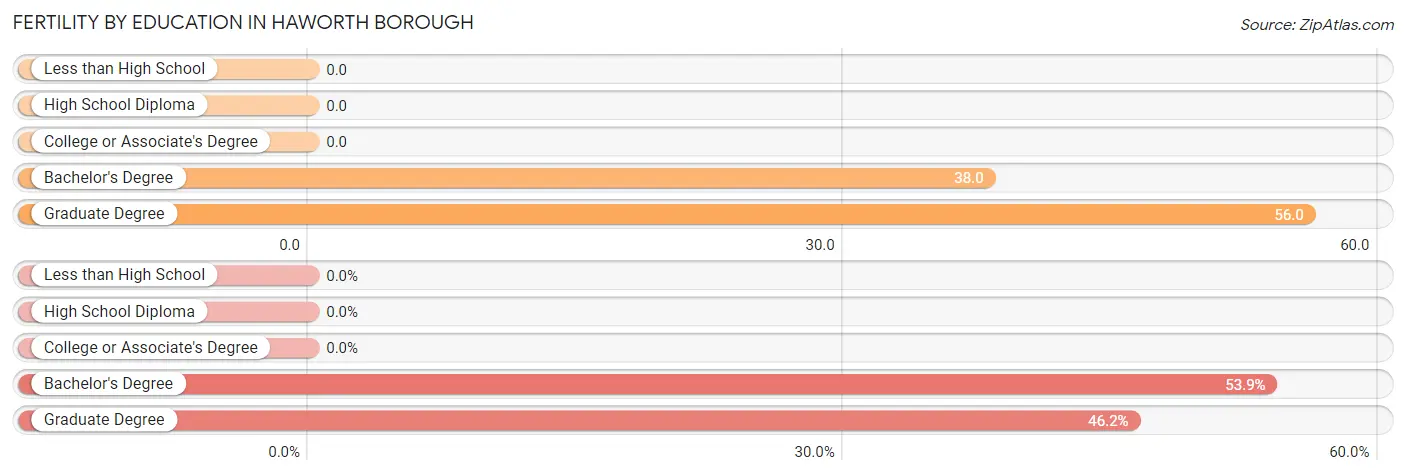
| Educational Attainment | Women with Births | Births / 1,000 Women |
| Less than High School | 0 (0.0%) | 0.0 |
| High School Diploma | 0 (0.0%) | 0.0 |
| College or Associate's Degree | 0 (0.0%) | 0.0 |
| Bachelor's Degree | 7 (53.8%) | 38.0 |
| Graduate Degree | 6 (46.2%) | 56.0 |
| Total | 13 (100.0%) | 26.0 |
Fertility by Education by Marriage Status in Haworth borough
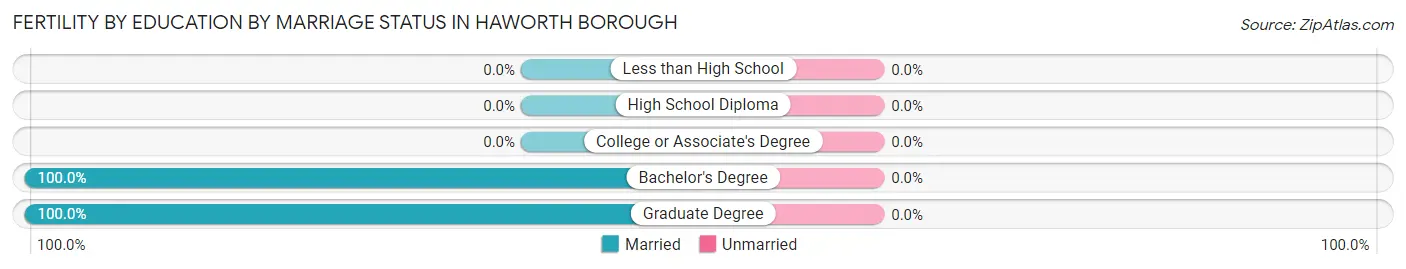
| Educational Attainment | Married | Unmarried |
| Less than High School | 0 (0.0%) | 0 (0.0%) |
| High School Diploma | 0 (0.0%) | 0 (0.0%) |
| College or Associate's Degree | 0 (0.0%) | 0 (0.0%) |
| Bachelor's Degree | 7 (100.0%) | 0 (0.0%) |
| Graduate Degree | 6 (100.0%) | 0 (0.0%) |
| Total | 13 (100.0%) | 0 (0.0%) |
Employment Characteristics in Haworth borough
Employment by Class of Employer in Haworth borough
Among the 1,579 employed individuals in Haworth borough, private company employees (874 | 55.3%), self-employed (incorporated) (201 | 12.7%), and self-employed (not incorporated) (176 | 11.2%) make up the most common classes of employment.
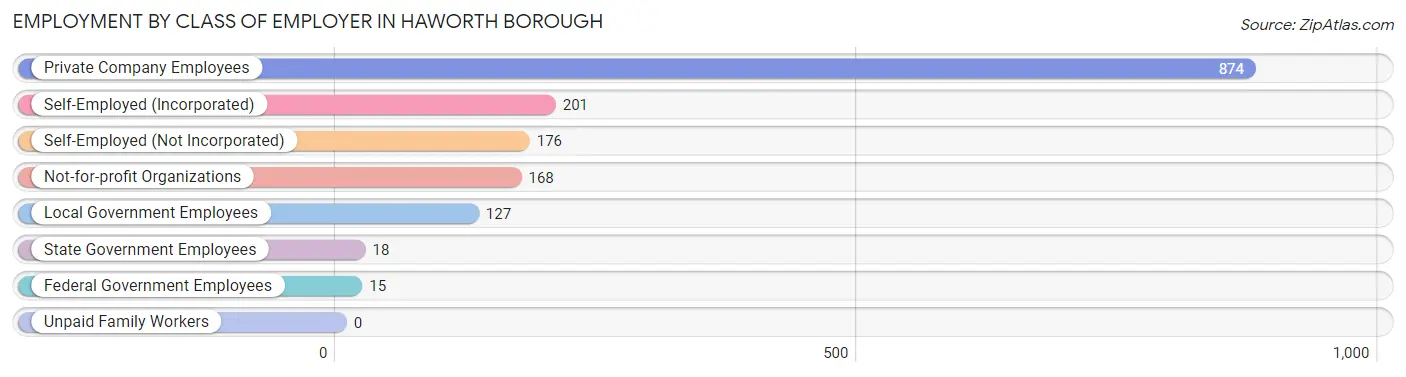
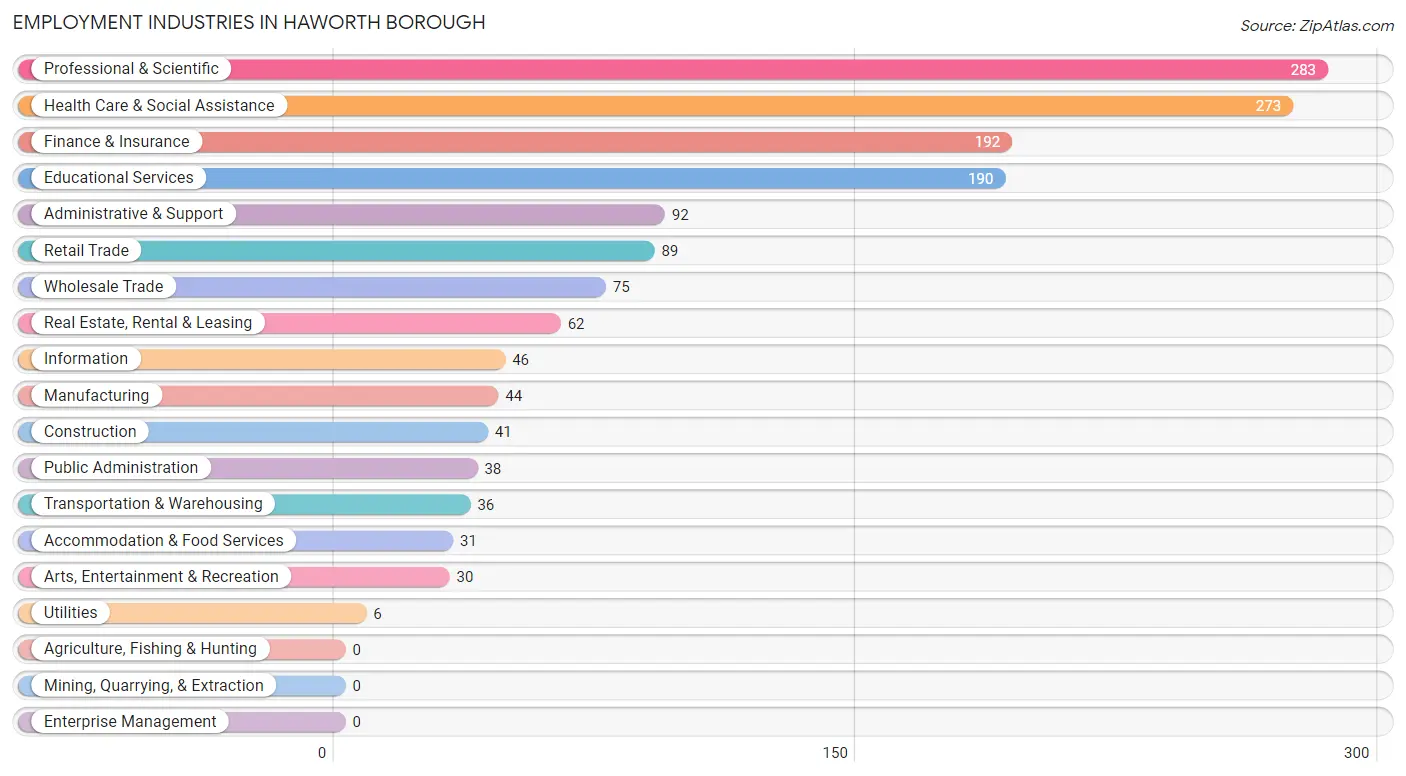
| Employer Class | # Employees | % Employees |
| Private Company Employees | 874 | 55.3% |
| Self-Employed (Incorporated) | 201 | 12.7% |
| Self-Employed (Not Incorporated) | 176 | 11.2% |
| Not-for-profit Organizations | 168 | 10.6% |
| Local Government Employees | 127 | 8.0% |
| State Government Employees | 18 | 1.1% |
| Federal Government Employees | 15 | 0.9% |
| Unpaid Family Workers | 0 | 0.0% |
| Total | 1,579 | 100.0% |
Employment Status by Age in Haworth borough
According to the labor force statistics for Haworth borough, out of the total population over 16 years of age (2,498), 65.9% or 1,646 individuals are in the labor force, with 3.4% or 56 of them unemployed. The age group with the highest labor force participation rate is 25 to 29 years, with 98.4% or 62 individuals in the labor force. Within the labor force, the 25 to 29 years age range has the highest percentage of unemployed individuals, with 22.6% or 14 of them being unemployed.
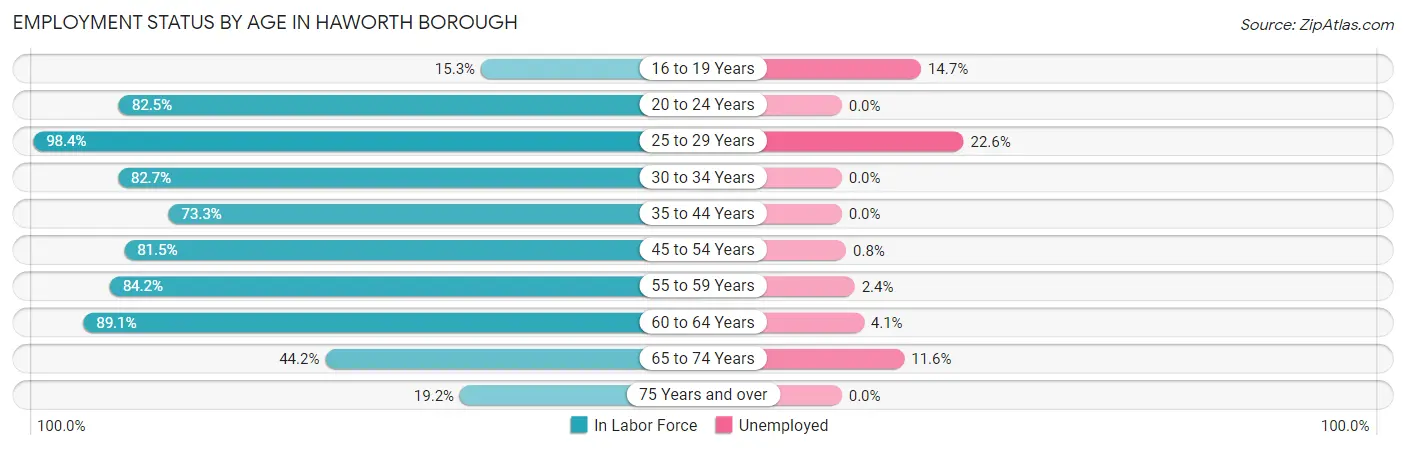
| Age Bracket | In Labor Force | Unemployed |
| 16 to 19 Years | 34 (15.3%) | 5 (14.7%) |
| 20 to 24 Years | 113 (82.5%) | 0 (0.0%) |
| 25 to 29 Years | 62 (98.4%) | 14 (22.6%) |
| 30 to 34 Years | 62 (82.7%) | 0 (0.0%) |
| 35 to 44 Years | 200 (73.3%) | 0 (0.0%) |
| 45 to 54 Years | 400 (81.5%) | 3 (0.8%) |
| 55 to 59 Years | 369 (84.2%) | 9 (2.4%) |
| 60 to 64 Years | 221 (89.1%) | 9 (4.1%) |
| 65 to 74 Years | 138 (44.2%) | 16 (11.6%) |
| 75 Years and over | 46 (19.2%) | 0 (0.0%) |
| Total | 1,646 (65.9%) | 56 (3.4%) |
Employment Status by Educational Attainment in Haworth borough
According to labor force statistics for Haworth borough, 82.7% of individuals (1,313) out of the total population between 25 and 64 years of age (1,588) are in the labor force, with 2.7% or 35 of them being unemployed. The group with the highest labor force participation rate are those with the educational attainment of bachelor's degree or higher, with 86.7% or 1,006 individuals in the labor force. Within the labor force, individuals with high school diploma education have the highest percentage of unemployment, with 8.1% or 8 of them being unemployed.
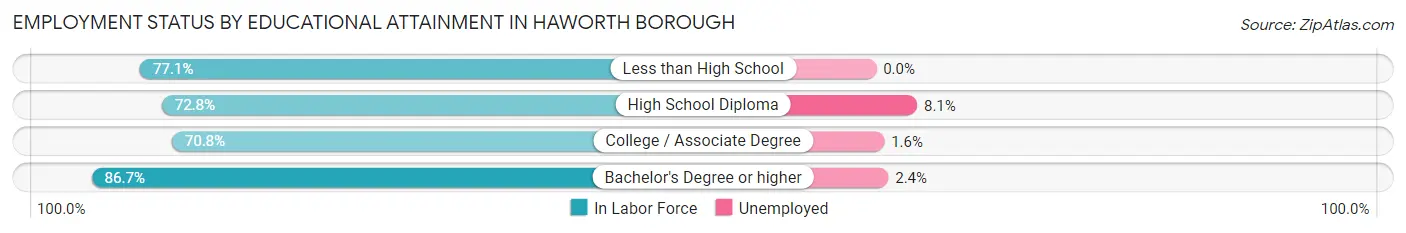
| Educational Attainment | In Labor Force | Unemployed |
| Less than High School | 27 (77.1%) | 0 (0.0%) |
| High School Diploma | 99 (72.8%) | 11 (8.1%) |
| College / Associate Degree | 182 (70.8%) | 4 (1.6%) |
| Bachelor's Degree or higher | 1,006 (86.7%) | 28 (2.4%) |
| Total | 1,313 (82.7%) | 43 (2.7%) |
Employment Occupations by Sex in Haworth borough
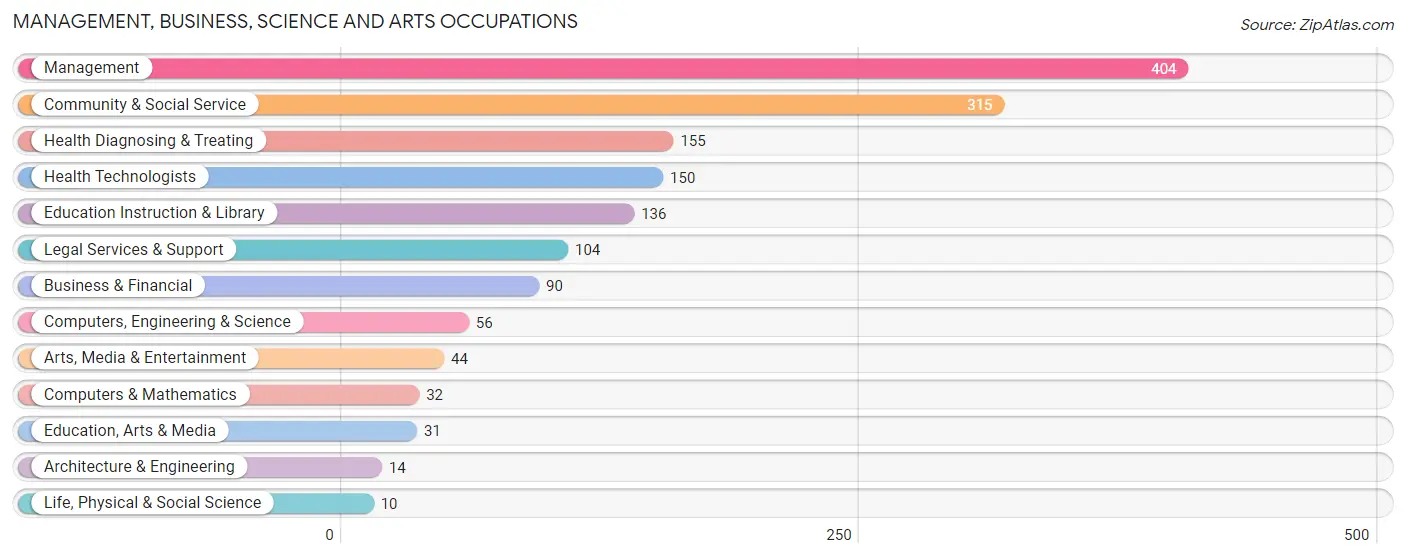
Management, Business, Science and Arts Occupations
The most common Management, Business, Science and Arts occupations in Haworth borough are Management (404 | 25.4%), Community & Social Service (315 | 19.8%), Health Diagnosing & Treating (155 | 9.8%), Health Technologists (150 | 9.4%), and Education Instruction & Library (136 | 8.6%).
Management, Business, Science and Arts Occupations by Sex
Within the Management, Business, Science and Arts occupations in Haworth borough, the most male-oriented occupations are Architecture & Engineering (100.0%), Life, Physical & Social Science (100.0%), and Computers, Engineering & Science (92.9%), while the most female-oriented occupations are Education Instruction & Library (78.7%), Education, Arts & Media (77.4%), and Health Technologists (60.7%).
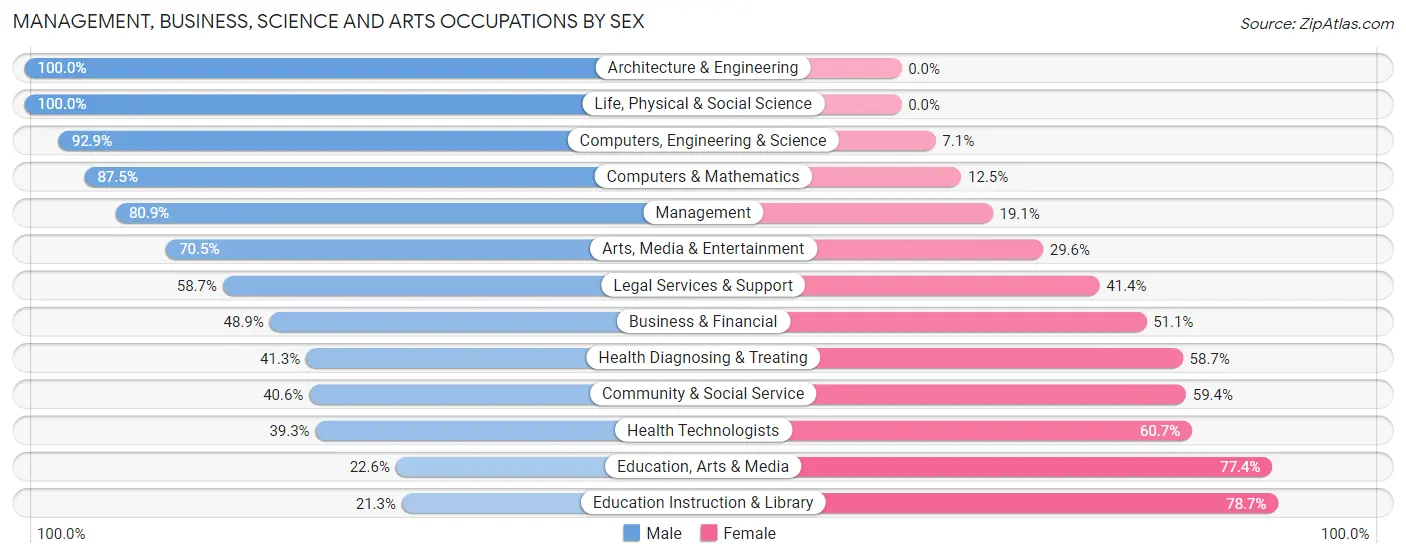
| Occupation | Male | Female |
| Management | 327 (80.9%) | 77 (19.1%) |
| Business & Financial | 44 (48.9%) | 46 (51.1%) |
| Computers, Engineering & Science | 52 (92.9%) | 4 (7.1%) |
| Computers & Mathematics | 28 (87.5%) | 4 (12.5%) |
| Architecture & Engineering | 14 (100.0%) | 0 (0.0%) |
| Life, Physical & Social Science | 10 (100.0%) | 0 (0.0%) |
| Community & Social Service | 128 (40.6%) | 187 (59.4%) |
| Education, Arts & Media | 7 (22.6%) | 24 (77.4%) |
| Legal Services & Support | 61 (58.7%) | 43 (41.3%) |
| Education Instruction & Library | 29 (21.3%) | 107 (78.7%) |
| Arts, Media & Entertainment | 31 (70.5%) | 13 (29.5%) |
| Health Diagnosing & Treating | 64 (41.3%) | 91 (58.7%) |
| Health Technologists | 59 (39.3%) | 91 (60.7%) |
| Total (Category) | 615 (60.3%) | 405 (39.7%) |
| Total (Overall) | 935 (58.8%) | 654 (41.2%) |
Services Occupations
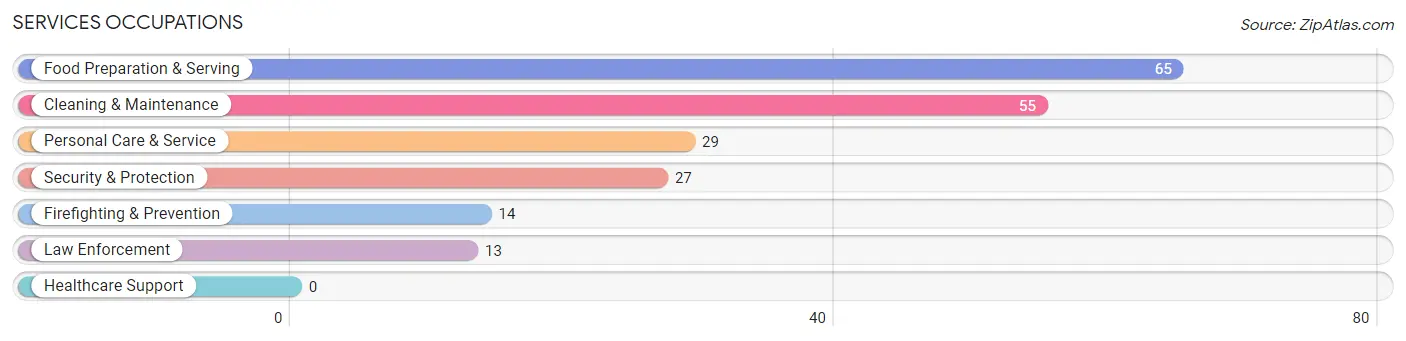
The most common Services occupations in Haworth borough are Food Preparation & Serving (65 | 4.1%), Cleaning & Maintenance (55 | 3.5%), Personal Care & Service (29 | 1.8%), Security & Protection (27 | 1.7%), and Firefighting & Prevention (14 | 0.9%).
Services Occupations by Sex
Within the Services occupations in Haworth borough, the most male-oriented occupations are Security & Protection (100.0%), Firefighting & Prevention (100.0%), and Law Enforcement (100.0%), while the most female-oriented occupations are Personal Care & Service (65.5%), and Food Preparation & Serving (18.5%).
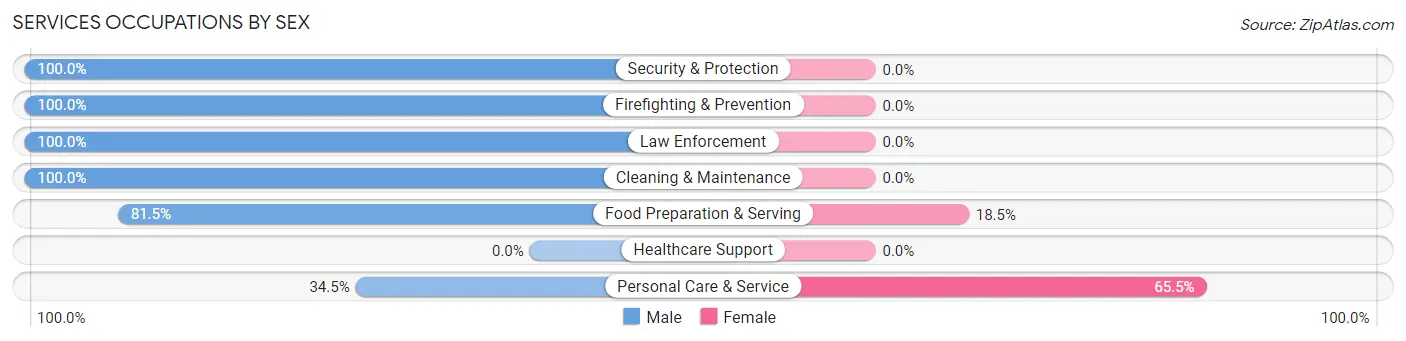
| Occupation | Male | Female |
| Healthcare Support | 0 (0.0%) | 0 (0.0%) |
| Security & Protection | 27 (100.0%) | 0 (0.0%) |
| Firefighting & Prevention | 14 (100.0%) | 0 (0.0%) |
| Law Enforcement | 13 (100.0%) | 0 (0.0%) |
| Food Preparation & Serving | 53 (81.5%) | 12 (18.5%) |
| Cleaning & Maintenance | 55 (100.0%) | 0 (0.0%) |
| Personal Care & Service | 10 (34.5%) | 19 (65.5%) |
| Total (Category) | 145 (82.4%) | 31 (17.6%) |
| Total (Overall) | 935 (58.8%) | 654 (41.2%) |
Sales and Office Occupations
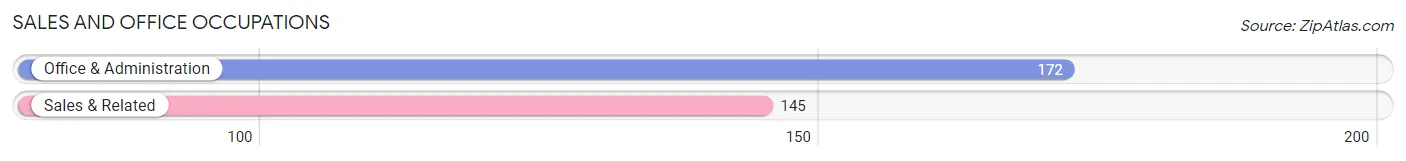
The most common Sales and Office occupations in Haworth borough are Office & Administration (172 | 10.8%), and Sales & Related (145 | 9.1%).
Sales and Office Occupations by Sex
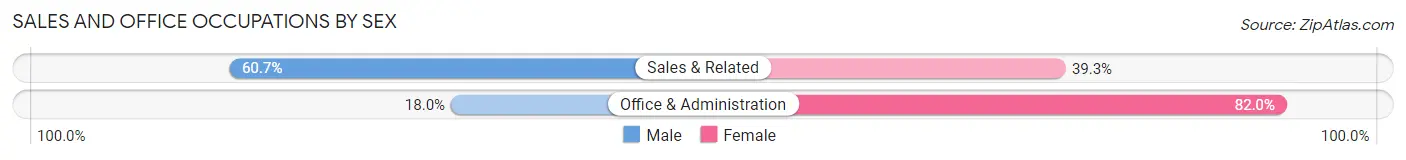
| Occupation | Male | Female |
| Sales & Related | 88 (60.7%) | 57 (39.3%) |
| Office & Administration | 31 (18.0%) | 141 (82.0%) |
| Total (Category) | 119 (37.5%) | 198 (62.5%) |
| Total (Overall) | 935 (58.8%) | 654 (41.2%) |
Natural Resources, Construction and Maintenance Occupations
The most common Natural Resources, Construction and Maintenance occupations in Haworth borough are Construction & Extraction (20 | 1.3%), and Installation, Maintenance & Repair (3 | 0.2%).
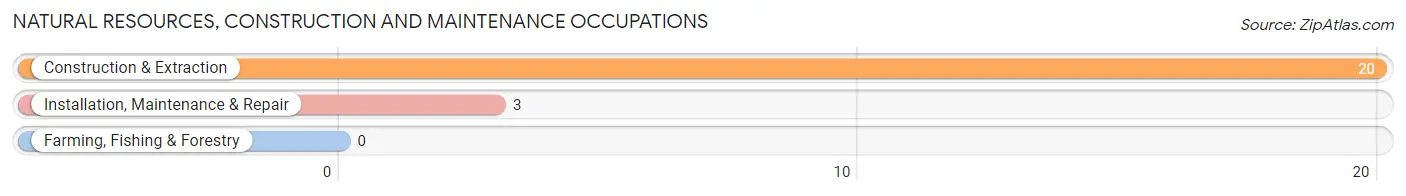
Natural Resources, Construction and Maintenance Occupations by Sex
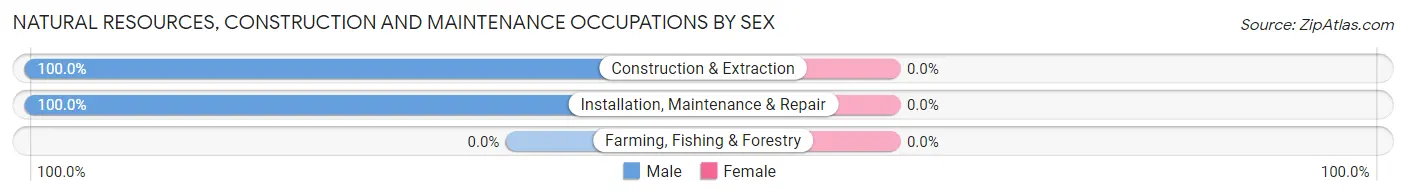
| Occupation | Male | Female |
| Farming, Fishing & Forestry | 0 (0.0%) | 0 (0.0%) |
| Construction & Extraction | 20 (100.0%) | 0 (0.0%) |
| Installation, Maintenance & Repair | 3 (100.0%) | 0 (0.0%) |
| Total (Category) | 23 (100.0%) | 0 (0.0%) |
| Total (Overall) | 935 (58.8%) | 654 (41.2%) |
Production, Transportation and Moving Occupations
The most common Production, Transportation and Moving occupations in Haworth borough are Production (47 | 3.0%), and Material Moving (6 | 0.4%).
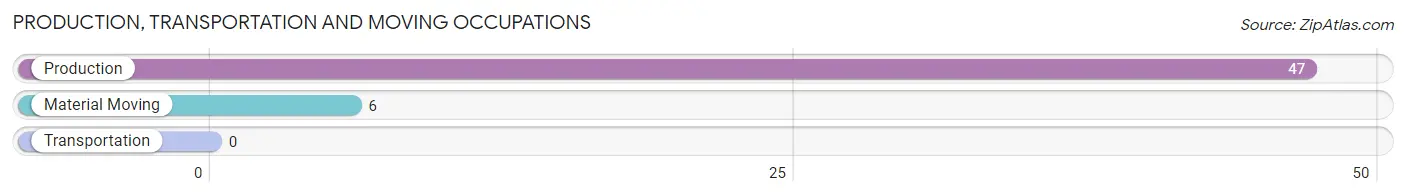
Production, Transportation and Moving Occupations by Sex
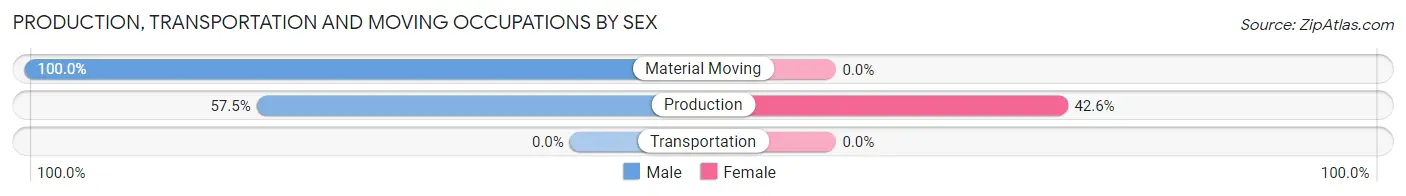
| Occupation | Male | Female |
| Production | 27 (57.5%) | 20 (42.5%) |
| Transportation | 0 (0.0%) | 0 (0.0%) |
| Material Moving | 6 (100.0%) | 0 (0.0%) |
| Total (Category) | 33 (62.3%) | 20 (37.7%) |
| Total (Overall) | 935 (58.8%) | 654 (41.2%) |
Employment Industries by Sex in Haworth borough
Employment Industries in Haworth borough
The major employment industries in Haworth borough include Professional & Scientific (283 | 17.8%), Health Care & Social Assistance (273 | 17.2%), Finance & Insurance (192 | 12.1%), Educational Services (190 | 12.0%), and Administrative & Support (92 | 5.8%).
Employment Industries by Sex in Haworth borough
The Haworth borough industries that see more men than women are Utilities (100.0%), Administrative & Support (91.3%), and Finance & Insurance (88.0%), whereas the industries that tend to have a higher number of women are Educational Services (68.4%), Health Care & Social Assistance (63.0%), and Wholesale Trade (49.3%).
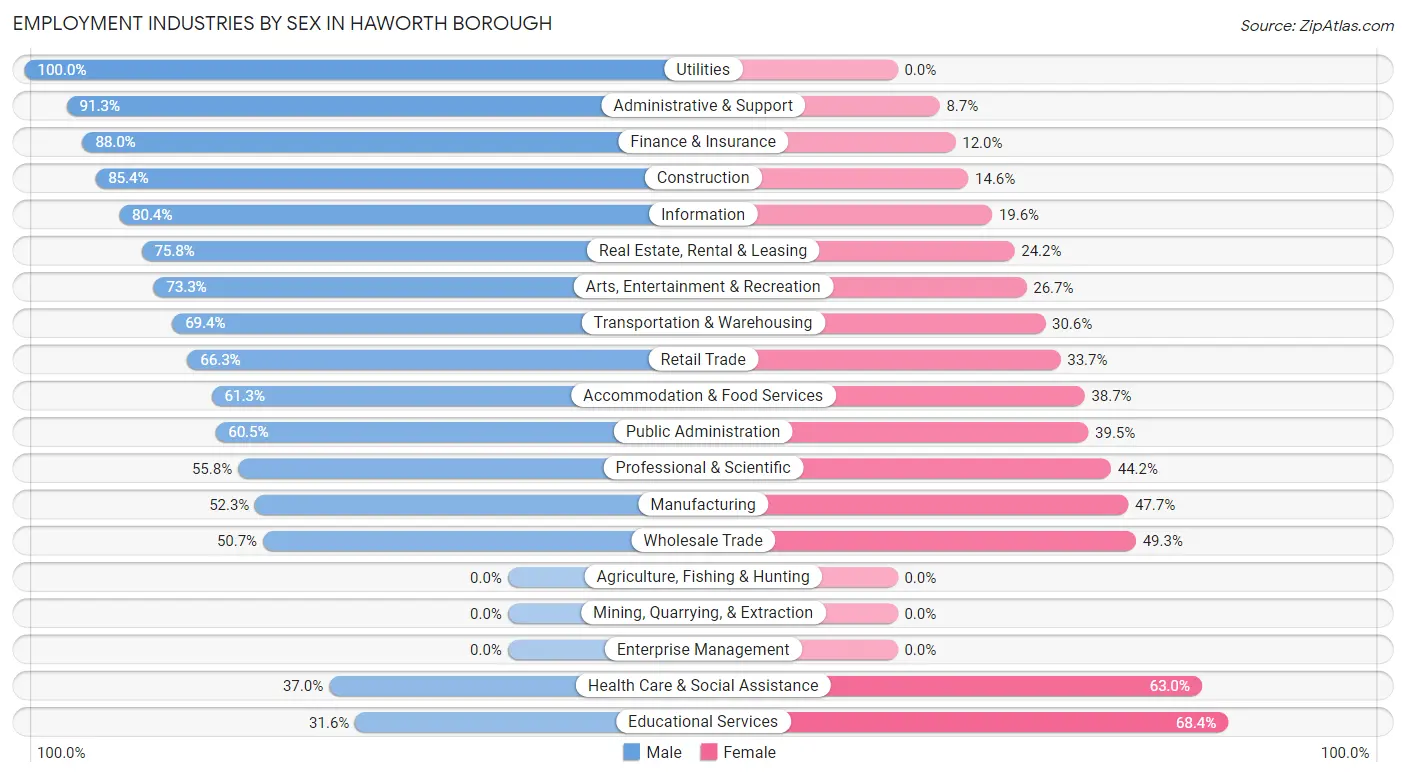
| Industry | Male | Female |
| Agriculture, Fishing & Hunting | 0 (0.0%) | 0 (0.0%) |
| Mining, Quarrying, & Extraction | 0 (0.0%) | 0 (0.0%) |
| Construction | 35 (85.4%) | 6 (14.6%) |
| Manufacturing | 23 (52.3%) | 21 (47.7%) |
| Wholesale Trade | 38 (50.7%) | 37 (49.3%) |
| Retail Trade | 59 (66.3%) | 30 (33.7%) |
| Transportation & Warehousing | 25 (69.4%) | 11 (30.6%) |
| Utilities | 6 (100.0%) | 0 (0.0%) |
| Information | 37 (80.4%) | 9 (19.6%) |
| Finance & Insurance | 169 (88.0%) | 23 (12.0%) |
| Real Estate, Rental & Leasing | 47 (75.8%) | 15 (24.2%) |
| Professional & Scientific | 158 (55.8%) | 125 (44.2%) |
| Enterprise Management | 0 (0.0%) | 0 (0.0%) |
| Administrative & Support | 84 (91.3%) | 8 (8.7%) |
| Educational Services | 60 (31.6%) | 130 (68.4%) |
| Health Care & Social Assistance | 101 (37.0%) | 172 (63.0%) |
| Arts, Entertainment & Recreation | 22 (73.3%) | 8 (26.7%) |
| Accommodation & Food Services | 19 (61.3%) | 12 (38.7%) |
| Public Administration | 23 (60.5%) | 15 (39.5%) |
| Total | 935 (58.8%) | 654 (41.2%) |
Education in Haworth borough
School Enrollment in Haworth borough
The most common levels of schooling among the 1,142 students in Haworth borough are middle school (363 | 31.8%), high school (283 | 24.8%), and elementary school (190 | 16.6%).
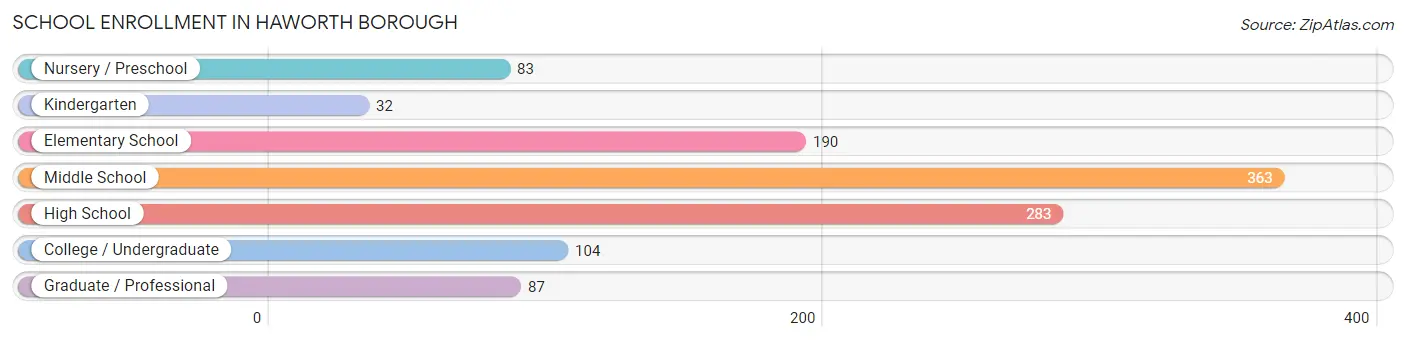
| School Level | # Students | % Students |
| Nursery / Preschool | 83 | 7.3% |
| Kindergarten | 32 | 2.8% |
| Elementary School | 190 | 16.6% |
| Middle School | 363 | 31.8% |
| High School | 283 | 24.8% |
| College / Undergraduate | 104 | 9.1% |
| Graduate / Professional | 87 | 7.6% |
| Total | 1,142 | 100.0% |
School Enrollment by Age by Funding Source in Haworth borough
Out of a total of 1,142 students who are enrolled in schools in Haworth borough, 281 (24.6%) attend a private institution, while the remaining 861 (75.4%) are enrolled in public schools. The age group of 35 years and over has the highest likelihood of being enrolled in private schools, with 75 (97.4% in the age bracket) enrolled. Conversely, the age group of 18 to 19 year olds has the lowest likelihood of being enrolled in a private school, with 44 (100.0% in the age bracket) attending a public institution.
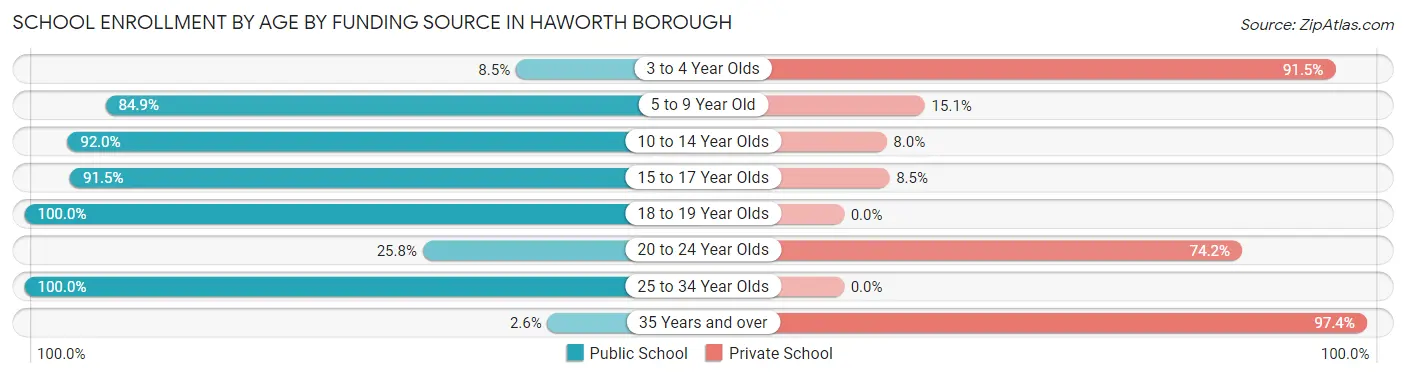
| Age Bracket | Public School | Private School |
| 3 to 4 Year Olds | 5 (8.5%) | 54 (91.5%) |
| 5 to 9 Year Old | 197 (84.9%) | 35 (15.1%) |
| 10 to 14 Year Olds | 370 (92.0%) | 32 (8.0%) |
| 15 to 17 Year Olds | 205 (91.5%) | 19 (8.5%) |
| 18 to 19 Year Olds | 44 (100.0%) | 0 (0.0%) |
| 20 to 24 Year Olds | 23 (25.8%) | 66 (74.2%) |
| 25 to 34 Year Olds | 15 (100.0%) | 0 (0.0%) |
| 35 Years and over | 2 (2.6%) | 75 (97.4%) |
| Total | 861 (75.4%) | 281 (24.6%) |
Educational Attainment by Field of Study in Haworth borough
Social sciences (226 | 13.8%), business (223 | 13.6%), liberal arts & history (180 | 11.0%), education (143 | 8.7%), and computers & mathematics (142 | 8.6%) are the most common fields of study among 1,643 individuals in Haworth borough who have obtained a bachelor's degree or higher.
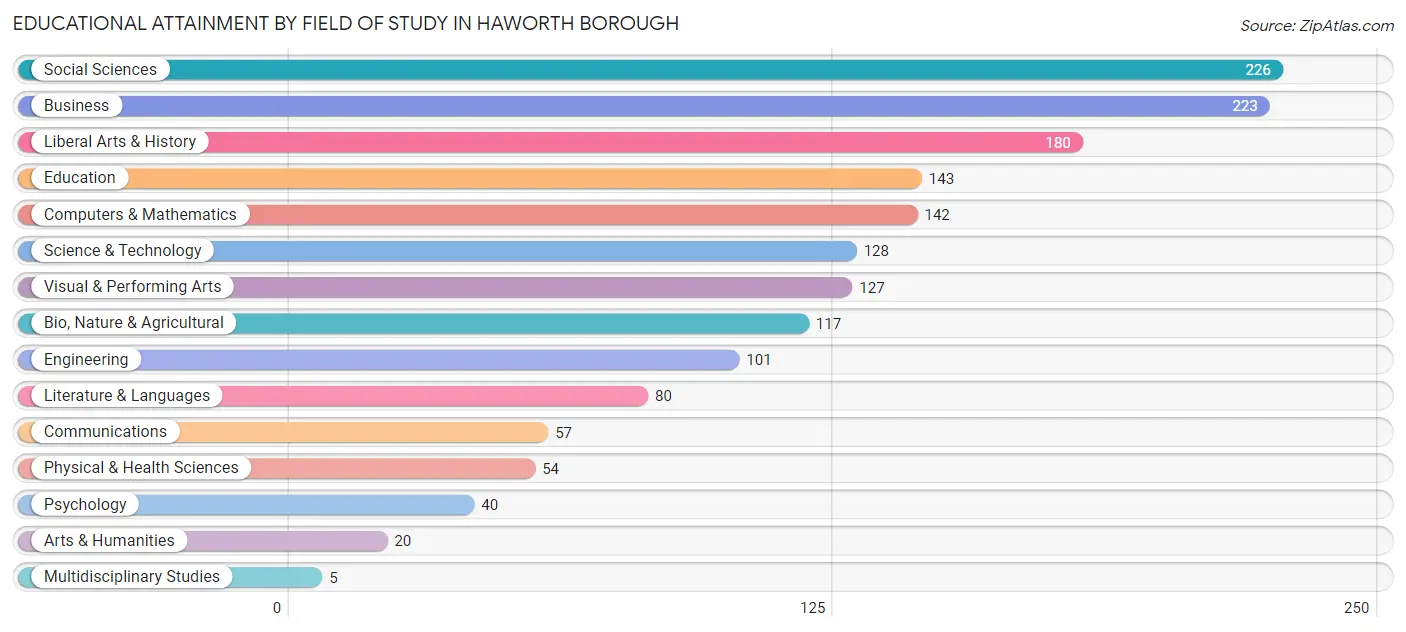
| Field of Study | # Graduates | % Graduates |
| Computers & Mathematics | 142 | 8.6% |
| Bio, Nature & Agricultural | 117 | 7.1% |
| Physical & Health Sciences | 54 | 3.3% |
| Psychology | 40 | 2.4% |
| Social Sciences | 226 | 13.8% |
| Engineering | 101 | 6.1% |
| Multidisciplinary Studies | 5 | 0.3% |
| Science & Technology | 128 | 7.8% |
| Business | 223 | 13.6% |
| Education | 143 | 8.7% |
| Literature & Languages | 80 | 4.9% |
| Liberal Arts & History | 180 | 11.0% |
| Visual & Performing Arts | 127 | 7.7% |
| Communications | 57 | 3.5% |
| Arts & Humanities | 20 | 1.2% |
| Total | 1,643 | 100.0% |
Transportation & Commute in Haworth borough
Vehicle Availability by Sex in Haworth borough
The most prevalent vehicle ownership categories in Haworth borough are males with 2 vehicles (464, accounting for 49.9%) and females with 2 vehicles (257, making up 71.5%).
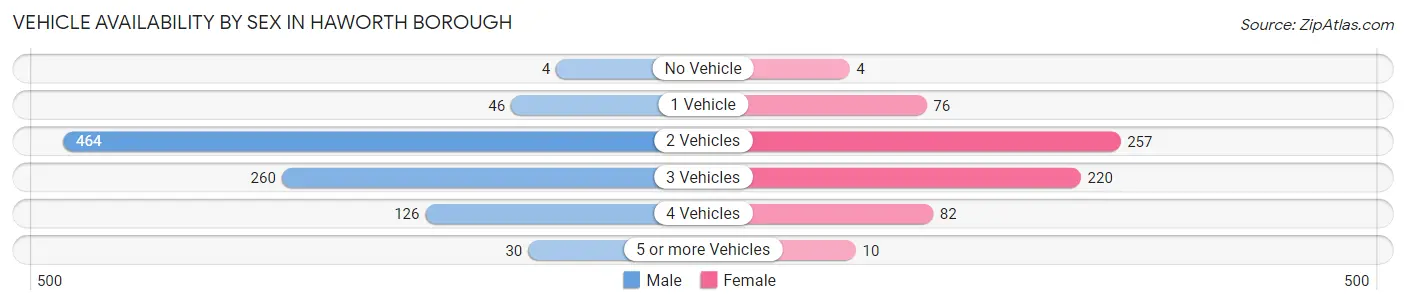
| Vehicles Available | Male | Female |
| No Vehicle | 4 (0.4%) | 4 (0.6%) |
| 1 Vehicle | 46 (5.0%) | 76 (11.7%) |
| 2 Vehicles | 464 (49.9%) | 257 (39.6%) |
| 3 Vehicles | 260 (28.0%) | 220 (33.9%) |
| 4 Vehicles | 126 (13.6%) | 82 (12.6%) |
| 5 or more Vehicles | 30 (3.2%) | 10 (1.5%) |
| Total | 930 (100.0%) | 649 (100.0%) |
Commute Time in Haworth borough
The most frequently occuring commute durations in Haworth borough are 60 to 89 minutes (195 commuters, 16.7%), 20 to 24 minutes (164 commuters, 14.0%), and 30 to 34 minutes (152 commuters, 13.0%).
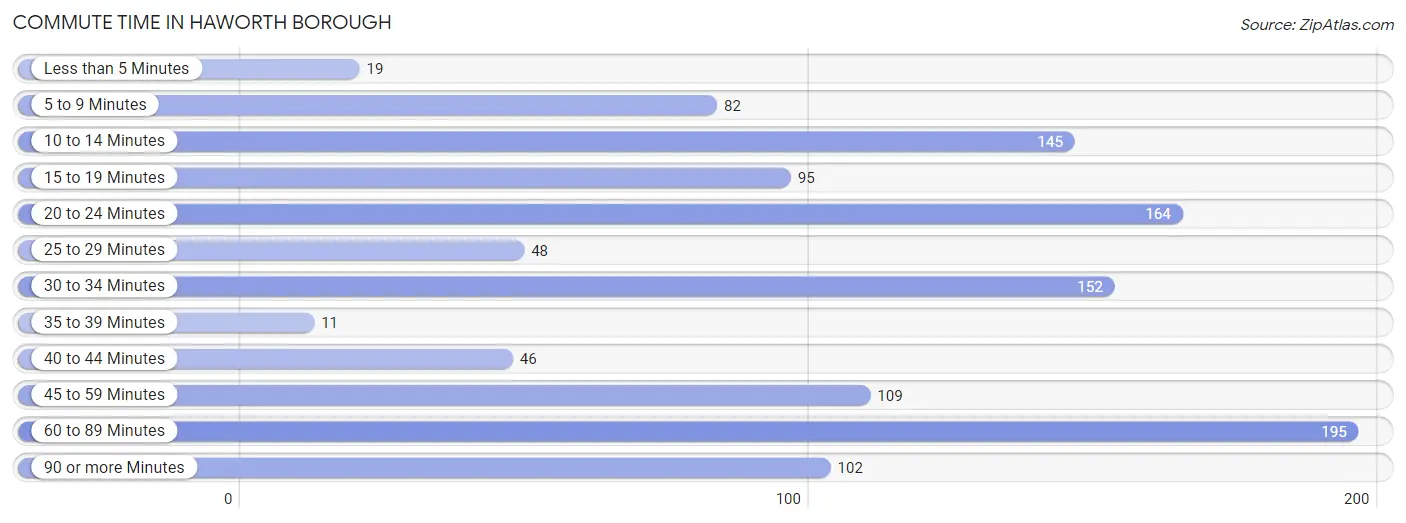
| Commute Time | # Commuters | % Commuters |
| Less than 5 Minutes | 19 | 1.6% |
| 5 to 9 Minutes | 82 | 7.0% |
| 10 to 14 Minutes | 145 | 12.4% |
| 15 to 19 Minutes | 95 | 8.1% |
| 20 to 24 Minutes | 164 | 14.0% |
| 25 to 29 Minutes | 48 | 4.1% |
| 30 to 34 Minutes | 152 | 13.0% |
| 35 to 39 Minutes | 11 | 0.9% |
| 40 to 44 Minutes | 46 | 3.9% |
| 45 to 59 Minutes | 109 | 9.3% |
| 60 to 89 Minutes | 195 | 16.7% |
| 90 or more Minutes | 102 | 8.7% |
Commute Time by Sex in Haworth borough
The most common commute times in Haworth borough are 60 to 89 minutes (137 commuters, 20.4%) for males and 20 to 24 minutes (88 commuters, 17.7%) for females.
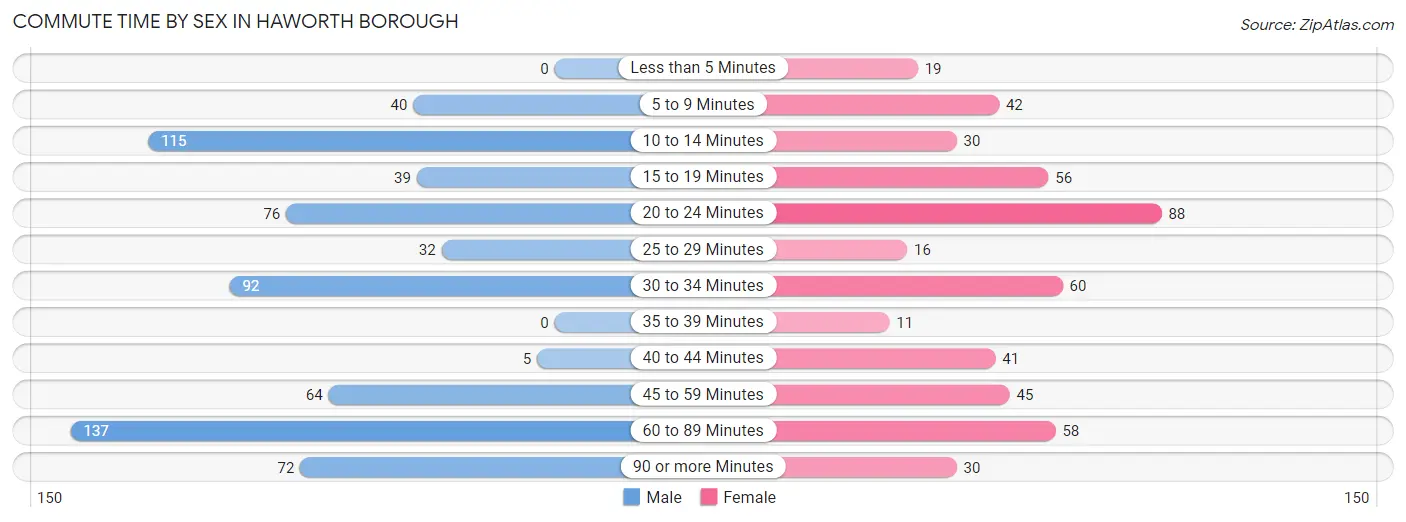
| Commute Time | Male | Female |
| Less than 5 Minutes | 0 (0.0%) | 19 (3.8%) |
| 5 to 9 Minutes | 40 (5.9%) | 42 (8.5%) |
| 10 to 14 Minutes | 115 (17.1%) | 30 (6.0%) |
| 15 to 19 Minutes | 39 (5.8%) | 56 (11.3%) |
| 20 to 24 Minutes | 76 (11.3%) | 88 (17.7%) |
| 25 to 29 Minutes | 32 (4.8%) | 16 (3.2%) |
| 30 to 34 Minutes | 92 (13.7%) | 60 (12.1%) |
| 35 to 39 Minutes | 0 (0.0%) | 11 (2.2%) |
| 40 to 44 Minutes | 5 (0.7%) | 41 (8.3%) |
| 45 to 59 Minutes | 64 (9.5%) | 45 (9.1%) |
| 60 to 89 Minutes | 137 (20.4%) | 58 (11.7%) |
| 90 or more Minutes | 72 (10.7%) | 30 (6.0%) |
Time of Departure to Work by Sex in Haworth borough
The most frequent times of departure to work in Haworth borough are 7:30 AM to 7:59 AM (152, 22.6%) for males and 8:00 AM to 8:29 AM (108, 21.8%) for females.
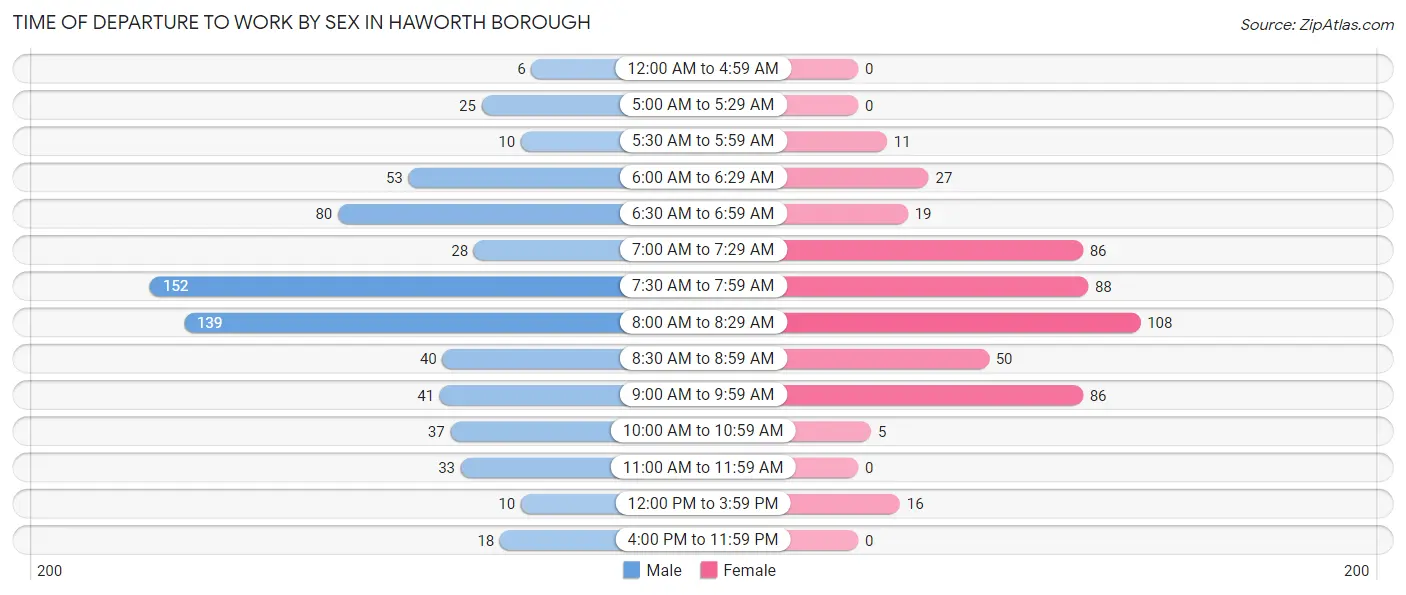
| Time of Departure | Male | Female |
| 12:00 AM to 4:59 AM | 6 (0.9%) | 0 (0.0%) |
| 5:00 AM to 5:29 AM | 25 (3.7%) | 0 (0.0%) |
| 5:30 AM to 5:59 AM | 10 (1.5%) | 11 (2.2%) |
| 6:00 AM to 6:29 AM | 53 (7.9%) | 27 (5.4%) |
| 6:30 AM to 6:59 AM | 80 (11.9%) | 19 (3.8%) |
| 7:00 AM to 7:29 AM | 28 (4.2%) | 86 (17.3%) |
| 7:30 AM to 7:59 AM | 152 (22.6%) | 88 (17.7%) |
| 8:00 AM to 8:29 AM | 139 (20.7%) | 108 (21.8%) |
| 8:30 AM to 8:59 AM | 40 (5.9%) | 50 (10.1%) |
| 9:00 AM to 9:59 AM | 41 (6.1%) | 86 (17.3%) |
| 10:00 AM to 10:59 AM | 37 (5.5%) | 5 (1.0%) |
| 11:00 AM to 11:59 AM | 33 (4.9%) | 0 (0.0%) |
| 12:00 PM to 3:59 PM | 10 (1.5%) | 16 (3.2%) |
| 4:00 PM to 11:59 PM | 18 (2.7%) | 0 (0.0%) |
| Total | 672 (100.0%) | 496 (100.0%) |
Housing Occupancy in Haworth borough
Occupancy by Ownership in Haworth borough
Of the total 1,069 dwellings in Haworth borough, owner-occupied units account for 993 (92.9%), while renter-occupied units make up 76 (7.1%).
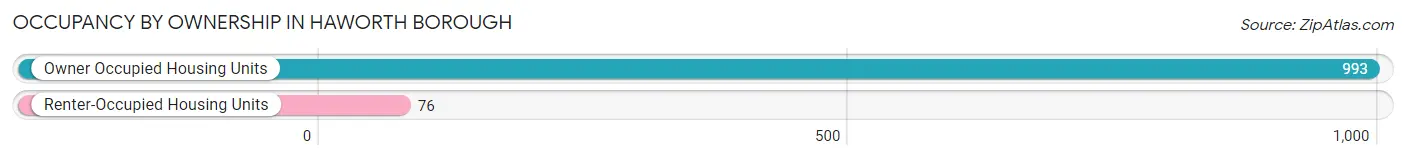
| Occupancy | # Housing Units | % Housing Units |
| Owner Occupied Housing Units | 993 | 92.9% |
| Renter-Occupied Housing Units | 76 | 7.1% |
| Total Occupied Housing Units | 1,069 | 100.0% |
Occupancy by Household Size in Haworth borough
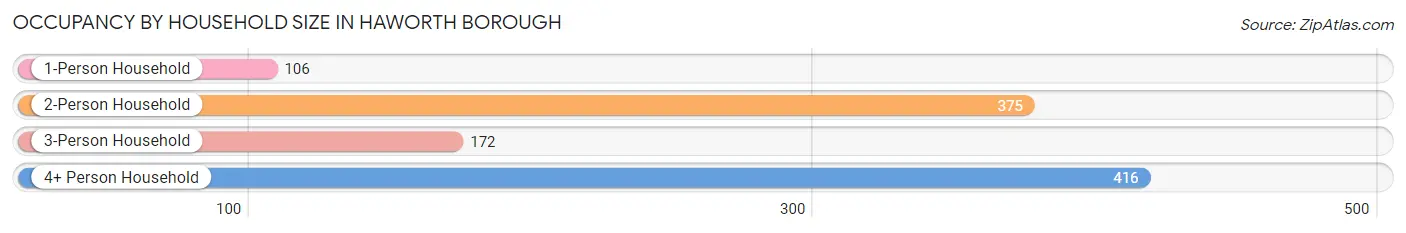
| Household Size | # Housing Units | % Housing Units |
| 1-Person Household | 106 | 9.9% |
| 2-Person Household | 375 | 35.1% |
| 3-Person Household | 172 | 16.1% |
| 4+ Person Household | 416 | 38.9% |
| Total Housing Units | 1,069 | 100.0% |
Occupancy by Ownership by Household Size in Haworth borough
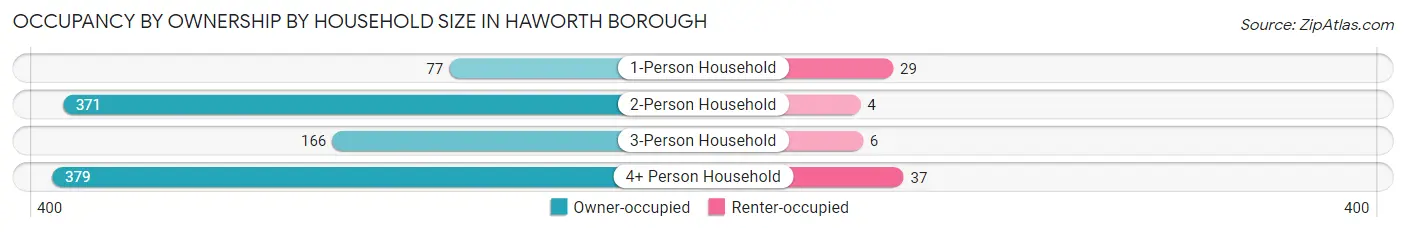
| Household Size | Owner-occupied | Renter-occupied |
| 1-Person Household | 77 (72.6%) | 29 (27.4%) |
| 2-Person Household | 371 (98.9%) | 4 (1.1%) |
| 3-Person Household | 166 (96.5%) | 6 (3.5%) |
| 4+ Person Household | 379 (91.1%) | 37 (8.9%) |
| Total Housing Units | 993 (92.9%) | 76 (7.1%) |
Occupancy by Educational Attainment in Haworth borough
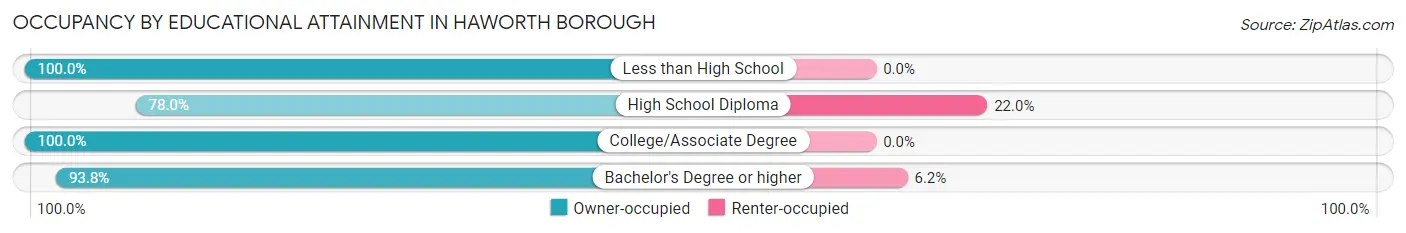
| Household Size | Owner-occupied | Renter-occupied |
| Less than High School | 11 (100.0%) | 0 (0.0%) |
| High School Diploma | 85 (78.0%) | 24 (22.0%) |
| College/Associate Degree | 113 (100.0%) | 0 (0.0%) |
| Bachelor's Degree or higher | 784 (93.8%) | 52 (6.2%) |
Occupancy by Age of Householder in Haworth borough
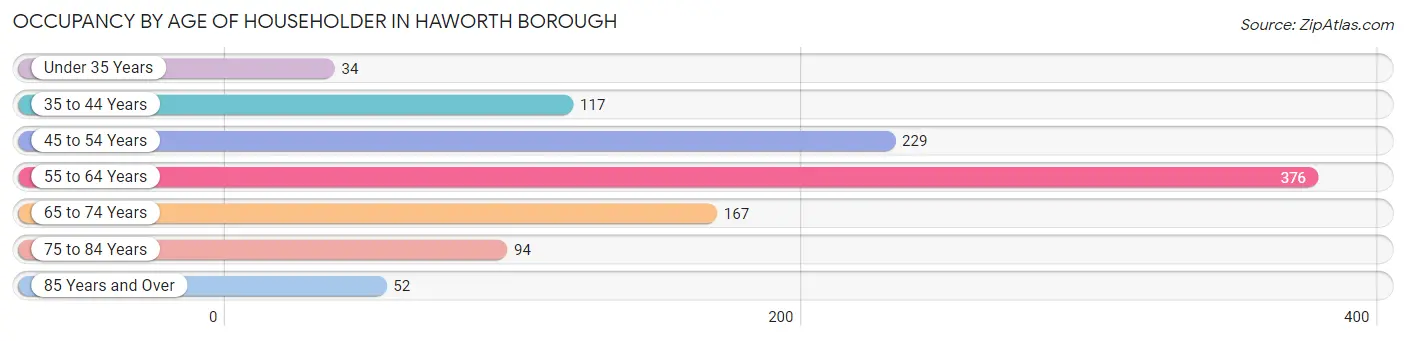
| Age Bracket | # Households | % Households |
| Under 35 Years | 34 | 3.2% |
| 35 to 44 Years | 117 | 10.9% |
| 45 to 54 Years | 229 | 21.4% |
| 55 to 64 Years | 376 | 35.2% |
| 65 to 74 Years | 167 | 15.6% |
| 75 to 84 Years | 94 | 8.8% |
| 85 Years and Over | 52 | 4.9% |
| Total | 1,069 | 100.0% |
Housing Finances in Haworth borough
Median Income by Occupancy in Haworth borough
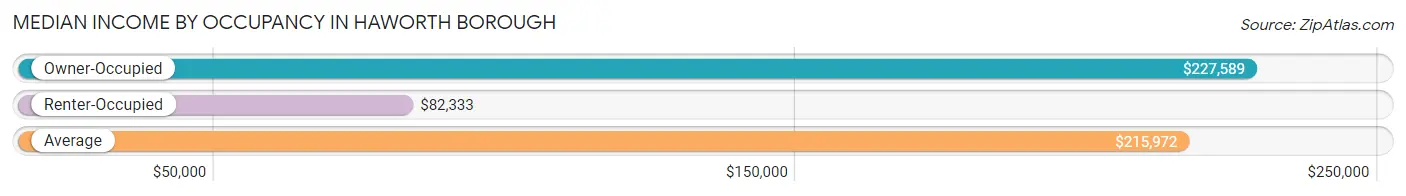
| Occupancy Type | # Households | Median Income |
| Owner-Occupied | 993 (92.9%) | $227,589 |
| Renter-Occupied | 76 (7.1%) | $82,333 |
| Average | 1,069 (100.0%) | $215,972 |
Occupancy by Householder Income Bracket in Haworth borough
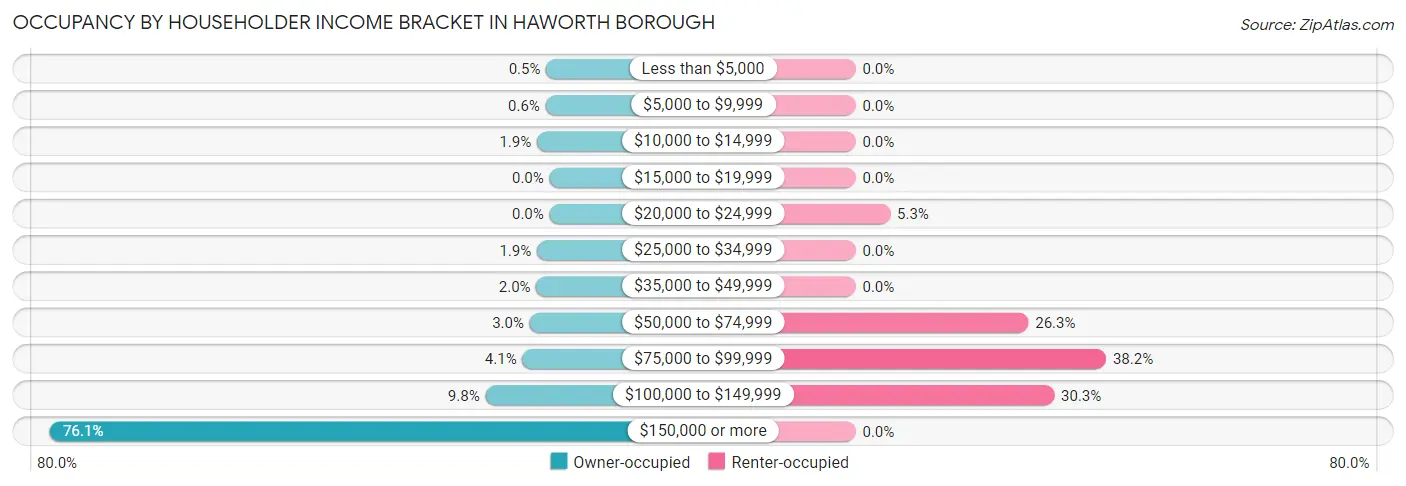
| Income Bracket | Owner-occupied | Renter-occupied |
| Less than $5,000 | 5 (0.5%) | 0 (0.0%) |
| $5,000 to $9,999 | 6 (0.6%) | 0 (0.0%) |
| $10,000 to $14,999 | 19 (1.9%) | 0 (0.0%) |
| $15,000 to $19,999 | 0 (0.0%) | 0 (0.0%) |
| $20,000 to $24,999 | 0 (0.0%) | 4 (5.3%) |
| $25,000 to $34,999 | 19 (1.9%) | 0 (0.0%) |
| $35,000 to $49,999 | 20 (2.0%) | 0 (0.0%) |
| $50,000 to $74,999 | 30 (3.0%) | 20 (26.3%) |
| $75,000 to $99,999 | 41 (4.1%) | 29 (38.2%) |
| $100,000 to $149,999 | 97 (9.8%) | 23 (30.3%) |
| $150,000 or more | 756 (76.1%) | 0 (0.0%) |
| Total | 993 (100.0%) | 76 (100.0%) |
Monthly Housing Cost Tiers in Haworth borough
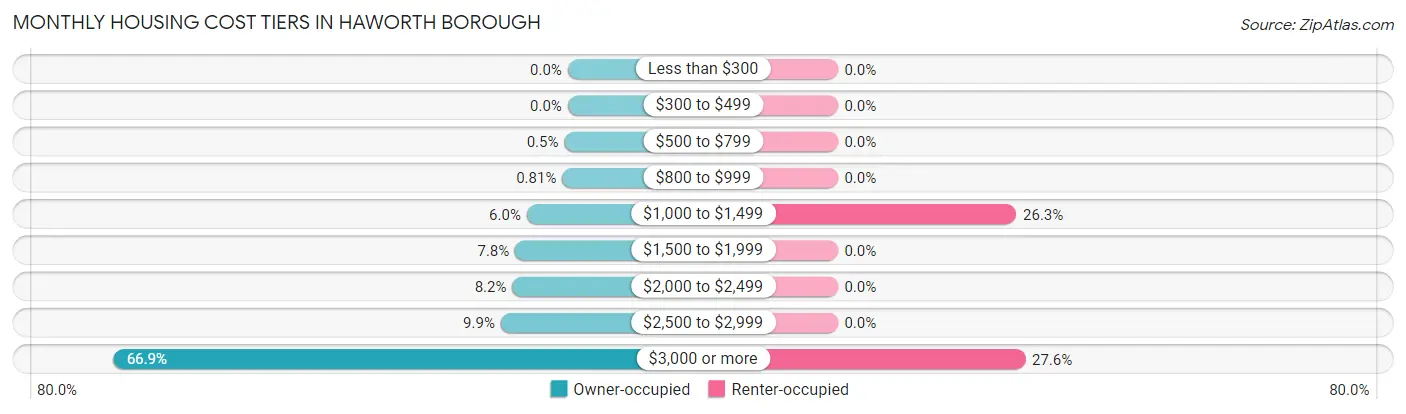
| Monthly Cost | Owner-occupied | Renter-occupied |
| Less than $300 | 0 (0.0%) | 0 (0.0%) |
| $300 to $499 | 0 (0.0%) | 0 (0.0%) |
| $500 to $799 | 5 (0.5%) | 0 (0.0%) |
| $800 to $999 | 8 (0.8%) | 0 (0.0%) |
| $1,000 to $1,499 | 60 (6.0%) | 20 (26.3%) |
| $1,500 to $1,999 | 77 (7.7%) | 0 (0.0%) |
| $2,000 to $2,499 | 81 (8.2%) | 0 (0.0%) |
| $2,500 to $2,999 | 98 (9.9%) | 0 (0.0%) |
| $3,000 or more | 664 (66.9%) | 21 (27.6%) |
| Total | 993 (100.0%) | 76 (100.0%) |
Physical Housing Characteristics in Haworth borough
Housing Structures in Haworth borough
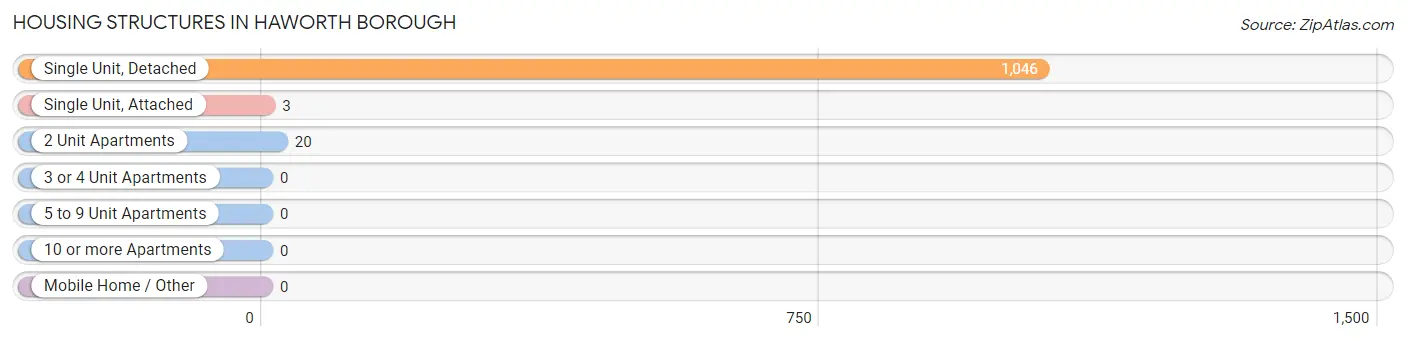
| Structure Type | # Housing Units | % Housing Units |
| Single Unit, Detached | 1,046 | 97.9% |
| Single Unit, Attached | 3 | 0.3% |
| 2 Unit Apartments | 20 | 1.9% |
| 3 or 4 Unit Apartments | 0 | 0.0% |
| 5 to 9 Unit Apartments | 0 | 0.0% |
| 10 or more Apartments | 0 | 0.0% |
| Mobile Home / Other | 0 | 0.0% |
| Total | 1,069 | 100.0% |
Housing Structures by Occupancy in Haworth borough
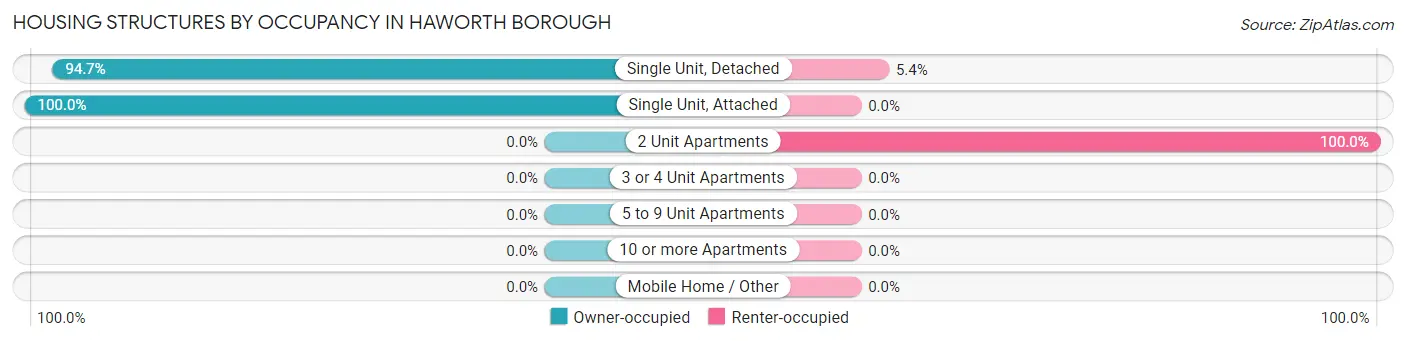
| Structure Type | Owner-occupied | Renter-occupied |
| Single Unit, Detached | 990 (94.7%) | 56 (5.3%) |
| Single Unit, Attached | 3 (100.0%) | 0 (0.0%) |
| 2 Unit Apartments | 0 (0.0%) | 20 (100.0%) |
| 3 or 4 Unit Apartments | 0 (0.0%) | 0 (0.0%) |
| 5 to 9 Unit Apartments | 0 (0.0%) | 0 (0.0%) |
| 10 or more Apartments | 0 (0.0%) | 0 (0.0%) |
| Mobile Home / Other | 0 (0.0%) | 0 (0.0%) |
| Total | 993 (92.9%) | 76 (7.1%) |
Housing Structures by Number of Rooms in Haworth borough
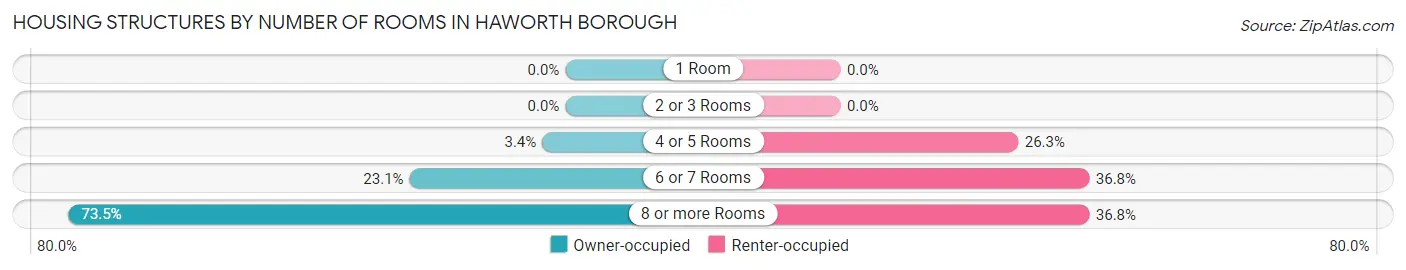
| Number of Rooms | Owner-occupied | Renter-occupied |
| 1 Room | 0 (0.0%) | 0 (0.0%) |
| 2 or 3 Rooms | 0 (0.0%) | 0 (0.0%) |
| 4 or 5 Rooms | 34 (3.4%) | 20 (26.3%) |
| 6 or 7 Rooms | 229 (23.1%) | 28 (36.8%) |
| 8 or more Rooms | 730 (73.5%) | 28 (36.8%) |
| Total | 993 (100.0%) | 76 (100.0%) |
Housing Structure by Heating Type in Haworth borough
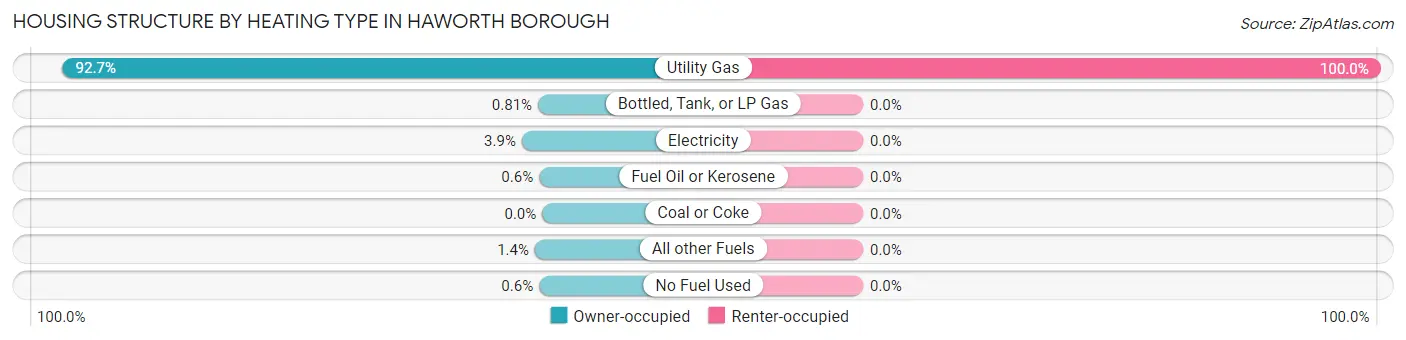
| Heating Type | Owner-occupied | Renter-occupied |
| Utility Gas | 920 (92.6%) | 76 (100.0%) |
| Bottled, Tank, or LP Gas | 8 (0.8%) | 0 (0.0%) |
| Electricity | 39 (3.9%) | 0 (0.0%) |
| Fuel Oil or Kerosene | 6 (0.6%) | 0 (0.0%) |
| Coal or Coke | 0 (0.0%) | 0 (0.0%) |
| All other Fuels | 14 (1.4%) | 0 (0.0%) |
| No Fuel Used | 6 (0.6%) | 0 (0.0%) |
| Total | 993 (100.0%) | 76 (100.0%) |
Household Vehicle Usage in Haworth borough
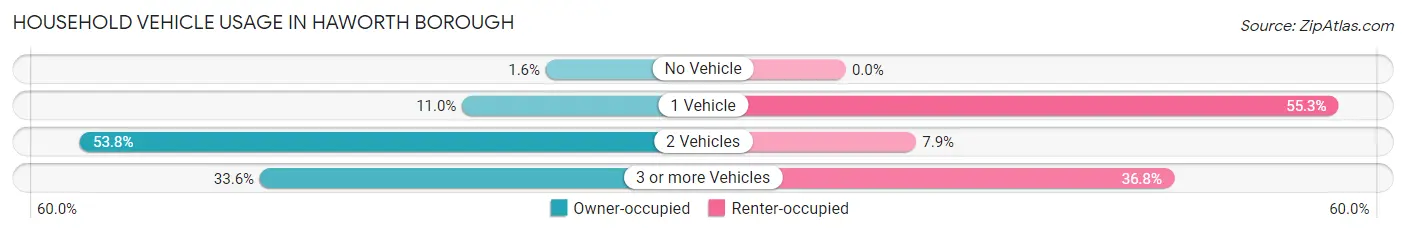
| Vehicles per Household | Owner-occupied | Renter-occupied |
| No Vehicle | 16 (1.6%) | 0 (0.0%) |
| 1 Vehicle | 109 (11.0%) | 42 (55.3%) |
| 2 Vehicles | 534 (53.8%) | 6 (7.9%) |
| 3 or more Vehicles | 334 (33.6%) | 28 (36.8%) |
| Total | 993 (100.0%) | 76 (100.0%) |
Real Estate & Mortgages in Haworth borough
Real Estate and Mortgage Overview in Haworth borough
| Characteristic | Without Mortgage | With Mortgage |
| Housing Units | 301 | 692 |
| Median Property Value | $831,300 | $763,200 |
| Median Household Income | $158,750 | $603 |
| Monthly Housing Costs | $1,501 | $620 |
| Real Estate Taxes | $10,001 | $0 |
Property Value by Mortgage Status in Haworth borough
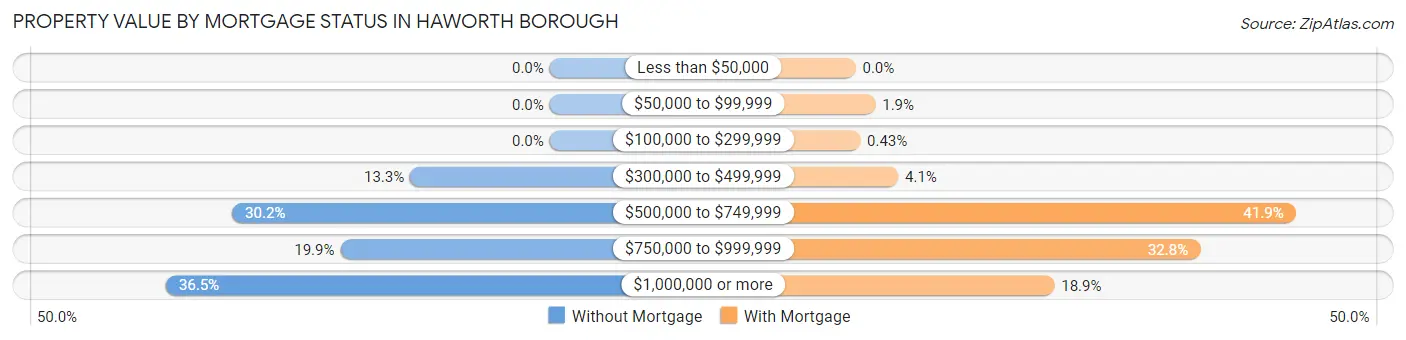
| Property Value | Without Mortgage | With Mortgage |
| Less than $50,000 | 0 (0.0%) | 0 (0.0%) |
| $50,000 to $99,999 | 0 (0.0%) | 13 (1.9%) |
| $100,000 to $299,999 | 0 (0.0%) | 3 (0.4%) |
| $300,000 to $499,999 | 40 (13.3%) | 28 (4.1%) |
| $500,000 to $749,999 | 91 (30.2%) | 290 (41.9%) |
| $750,000 to $999,999 | 60 (19.9%) | 227 (32.8%) |
| $1,000,000 or more | 110 (36.5%) | 131 (18.9%) |
| Total | 301 (100.0%) | 692 (100.0%) |
Household Income by Mortgage Status in Haworth borough
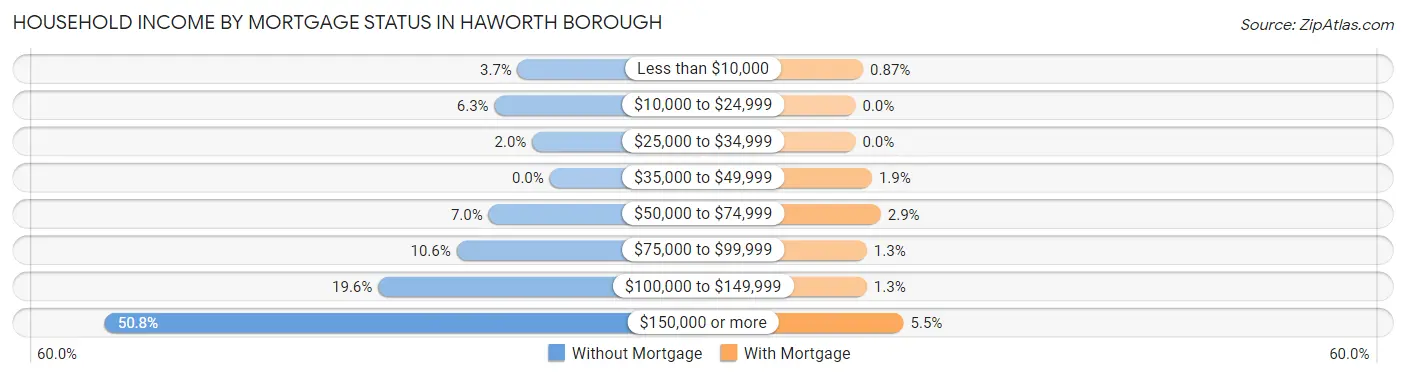
| Household Income | Without Mortgage | With Mortgage |
| Less than $10,000 | 11 (3.6%) | 6 (0.9%) |
| $10,000 to $24,999 | 19 (6.3%) | 0 (0.0%) |
| $25,000 to $34,999 | 6 (2.0%) | 0 (0.0%) |
| $35,000 to $49,999 | 0 (0.0%) | 13 (1.9%) |
| $50,000 to $74,999 | 21 (7.0%) | 20 (2.9%) |
| $75,000 to $99,999 | 32 (10.6%) | 9 (1.3%) |
| $100,000 to $149,999 | 59 (19.6%) | 9 (1.3%) |
| $150,000 or more | 153 (50.8%) | 38 (5.5%) |
| Total | 301 (100.0%) | 692 (100.0%) |
Property Value to Household Income Ratio in Haworth borough
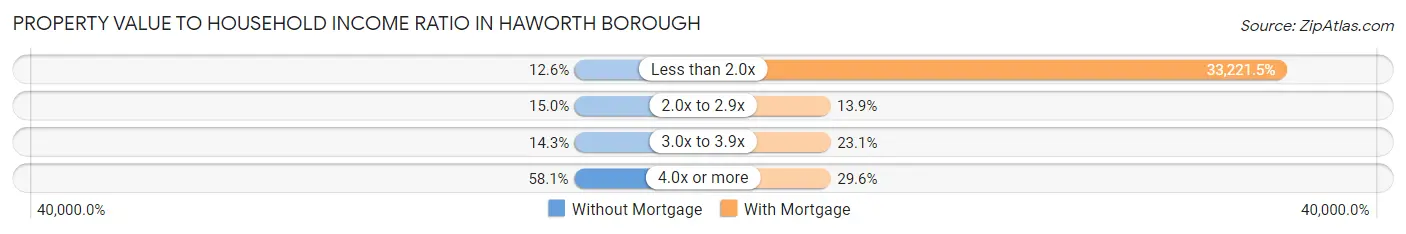
| Value-to-Income Ratio | Without Mortgage | With Mortgage |
| Less than 2.0x | 38 (12.6%) | 229,893 (33,221.5%) |
| 2.0x to 2.9x | 45 (14.9%) | 96 (13.9%) |
| 3.0x to 3.9x | 43 (14.3%) | 160 (23.1%) |
| 4.0x or more | 175 (58.1%) | 205 (29.6%) |
| Total | 301 (100.0%) | 692 (100.0%) |
Real Estate Taxes by Mortgage Status in Haworth borough
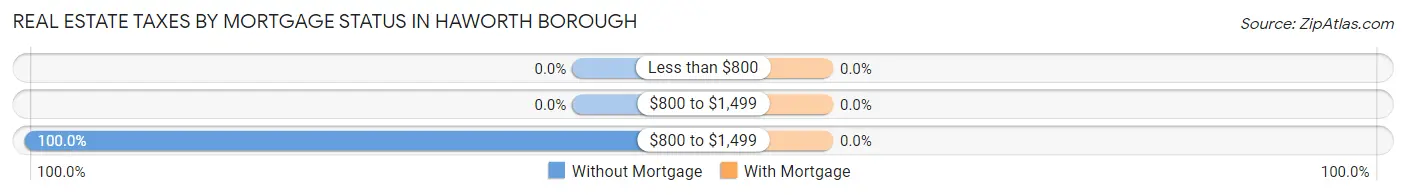
| Property Taxes | Without Mortgage | With Mortgage |
| Less than $800 | 0 (0.0%) | 0 (0.0%) |
| $800 to $1,499 | 0 (0.0%) | 0 (0.0%) |
| $800 to $1,499 | 301 (100.0%) | 0 (0.0%) |
| Total | 301 (100.0%) | 692 (100.0%) |
Health & Disability in Haworth borough
Health Insurance Coverage by Age in Haworth borough
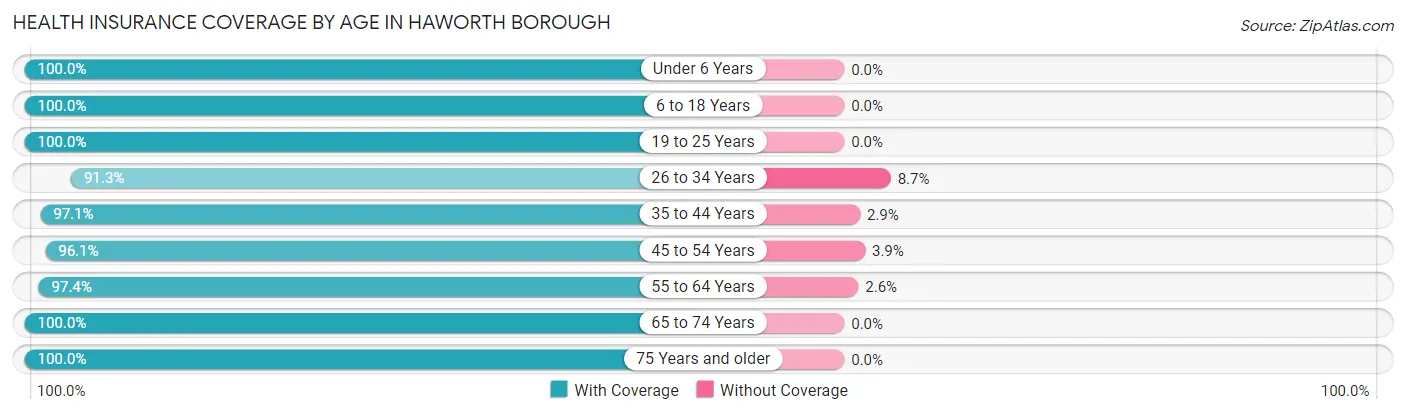
| Age Bracket | With Coverage | Without Coverage |
| Under 6 Years | 197 (100.0%) | 0 (0.0%) |
| 6 to 18 Years | 852 (100.0%) | 0 (0.0%) |
| 19 to 25 Years | 165 (100.0%) | 0 (0.0%) |
| 26 to 34 Years | 116 (91.3%) | 11 (8.7%) |
| 35 to 44 Years | 265 (97.1%) | 8 (2.9%) |
| 45 to 54 Years | 472 (96.1%) | 19 (3.9%) |
| 55 to 64 Years | 668 (97.4%) | 18 (2.6%) |
| 65 to 74 Years | 312 (100.0%) | 0 (0.0%) |
| 75 Years and older | 239 (100.0%) | 0 (0.0%) |
| Total | 3,286 (98.3%) | 56 (1.7%) |
Health Insurance Coverage by Citizenship Status in Haworth borough
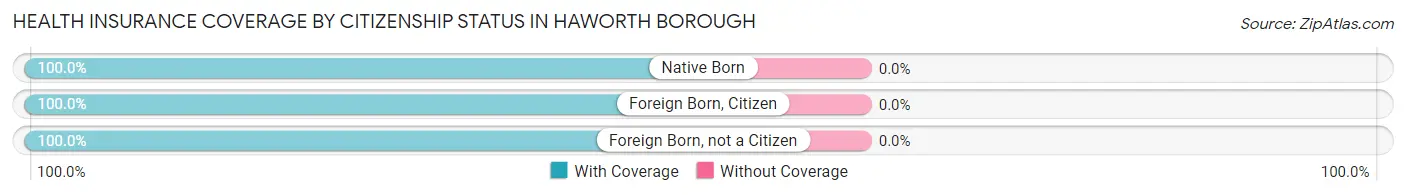
| Citizenship Status | With Coverage | Without Coverage |
| Native Born | 197 (100.0%) | 0 (0.0%) |
| Foreign Born, Citizen | 852 (100.0%) | 0 (0.0%) |
| Foreign Born, not a Citizen | 165 (100.0%) | 0 (0.0%) |
Health Insurance Coverage by Household Income in Haworth borough
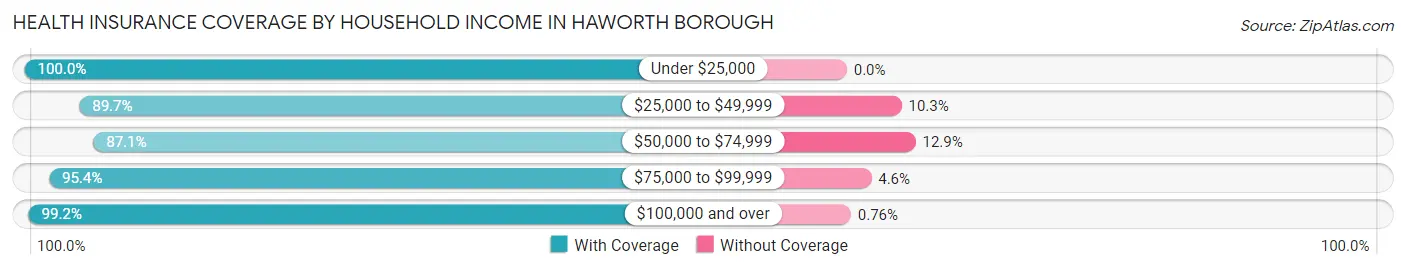
| Household Income | With Coverage | Without Coverage |
| Under $25,000 | 73 (100.0%) | 0 (0.0%) |
| $25,000 to $49,999 | 105 (89.7%) | 12 (10.3%) |
| $50,000 to $74,999 | 115 (87.1%) | 17 (12.9%) |
| $75,000 to $99,999 | 104 (95.4%) | 5 (4.6%) |
| $100,000 and over | 2,882 (99.2%) | 22 (0.8%) |
Public vs Private Health Insurance Coverage by Age in Haworth borough
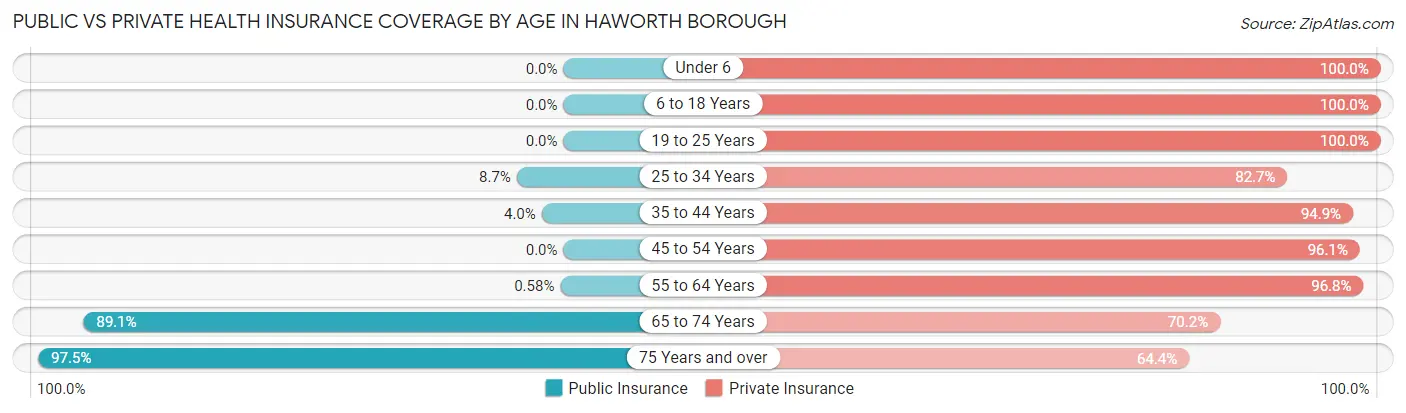
| Age Bracket | Public Insurance | Private Insurance |
| Under 6 | 0 (0.0%) | 197 (100.0%) |
| 6 to 18 Years | 0 (0.0%) | 852 (100.0%) |
| 19 to 25 Years | 0 (0.0%) | 165 (100.0%) |
| 25 to 34 Years | 11 (8.7%) | 105 (82.7%) |
| 35 to 44 Years | 11 (4.0%) | 259 (94.9%) |
| 45 to 54 Years | 0 (0.0%) | 472 (96.1%) |
| 55 to 64 Years | 4 (0.6%) | 664 (96.8%) |
| 65 to 74 Years | 278 (89.1%) | 219 (70.2%) |
| 75 Years and over | 233 (97.5%) | 154 (64.4%) |
| Total | 537 (16.1%) | 3,087 (92.4%) |
Disability Status by Sex by Age in Haworth borough
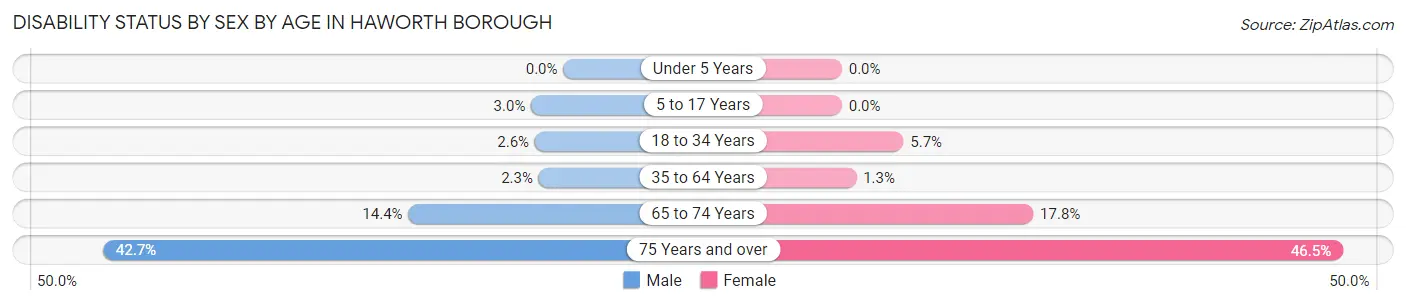
| Age Bracket | Male | Female |
| Under 5 Years | 0 (0.0%) | 0 (0.0%) |
| 5 to 17 Years | 15 (3.0%) | 0 (0.0%) |
| 18 to 34 Years | 6 (2.6%) | 6 (5.7%) |
| 35 to 64 Years | 16 (2.3%) | 10 (1.3%) |
| 65 to 74 Years | 23 (14.4%) | 27 (17.8%) |
| 75 Years and over | 47 (42.7%) | 60 (46.5%) |
Disability Class by Sex by Age in Haworth borough
Disability Class: Hearing Difficulty
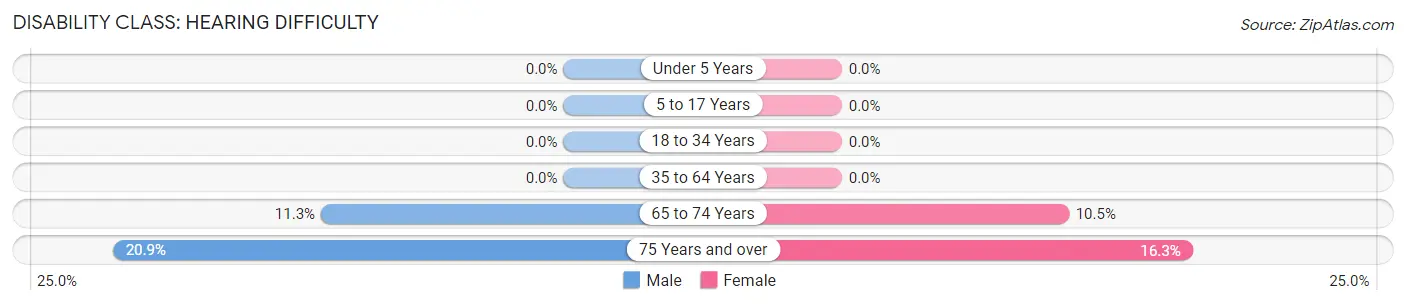
| Age Bracket | Male | Female |
| Under 5 Years | 0 (0.0%) | 0 (0.0%) |
| 5 to 17 Years | 0 (0.0%) | 0 (0.0%) |
| 18 to 34 Years | 0 (0.0%) | 0 (0.0%) |
| 35 to 64 Years | 0 (0.0%) | 0 (0.0%) |
| 65 to 74 Years | 18 (11.3%) | 16 (10.5%) |
| 75 Years and over | 23 (20.9%) | 21 (16.3%) |
Disability Class: Vision Difficulty
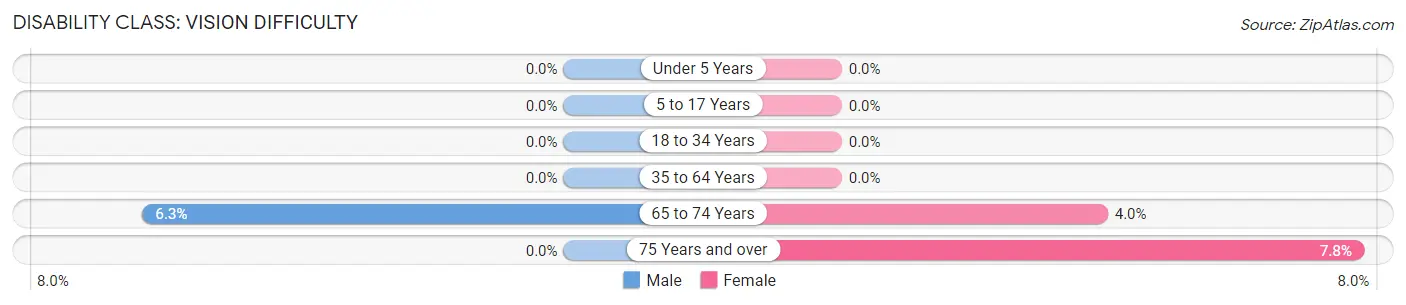
| Age Bracket | Male | Female |
| Under 5 Years | 0 (0.0%) | 0 (0.0%) |
| 5 to 17 Years | 0 (0.0%) | 0 (0.0%) |
| 18 to 34 Years | 0 (0.0%) | 0 (0.0%) |
| 35 to 64 Years | 0 (0.0%) | 0 (0.0%) |
| 65 to 74 Years | 10 (6.2%) | 6 (4.0%) |
| 75 Years and over | 0 (0.0%) | 10 (7.7%) |
Disability Class: Cognitive Difficulty
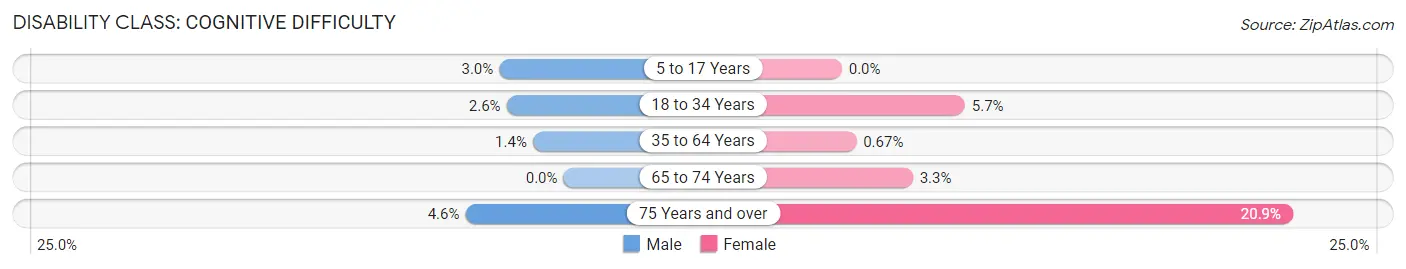
| Age Bracket | Male | Female |
| 5 to 17 Years | 15 (3.0%) | 0 (0.0%) |
| 18 to 34 Years | 6 (2.6%) | 6 (5.7%) |
| 35 to 64 Years | 10 (1.4%) | 5 (0.7%) |
| 65 to 74 Years | 0 (0.0%) | 5 (3.3%) |
| 75 Years and over | 5 (4.5%) | 27 (20.9%) |
Disability Class: Ambulatory Difficulty
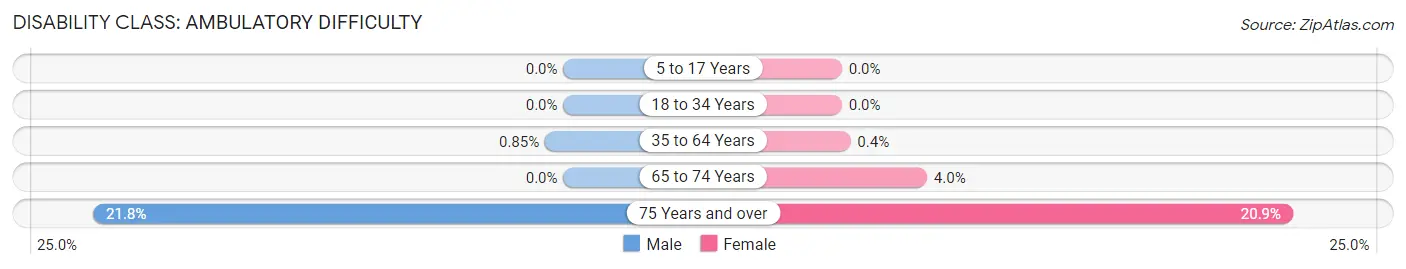
| Age Bracket | Male | Female |
| 5 to 17 Years | 0 (0.0%) | 0 (0.0%) |
| 18 to 34 Years | 0 (0.0%) | 0 (0.0%) |
| 35 to 64 Years | 6 (0.9%) | 3 (0.4%) |
| 65 to 74 Years | 0 (0.0%) | 6 (4.0%) |
| 75 Years and over | 24 (21.8%) | 27 (20.9%) |
Disability Class: Self-Care Difficulty
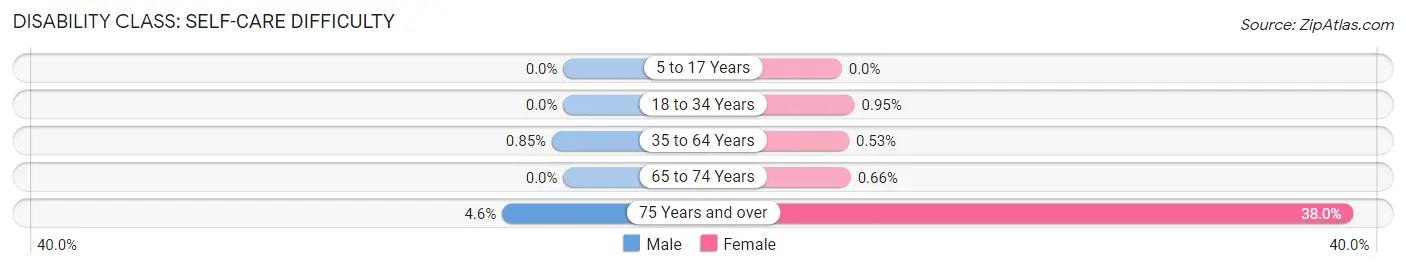
| Age Bracket | Male | Female |
| 5 to 17 Years | 0 (0.0%) | 0 (0.0%) |
| 18 to 34 Years | 0 (0.0%) | 1 (0.9%) |
| 35 to 64 Years | 6 (0.9%) | 4 (0.5%) |
| 65 to 74 Years | 0 (0.0%) | 1 (0.7%) |
| 75 Years and over | 5 (4.5%) | 49 (38.0%) |
Technology Access in Haworth borough
Computing Device Access in Haworth borough
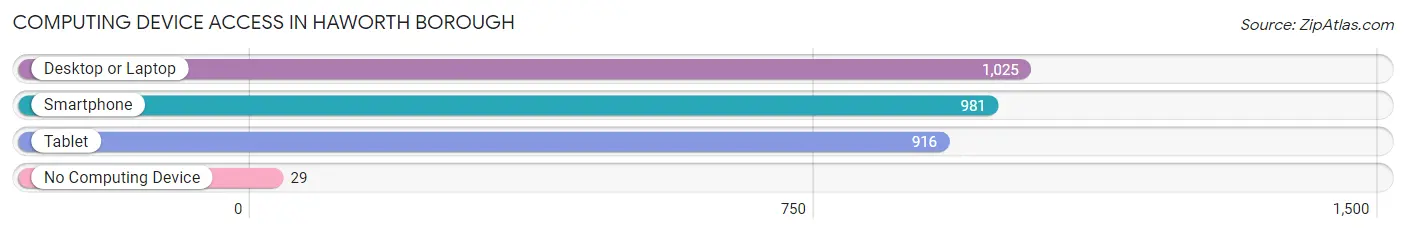
| Device Type | # Households | % Households |
| Desktop or Laptop | 1,025 | 95.9% |
| Smartphone | 981 | 91.8% |
| Tablet | 916 | 85.7% |
| No Computing Device | 29 | 2.7% |
| Total | 1,069 | 100.0% |
Internet Access in Haworth borough
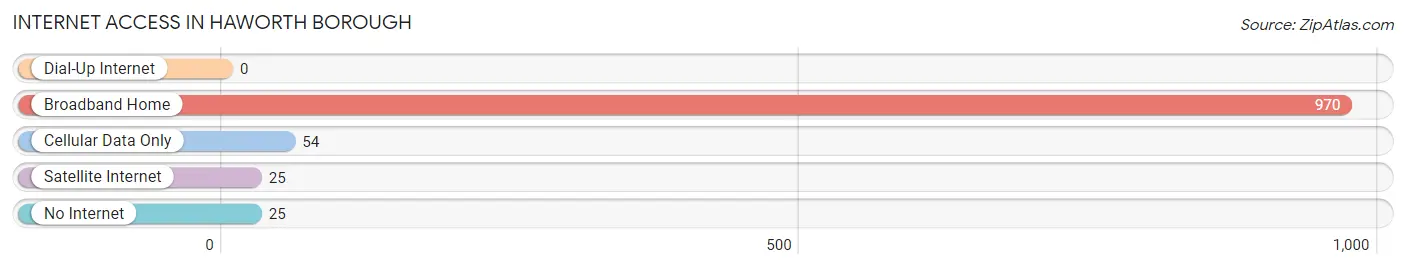
| Internet Type | # Households | % Households |
| Dial-Up Internet | 0 | 0.0% |
| Broadband Home | 970 | 90.7% |
| Cellular Data Only | 54 | 5.1% |
| Satellite Internet | 25 | 2.3% |
| No Internet | 25 | 2.3% |
| Total | 1,069 | 100.0% |
Haworth borough Summary
Haworth Borough is a small borough located in Bergen County, New Jersey. It is situated in the northern part of the state, just south of the New York border. The borough is home to a population of approximately 3,000 people, and is part of the larger New York metropolitan area.
Geography
Haworth Borough is located in the northern part of Bergen County, New Jersey. It is situated in the Hackensack River Valley, and is bordered by the towns of Closter, Demarest, and Harrington Park. The borough is approximately 4.5 square miles in size, and is located at an elevation of approximately 200 feet above sea level. The borough is located in the humid subtropical climate zone, and experiences hot, humid summers and cold, wet winters.
The borough is home to a variety of natural features, including the Hackensack River, which forms the western border of the borough. The river is a popular destination for fishing, boating, and other recreational activities. The borough is also home to several parks, including the Haworth Nature Preserve, which is a popular destination for bird watching and other outdoor activities.
Economy
The economy of Haworth Borough is largely based on the service industry. The borough is home to a variety of restaurants, retail stores, and other businesses that serve the local community. The borough is also home to a number of corporate offices, including those of the pharmaceutical company Merck & Co. and the financial services firm UBS.
Demographics
As of the 2010 census, the population of Haworth Borough was 3,072. The population is predominantly white, with approximately 85% of the population identifying as white. The remaining 15% of the population is made up of African Americans, Asians, and other ethnicities. The median household income in the borough is $107,000, and the median home value is $735,000.
The borough is home to a variety of religious institutions, including several churches and a synagogue. The borough is also home to a variety of public and private schools, including the Haworth Public School District, which serves students in grades K-8.
Conclusion
Haworth Borough is a small borough located in Bergen County, New Jersey. It is situated in the northern part of the state, just south of the New York border. The borough is home to a population of approximately 3,000 people, and is part of the larger New York metropolitan area. The economy of the borough is largely based on the service industry, and the population is predominantly white. The borough is home to a variety of religious institutions, public and private schools, and parks.
Common Questions
What is Per Capita Income in Haworth borough?
Per Capita income in Haworth borough is $80,677.
What is the Median Family Income in Haworth borough?
Median Family Income in Haworth borough is $227,661.
What is the Median Household income in Haworth borough?
Median Household Income in Haworth borough is $215,972.
What is Income or Wage Gap in Haworth borough?
Income or Wage Gap in Haworth borough is 47.4%.
Women in Haworth borough earn 52.6 cents for every dollar earned by a man.
What is Inequality or Gini Index in Haworth borough?
Inequality or Gini Index in Haworth borough is 0.38.
What is the Total Population of Haworth borough?
Total Population of Haworth borough is 3,342.
What is the Total Male Population of Haworth borough?
Total Male Population of Haworth borough is 1,784.
What is the Total Female Population of Haworth borough?
Total Female Population of Haworth borough is 1,558.
What is the Ratio of Males per 100 Females in Haworth borough?
There are 114.51 Males per 100 Females in Haworth borough.
What is the Ratio of Females per 100 Males in Haworth borough?
There are 87.33 Females per 100 Males in Haworth borough.
What is the Median Population Age in Haworth borough?
Median Population Age in Haworth borough is 46.5 Years.
What is the Average Family Size in Haworth borough
Average Family Size in Haworth borough is 3.3 People.
What is the Average Household Size in Haworth borough
Average Household Size in Haworth borough is 3.1 People.
How Large is the Labor Force in Haworth borough?
There are 1,646 People in the Labor Forcein in Haworth borough.
What is the Percentage of People in the Labor Force in Haworth borough?
65.9% of People are in the Labor Force in Haworth borough.
What is the Unemployment Rate in Haworth borough?
Unemployment Rate in Haworth borough is 3.4%.