Allenwood, NJ Map & Demographics
Allenwood Map
Allenwood Overview
$59,249
PER CAPITA INCOME
$207,750
AVG FAMILY INCOME
$153,750
AVG HOUSEHOLD INCOME
69.5%
WAGE / INCOME GAP [ % ]
30.5¢/ $1
WAGE / INCOME GAP [ $ ]
0.42
INEQUALITY / GINI INDEX
623
TOTAL POPULATION
270
MALE POPULATION
353
FEMALE POPULATION
76.49
MALES / 100 FEMALES
130.74
FEMALES / 100 MALES
45.9
MEDIAN AGE
3.3
AVG FAMILY SIZE
2.5
AVG HOUSEHOLD SIZE
412
LABOR FORCE [ PEOPLE ]
76.3%
PERCENT IN LABOR FORCE
6.3%
UNEMPLOYMENT RATE
Allenwood Zip Codes
Income in Allenwood
Income Overview in Allenwood
Per Capita Income in Allenwood is $59,249, while median incomes of families and households are $207,750 and $153,750 respectively.
| Characteristic | Number | Measure |
| Per Capita Income | 623 | $59,249 |
| Median Family Income | 165 | $207,750 |
| Mean Family Income | 165 | $208,264 |
| Median Household Income | 246 | $153,750 |
| Mean Household Income | 246 | $148,143 |
| Income Deficit | 165 | $0 |
| Wage / Income Gap (%) | 623 | 69.53% |
| Wage / Income Gap ($) | 623 | 30.47¢ per $1 |
| Gini / Inequality Index | 623 | 0.42 |
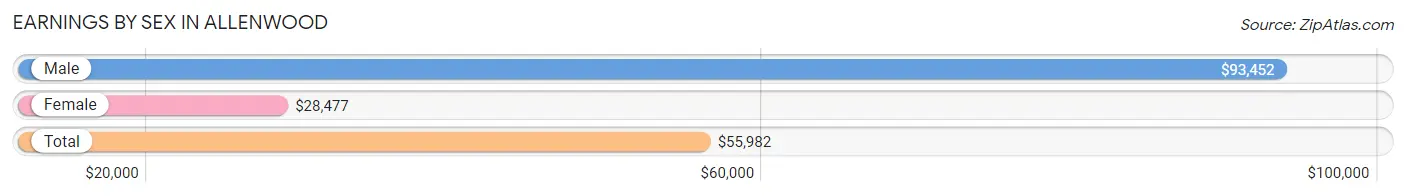
Earnings by Sex in Allenwood
Average Earnings in Allenwood are $55,982, $93,452 for men and $28,477 for women, a difference of 69.5%.
| Sex | Number | Average Earnings |
| Male | 226 (52.2%) | $93,452 |
| Female | 207 (47.8%) | $28,477 |
| Total | 433 (100.0%) | $55,982 |
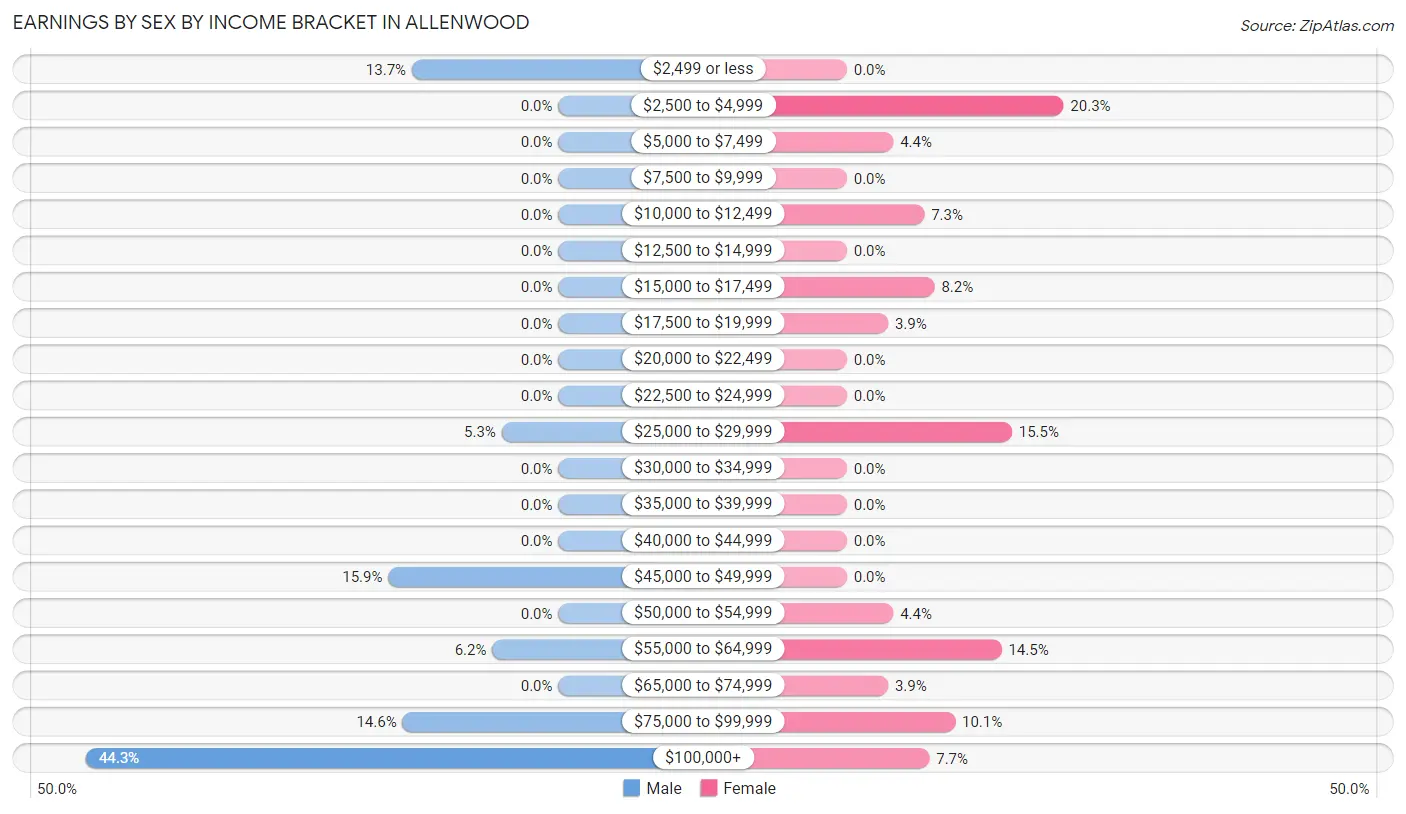
Earnings by Sex by Income Bracket in Allenwood
The most common earnings brackets in Allenwood are $100,000+ for men (100 | 44.3%) and $2,500 to $4,999 for women (42 | 20.3%).
| Income | Male | Female |
| $2,499 or less | 31 (13.7%) | 0 (0.0%) |
| $2,500 to $4,999 | 0 (0.0%) | 42 (20.3%) |
| $5,000 to $7,499 | 0 (0.0%) | 9 (4.3%) |
| $7,500 to $9,999 | 0 (0.0%) | 0 (0.0%) |
| $10,000 to $12,499 | 0 (0.0%) | 15 (7.2%) |
| $12,500 to $14,999 | 0 (0.0%) | 0 (0.0%) |
| $15,000 to $17,499 | 0 (0.0%) | 17 (8.2%) |
| $17,500 to $19,999 | 0 (0.0%) | 8 (3.9%) |
| $20,000 to $22,499 | 0 (0.0%) | 0 (0.0%) |
| $22,500 to $24,999 | 0 (0.0%) | 0 (0.0%) |
| $25,000 to $29,999 | 12 (5.3%) | 32 (15.5%) |
| $30,000 to $34,999 | 0 (0.0%) | 0 (0.0%) |
| $35,000 to $39,999 | 0 (0.0%) | 0 (0.0%) |
| $40,000 to $44,999 | 0 (0.0%) | 0 (0.0%) |
| $45,000 to $49,999 | 36 (15.9%) | 0 (0.0%) |
| $50,000 to $54,999 | 0 (0.0%) | 9 (4.3%) |
| $55,000 to $64,999 | 14 (6.2%) | 30 (14.5%) |
| $65,000 to $74,999 | 0 (0.0%) | 8 (3.9%) |
| $75,000 to $99,999 | 33 (14.6%) | 21 (10.1%) |
| $100,000+ | 100 (44.3%) | 16 (7.7%) |
| Total | 226 (100.0%) | 207 (100.0%) |
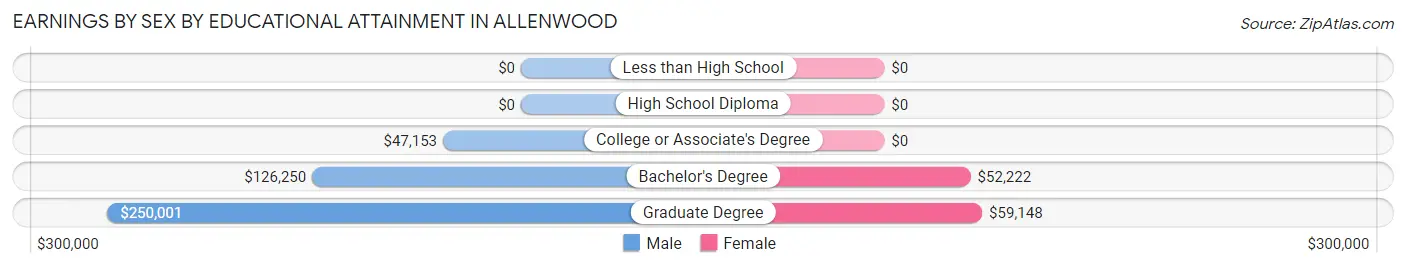
Earnings by Sex by Educational Attainment in Allenwood
Average earnings in Allenwood are $108,424 for men and $50,694 for women, a difference of 53.2%. Men with an educational attainment of graduate degree enjoy the highest average annual earnings of $250,001, while those with college or associate's degree education earn the least with $47,153. Women with an educational attainment of graduate degree earn the most with the average annual earnings of $59,148, while those with bachelor's degree education have the smallest earnings of $52,222.
| Educational Attainment | Male Income | Female Income |
| Less than High School | - | - |
| High School Diploma | - | - |
| College or Associate's Degree | $47,153 | $0 |
| Bachelor's Degree | $126,250 | $52,222 |
| Graduate Degree | $250,001 | $59,148 |
| Total | $108,424 | $50,694 |
Family Income in Allenwood
Family Income Brackets in Allenwood
According to the Allenwood family income data, there are 83 families falling into the $200,000+ income range, which is the most common income bracket and makes up 50.3% of all families.
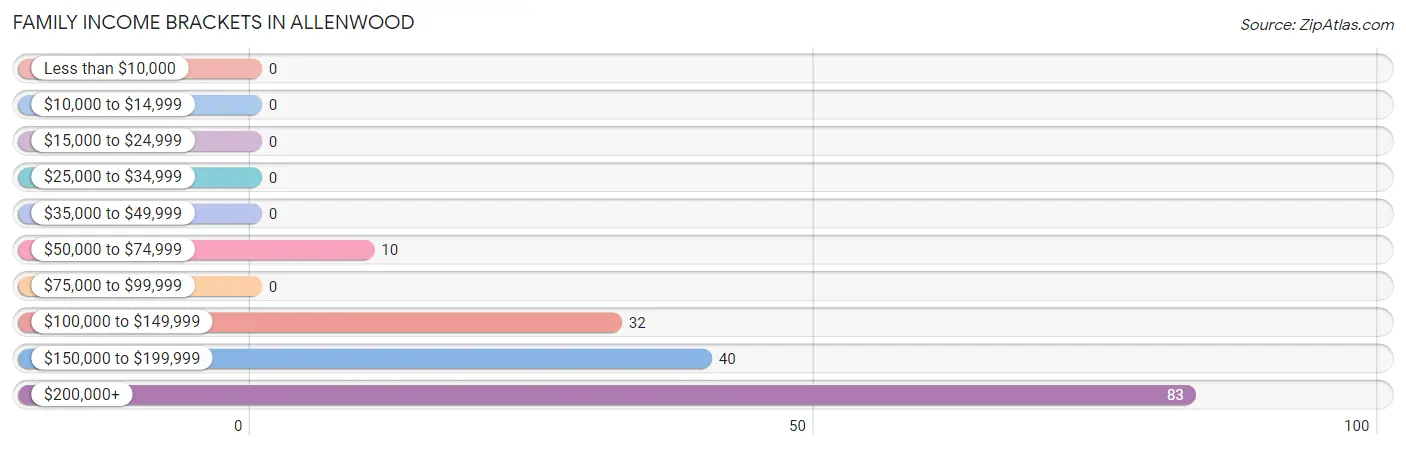
| Income Bracket | # Families | % Families |
| Less than $10,000 | 0 | 0.0% |
| $10,000 to $14,999 | 0 | 0.0% |
| $15,000 to $24,999 | 0 | 0.0% |
| $25,000 to $34,999 | 0 | 0.0% |
| $35,000 to $49,999 | 0 | 0.0% |
| $50,000 to $74,999 | 10 | 6.1% |
| $75,000 to $99,999 | 0 | 0.0% |
| $100,000 to $149,999 | 32 | 19.4% |
| $150,000 to $199,999 | 40 | 24.2% |
| $200,000+ | 83 | 50.3% |
Family Income by Famaliy Size in Allenwood
4-person families (48 | 29.1%) account for the highest median family income in Allenwood with $222,778 per family, while 2-person families (68 | 41.2%) have the highest median income of $84,432 per family member.
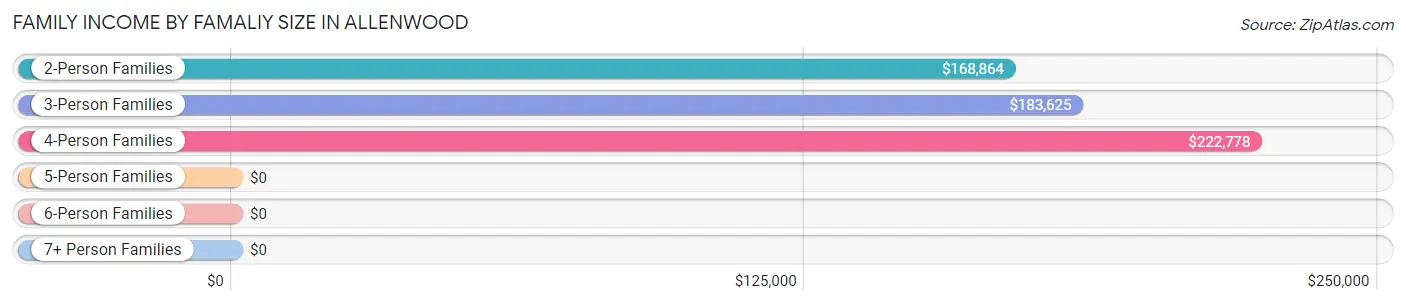
| Income Bracket | # Families | Median Income |
| 2-Person Families | 68 (41.2%) | $168,864 |
| 3-Person Families | 29 (17.6%) | $183,625 |
| 4-Person Families | 48 (29.1%) | $222,778 |
| 5-Person Families | 20 (12.1%) | $0 |
| 6-Person Families | 0 (0.0%) | $0 |
| 7+ Person Families | 0 (0.0%) | $0 |
| Total | 165 (100.0%) | $207,750 |
Family Income by Number of Earners in Allenwood
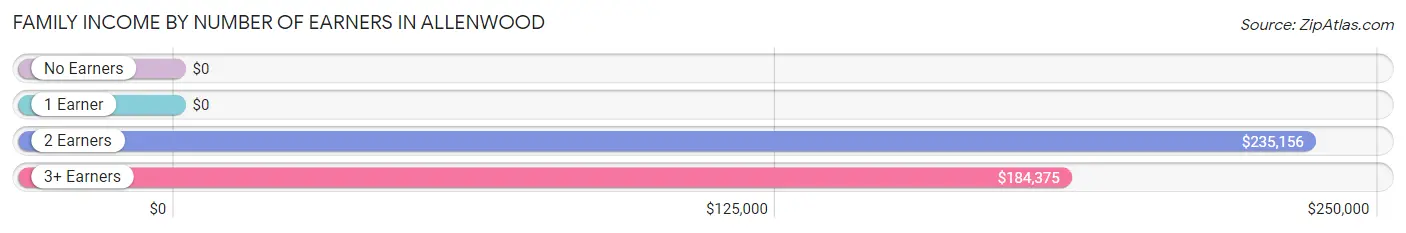
| Number of Earners | # Families | Median Income |
| No Earners | 0 (0.0%) | $0 |
| 1 Earner | 33 (20.0%) | $0 |
| 2 Earners | 81 (49.1%) | $235,156 |
| 3+ Earners | 51 (30.9%) | $184,375 |
| Total | 165 (100.0%) | $207,750 |
Household Income in Allenwood
Household Income Brackets in Allenwood
With 83 households falling in the category, the $200,000+ income range is the most frequent in Allenwood, accounting for 33.7% of all households.
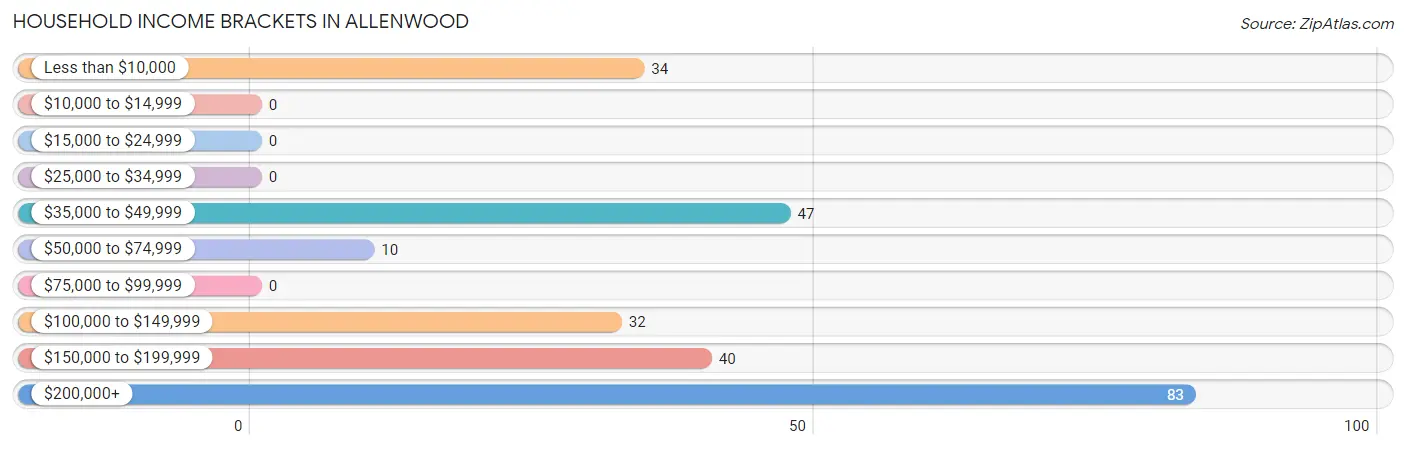
| Income Bracket | # Households | % Households |
| Less than $10,000 | 34 | 13.8% |
| $10,000 to $14,999 | 0 | 0.0% |
| $15,000 to $24,999 | 0 | 0.0% |
| $25,000 to $34,999 | 0 | 0.0% |
| $35,000 to $49,999 | 47 | 19.1% |
| $50,000 to $74,999 | 10 | 4.1% |
| $75,000 to $99,999 | 0 | 0.0% |
| $100,000 to $149,999 | 32 | 13.0% |
| $150,000 to $199,999 | 40 | 16.3% |
| $200,000+ | 83 | 33.7% |
Household Income by Householder Age in Allenwood
The median household income in Allenwood is $153,750, with the highest median household income of $230,536 found in the 45 to 64 years age bracket for the primary householder. A total of 95 households (38.6%) fall into this category.
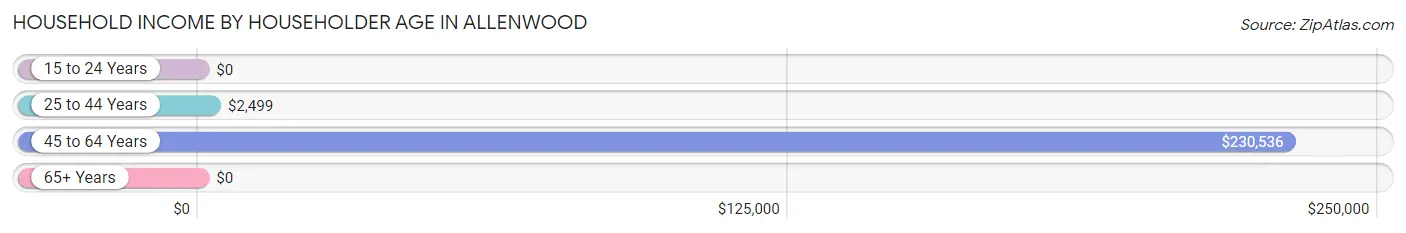
| Income Bracket | # Households | Median Income |
| 15 to 24 Years | 0 (0.0%) | $0 |
| 25 to 44 Years | 54 (22.0%) | $2,499 |
| 45 to 64 Years | 95 (38.6%) | $230,536 |
| 65+ Years | 97 (39.4%) | $0 |
| Total | 246 (100.0%) | $153,750 |
Poverty in Allenwood
Income Below Poverty by Sex and Age in Allenwood
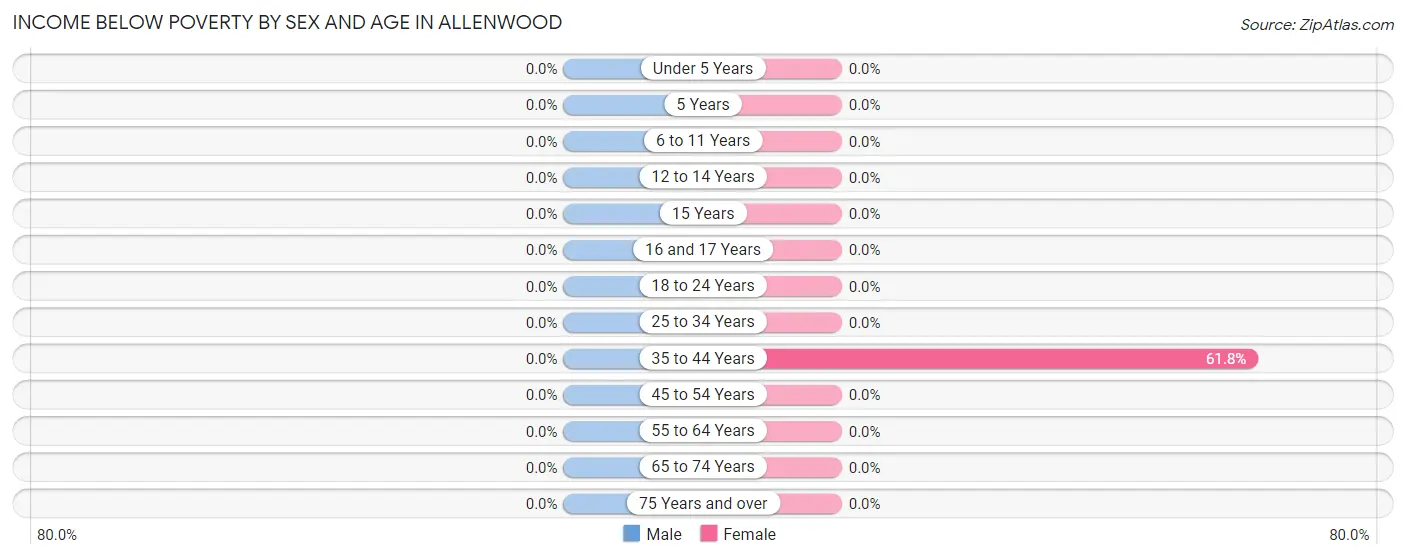
| Age Bracket | Male | Female |
| Under 5 Years | 0 (0.0%) | 0 (0.0%) |
| 5 Years | 0 (0.0%) | 0 (0.0%) |
| 6 to 11 Years | 0 (0.0%) | 0 (0.0%) |
| 12 to 14 Years | 0 (0.0%) | 0 (0.0%) |
| 15 Years | 0 (0.0%) | 0 (0.0%) |
| 16 and 17 Years | 0 (0.0%) | 0 (0.0%) |
| 18 to 24 Years | 0 (0.0%) | 0 (0.0%) |
| 25 to 34 Years | 0 (0.0%) | 0 (0.0%) |
| 35 to 44 Years | 0 (0.0%) | 34 (61.8%) |
| 45 to 54 Years | 0 (0.0%) | 0 (0.0%) |
| 55 to 64 Years | 0 (0.0%) | 0 (0.0%) |
| 65 to 74 Years | 0 (0.0%) | 0 (0.0%) |
| 75 Years and over | 0 (0.0%) | 0 (0.0%) |
| Total | 0 (0.0%) | 34 (9.6%) |
Income Above Poverty by Sex and Age in Allenwood
According to the poverty statistics in Allenwood, males aged under 5 years and females aged under 5 years are the age groups that are most secure financially, with 100.0% of males and 100.0% of females in these age groups living above the poverty line.
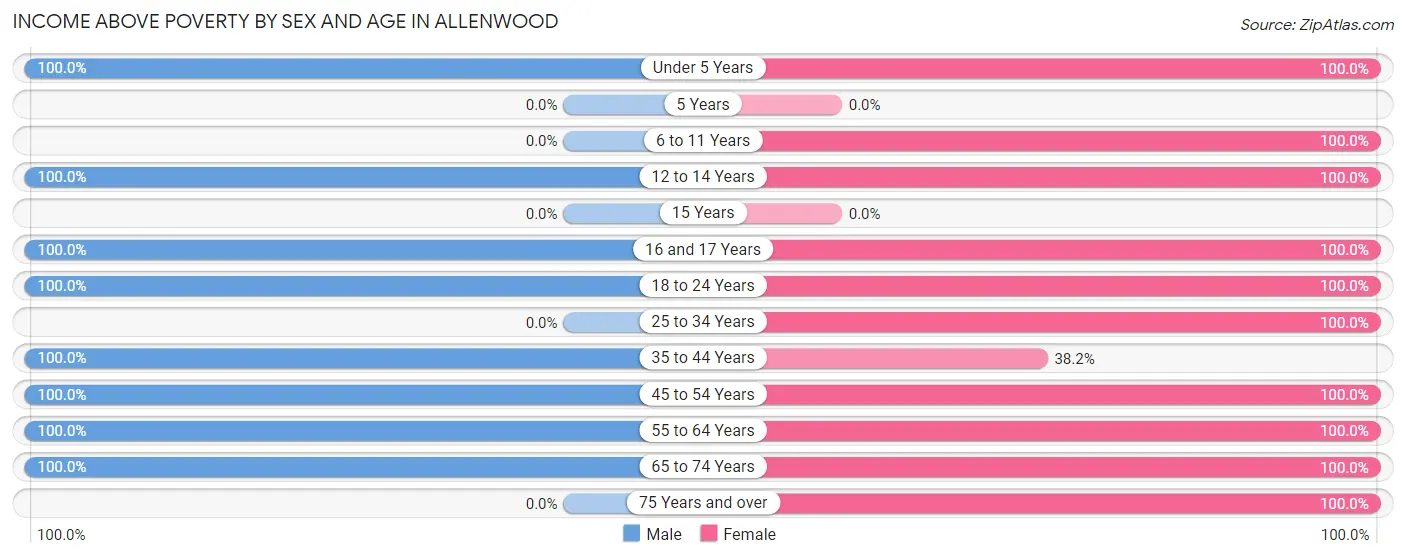
| Age Bracket | Male | Female |
| Under 5 Years | 9 (100.0%) | 12 (100.0%) |
| 5 Years | 0 (0.0%) | 0 (0.0%) |
| 6 to 11 Years | 0 (0.0%) | 20 (100.0%) |
| 12 to 14 Years | 26 (100.0%) | 16 (100.0%) |
| 15 Years | 0 (0.0%) | 0 (0.0%) |
| 16 and 17 Years | 16 (100.0%) | 16 (100.0%) |
| 18 to 24 Years | 36 (100.0%) | 50 (100.0%) |
| 25 to 34 Years | 0 (0.0%) | 28 (100.0%) |
| 35 to 44 Years | 20 (100.0%) | 21 (38.2%) |
| 45 to 54 Years | 71 (100.0%) | 82 (100.0%) |
| 55 to 64 Years | 15 (100.0%) | 31 (100.0%) |
| 65 to 74 Years | 77 (100.0%) | 22 (100.0%) |
| 75 Years and over | 0 (0.0%) | 21 (100.0%) |
| Total | 270 (100.0%) | 319 (90.4%) |
Income Below Poverty Among Married-Couple Families in Allenwood
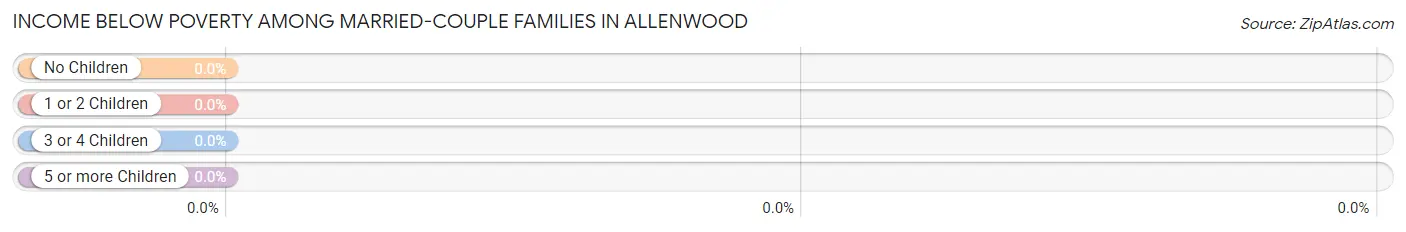
| Children | Above Poverty | Below Poverty |
| No Children | 90 (100.0%) | 0 (0.0%) |
| 1 or 2 Children | 25 (100.0%) | 0 (0.0%) |
| 3 or 4 Children | 20 (100.0%) | 0 (0.0%) |
| 5 or more Children | 0 (0.0%) | 0 (0.0%) |
| Total | 135 (100.0%) | 0 (0.0%) |
Income Below Poverty Among Single-Parent Households in Allenwood
| Children | Single Father | Single Mother |
| No Children | 0 (0.0%) | 0 (0.0%) |
| 1 or 2 Children | 0 (0.0%) | 0 (0.0%) |
| 3 or 4 Children | 0 (0.0%) | 0 (0.0%) |
| 5 or more Children | 0 (0.0%) | 0 (0.0%) |
| Total | 0 (0.0%) | 0 (0.0%) |
Income Below Poverty Among Married-Couple vs Single-Parent Households in Allenwood
| Children | Married-Couple Families | Single-Parent Households |
| No Children | 0 (0.0%) | 0 (0.0%) |
| 1 or 2 Children | 0 (0.0%) | 0 (0.0%) |
| 3 or 4 Children | 0 (0.0%) | 0 (0.0%) |
| 5 or more Children | 0 (0.0%) | 0 (0.0%) |
| Total | 0 (0.0%) | 0 (0.0%) |
Race in Allenwood
The most populous races in Allenwood are White / Caucasian (591 | 94.9%), Two or more Races (21 | 3.4%), and Asian (11 | 1.8%).
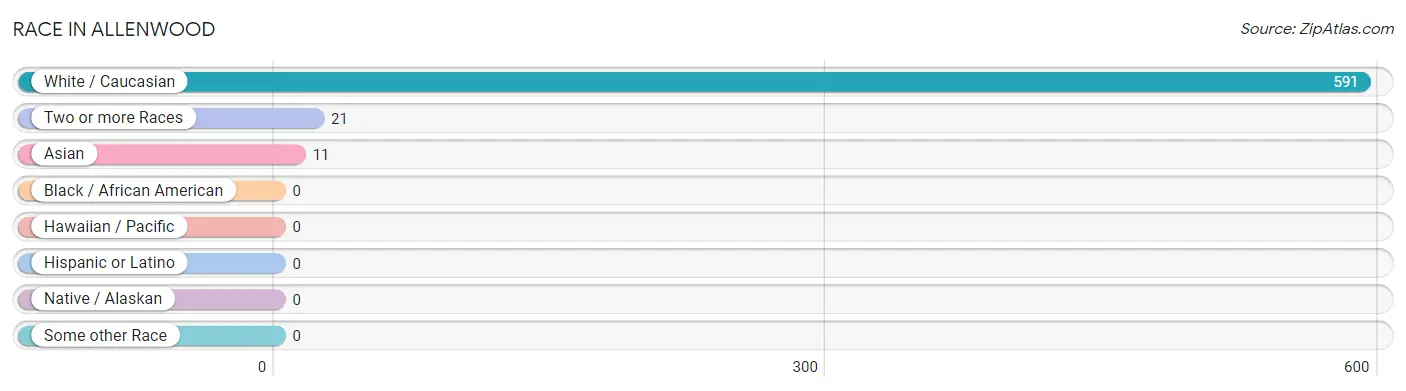
| Race | # Population | % Population |
| Asian | 11 | 1.8% |
| Black / African American | 0 | 0.0% |
| Hawaiian / Pacific | 0 | 0.0% |
| Hispanic or Latino | 0 | 0.0% |
| Native / Alaskan | 0 | 0.0% |
| White / Caucasian | 591 | 94.9% |
| Two or more Races | 21 | 3.4% |
| Some other Race | 0 | 0.0% |
| Total | 623 | 100.0% |
Ancestry in Allenwood
The most populous ancestries reported in Allenwood are Italian (146 | 23.4%), Irish (138 | 22.2%), English (89 | 14.3%), American (65 | 10.4%), and Polish (48 | 7.7%), together accounting for 78.0% of all Allenwood residents.
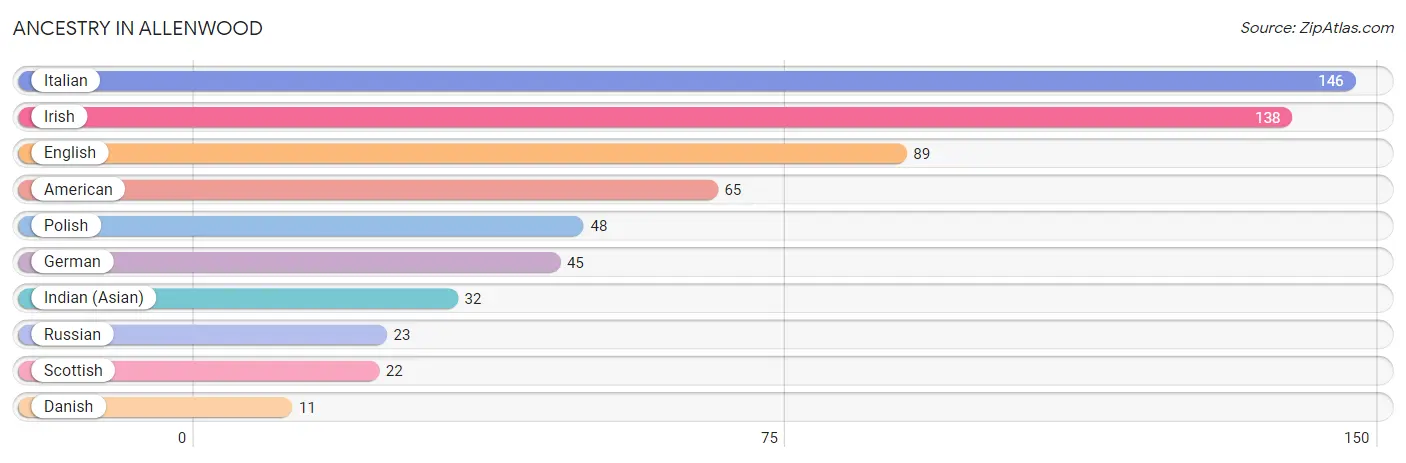
| Ancestry | # Population | % Population |
| American | 65 | 10.4% |
| Danish | 11 | 1.8% |
| English | 89 | 14.3% |
| German | 45 | 7.2% |
| Indian (Asian) | 32 | 5.1% |
| Irish | 138 | 22.2% |
| Italian | 146 | 23.4% |
| Polish | 48 | 7.7% |
| Russian | 23 | 3.7% |
| Scottish | 22 | 3.5% | View All 10 Rows |
Immigrants in Allenwood
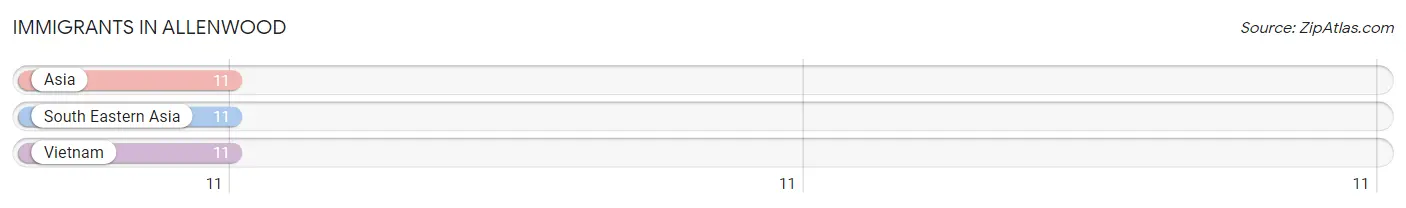
The most numerous immigrant groups reported in Allenwood came from Asia (11 | 1.8%), South Eastern Asia (11 | 1.8%), and Vietnam (11 | 1.8%), together accounting for 5.3% of all Allenwood residents.
| Immigration Origin | # Population | % Population |
| Asia | 11 | 1.8% |
| South Eastern Asia | 11 | 1.8% |
| Vietnam | 11 | 1.8% | View All 3 Rows |
Sex and Age in Allenwood
Sex and Age in Allenwood
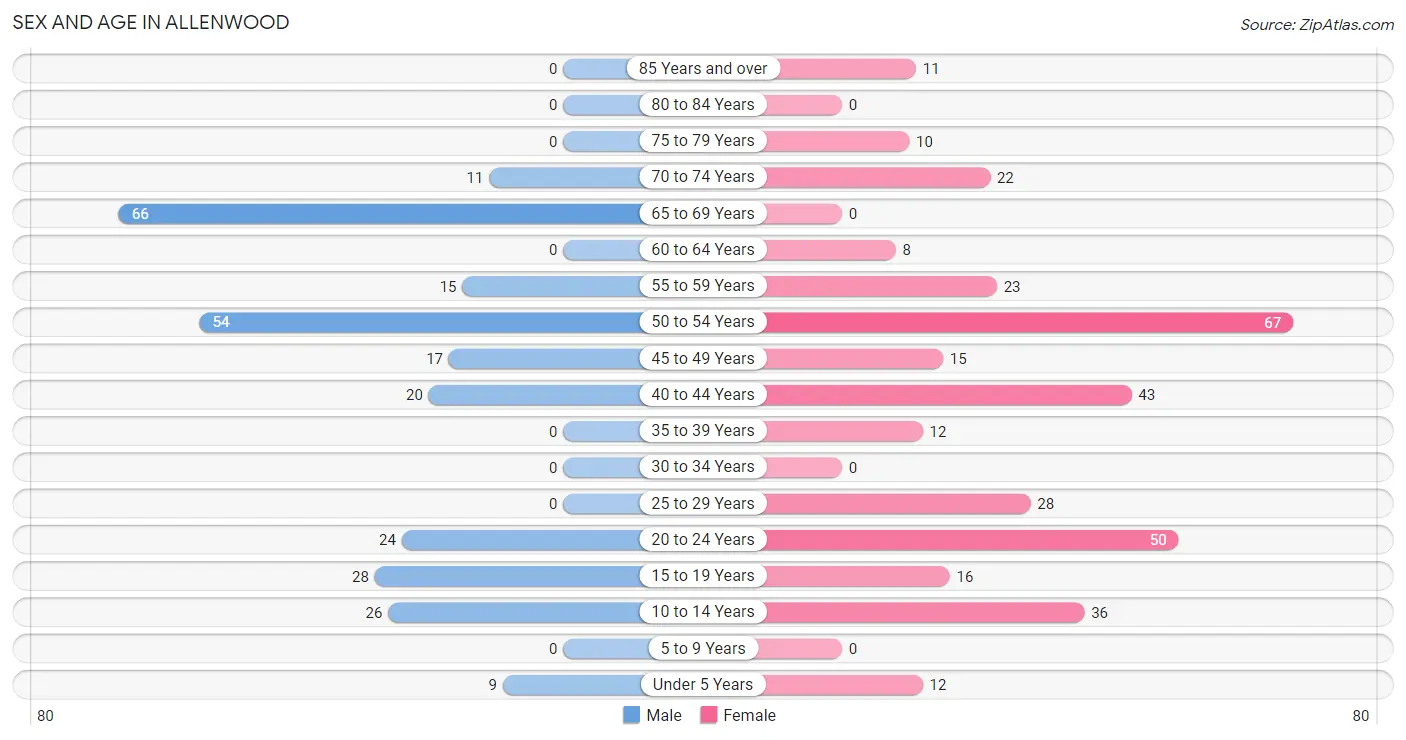
The most populous age groups in Allenwood are 65 to 69 Years (66 | 24.4%) for men and 50 to 54 Years (67 | 19.0%) for women.
| Age Bracket | Male | Female |
| Under 5 Years | 9 (3.3%) | 12 (3.4%) |
| 5 to 9 Years | 0 (0.0%) | 0 (0.0%) |
| 10 to 14 Years | 26 (9.6%) | 36 (10.2%) |
| 15 to 19 Years | 28 (10.4%) | 16 (4.5%) |
| 20 to 24 Years | 24 (8.9%) | 50 (14.2%) |
| 25 to 29 Years | 0 (0.0%) | 28 (7.9%) |
| 30 to 34 Years | 0 (0.0%) | 0 (0.0%) |
| 35 to 39 Years | 0 (0.0%) | 12 (3.4%) |
| 40 to 44 Years | 20 (7.4%) | 43 (12.2%) |
| 45 to 49 Years | 17 (6.3%) | 15 (4.3%) |
| 50 to 54 Years | 54 (20.0%) | 67 (19.0%) |
| 55 to 59 Years | 15 (5.6%) | 23 (6.5%) |
| 60 to 64 Years | 0 (0.0%) | 8 (2.3%) |
| 65 to 69 Years | 66 (24.4%) | 0 (0.0%) |
| 70 to 74 Years | 11 (4.1%) | 22 (6.2%) |
| 75 to 79 Years | 0 (0.0%) | 10 (2.8%) |
| 80 to 84 Years | 0 (0.0%) | 0 (0.0%) |
| 85 Years and over | 0 (0.0%) | 11 (3.1%) |
| Total | 270 (100.0%) | 353 (100.0%) |
Families and Households in Allenwood
Median Family Size in Allenwood
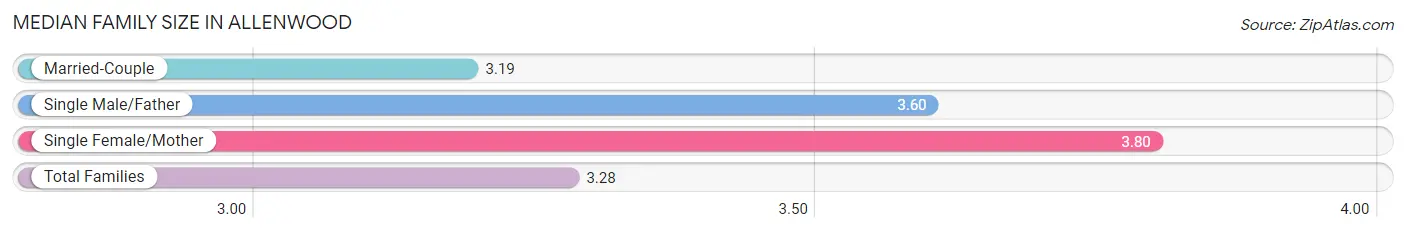
The median family size in Allenwood is 3.28 persons per family, with single female/mother families (20 | 12.1%) accounting for the largest median family size of 3.8 persons per family. On the other hand, married-couple families (135 | 81.8%) represent the smallest median family size with 3.19 persons per family.
| Family Type | # Families | Family Size |
| Married-Couple | 135 (81.8%) | 3.19 |
| Single Male/Father | 10 (6.1%) | 3.60 |
| Single Female/Mother | 20 (12.1%) | 3.80 |
| Total Families | 165 (100.0%) | 3.28 |
Median Household Size in Allenwood
| Household Type | # Households | Household Size |
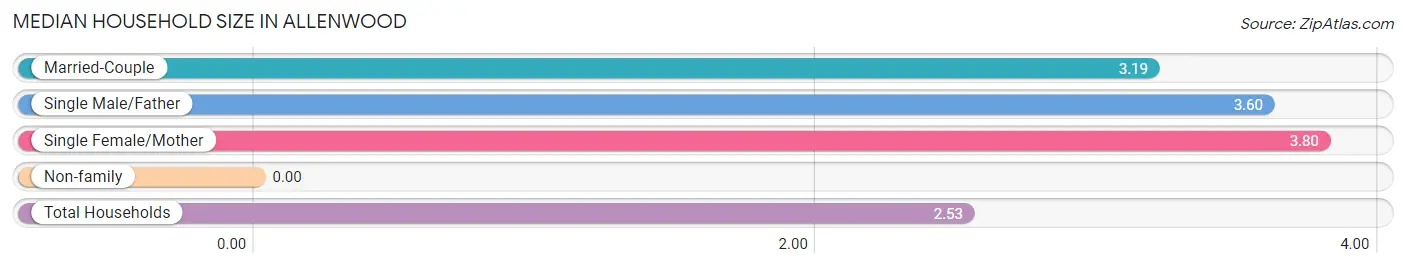
| Married-Couple | 135 (54.9%) | 3.19 |
| Single Male/Father | 10 (4.1%) | 3.60 |
| Single Female/Mother | 20 (8.1%) | 3.80 |
| Non-family | 81 (32.9%) | - |
| Total Households | 246 (100.0%) | 2.53 |
Household Size by Marriage Status in Allenwood
Out of a total of 246 households in Allenwood, 165 (67.1%) are family households, while 81 (32.9%) are nonfamily households. The most numerous type of family households are 2-person households, comprising 68, and the most common type of nonfamily households are 1-person households, comprising 81.
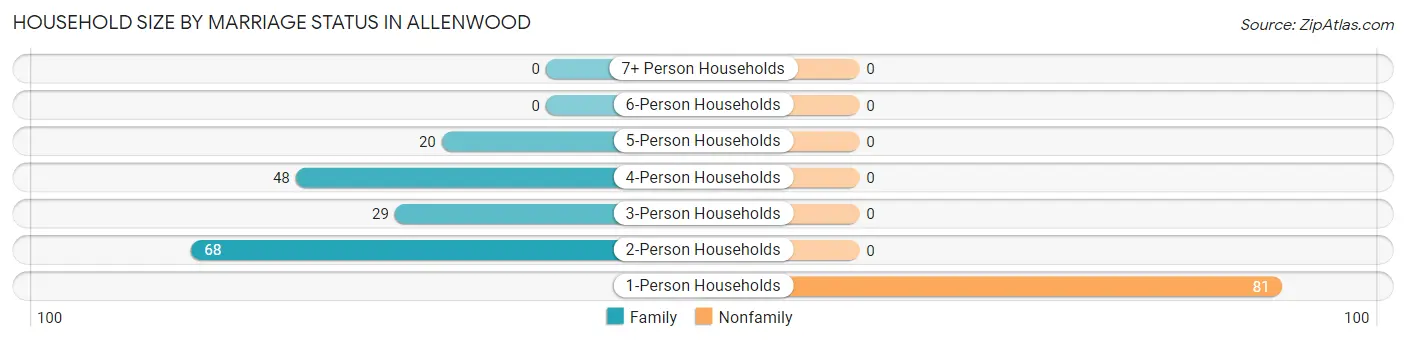
| Household Size | Family Households | Nonfamily Households |
| 1-Person Households | - | 81 (32.9%) |
| 2-Person Households | 68 (27.6%) | 0 (0.0%) |
| 3-Person Households | 29 (11.8%) | 0 (0.0%) |
| 4-Person Households | 48 (19.5%) | 0 (0.0%) |
| 5-Person Households | 20 (8.1%) | 0 (0.0%) |
| 6-Person Households | 0 (0.0%) | 0 (0.0%) |
| 7+ Person Households | 0 (0.0%) | 0 (0.0%) |
| Total | 165 (67.1%) | 81 (32.9%) |
Female Fertility in Allenwood
Fertility by Age in Allenwood
| Age Bracket | Women with Births | Births / 1,000 Women |
| 15 to 19 years | 0 (0.0%) | 0.0 |
| 20 to 34 years | 0 (0.0%) | 0.0 |
| 35 to 50 years | 0 (0.0%) | 0.0 |
| Total | 0 (0.0%) | 0.0 |
Fertility by Age by Marriage Status in Allenwood
| Age Bracket | Married | Unmarried |
| 15 to 19 years | 0 (0.0%) | 0 (0.0%) |
| 20 to 34 years | 0 (0.0%) | 0 (0.0%) |
| 35 to 50 years | 0 (0.0%) | 0 (0.0%) |
| Total | 0 (0.0%) | 0 (0.0%) |
Fertility by Education in Allenwood
| Educational Attainment | Women with Births | Births / 1,000 Women |
| Less than High School | 0 (0.0%) | 0.0 |
| High School Diploma | 0 (0.0%) | 0.0 |
| College or Associate's Degree | 0 (0.0%) | 0.0 |
| Bachelor's Degree | 0 (0.0%) | 0.0 |
| Graduate Degree | 0 (0.0%) | 0.0 |
| Total | 0 (0.0%) | 0.0 |
Fertility by Education by Marriage Status in Allenwood
| Educational Attainment | Married | Unmarried |
| Less than High School | 0 (0.0%) | 0 (0.0%) |
| High School Diploma | 0 (0.0%) | 0 (0.0%) |
| College or Associate's Degree | 0 (0.0%) | 0 (0.0%) |
| Bachelor's Degree | 0 (0.0%) | 0 (0.0%) |
| Graduate Degree | 0 (0.0%) | 0 (0.0%) |
| Total | 0 (0.0%) | 0 (0.0%) |
Employment Characteristics in Allenwood
Employment by Class of Employer in Allenwood
Among the 386 employed individuals in Allenwood, private company employees (200 | 51.8%), not-for-profit organizations (53 | 13.7%), and self-employed (not incorporated) (47 | 12.2%) make up the most common classes of employment.
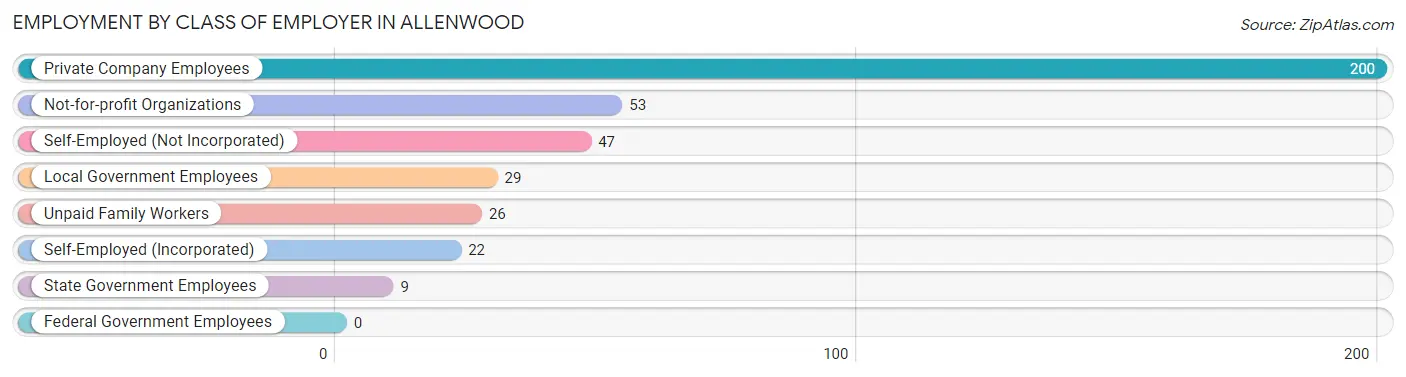
| Employer Class | # Employees | % Employees |
| Private Company Employees | 200 | 51.8% |
| Self-Employed (Incorporated) | 22 | 5.7% |
| Self-Employed (Not Incorporated) | 47 | 12.2% |
| Not-for-profit Organizations | 53 | 13.7% |
| Local Government Employees | 29 | 7.5% |
| State Government Employees | 9 | 2.3% |
| Federal Government Employees | 0 | 0.0% |
| Unpaid Family Workers | 26 | 6.7% |
| Total | 386 | 100.0% |
Employment Status by Age in Allenwood
According to the labor force statistics for Allenwood, out of the total population over 16 years of age (540), 76.3% or 412 individuals are in the labor force, with 6.3% or 26 of them unemployed. The age group with the highest labor force participation rate is 25 to 29 years, with 100.0% or 28 individuals in the labor force. Within the labor force, the 20 to 24 years age range has the highest percentage of unemployed individuals, with 23.1% or 15 of them being unemployed.
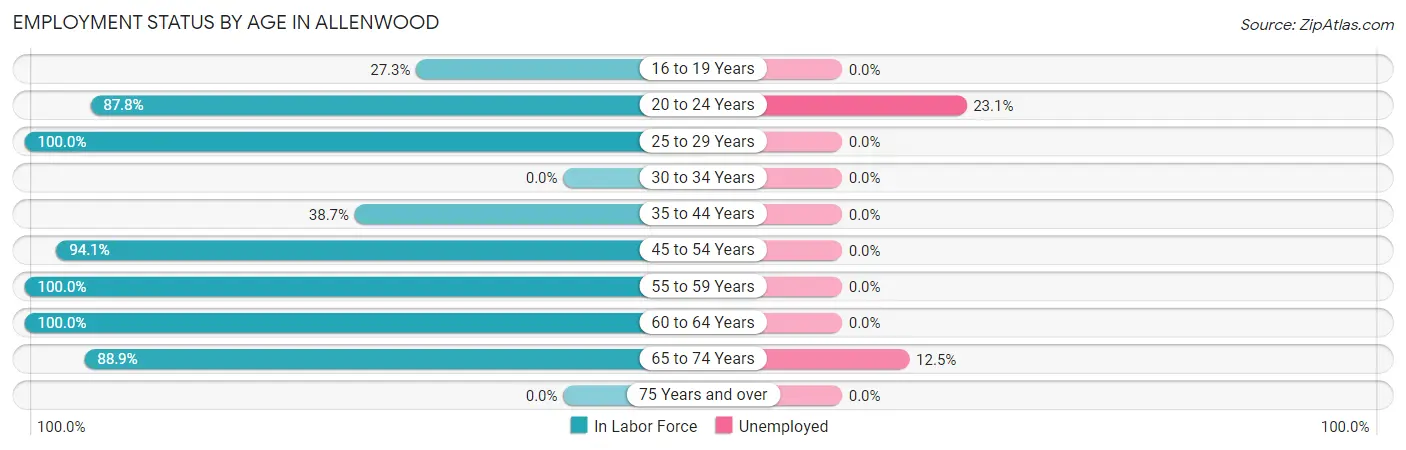
| Age Bracket | In Labor Force | Unemployed |
| 16 to 19 Years | 12 (27.3%) | 0 (0.0%) |
| 20 to 24 Years | 65 (87.8%) | 15 (23.1%) |
| 25 to 29 Years | 28 (100.0%) | 0 (0.0%) |
| 30 to 34 Years | 0 (0.0%) | 0 (0.0%) |
| 35 to 44 Years | 29 (38.7%) | 0 (0.0%) |
| 45 to 54 Years | 144 (94.1%) | 0 (0.0%) |
| 55 to 59 Years | 38 (100.0%) | 0 (0.0%) |
| 60 to 64 Years | 8 (100.0%) | 0 (0.0%) |
| 65 to 74 Years | 88 (88.9%) | 11 (12.5%) |
| 75 Years and over | 0 (0.0%) | 0 (0.0%) |
| Total | 412 (76.3%) | 26 (6.3%) |
Employment Status by Educational Attainment in Allenwood
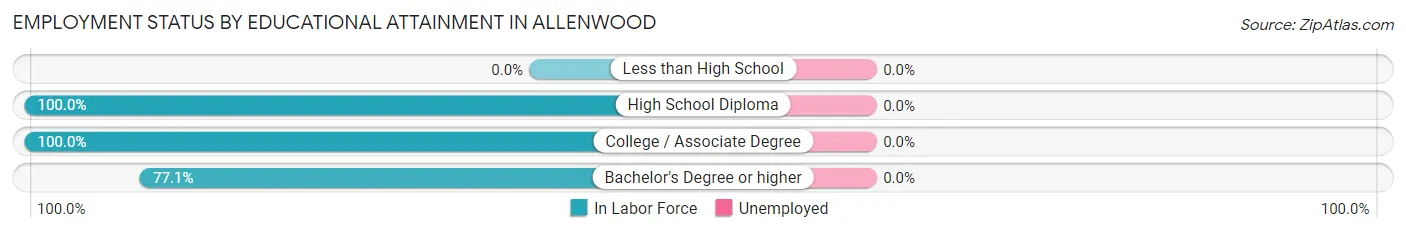
| Educational Attainment | In Labor Force | Unemployed |
| Less than High School | 0 (0.0%) | 0 (0.0%) |
| High School Diploma | 8 (100.0%) | 0 (0.0%) |
| College / Associate Degree | 54 (100.0%) | 0 (0.0%) |
| Bachelor's Degree or higher | 185 (77.1%) | 0 (0.0%) |
| Total | 247 (81.8%) | 0 (0.0%) |
Employment Occupations by Sex in Allenwood
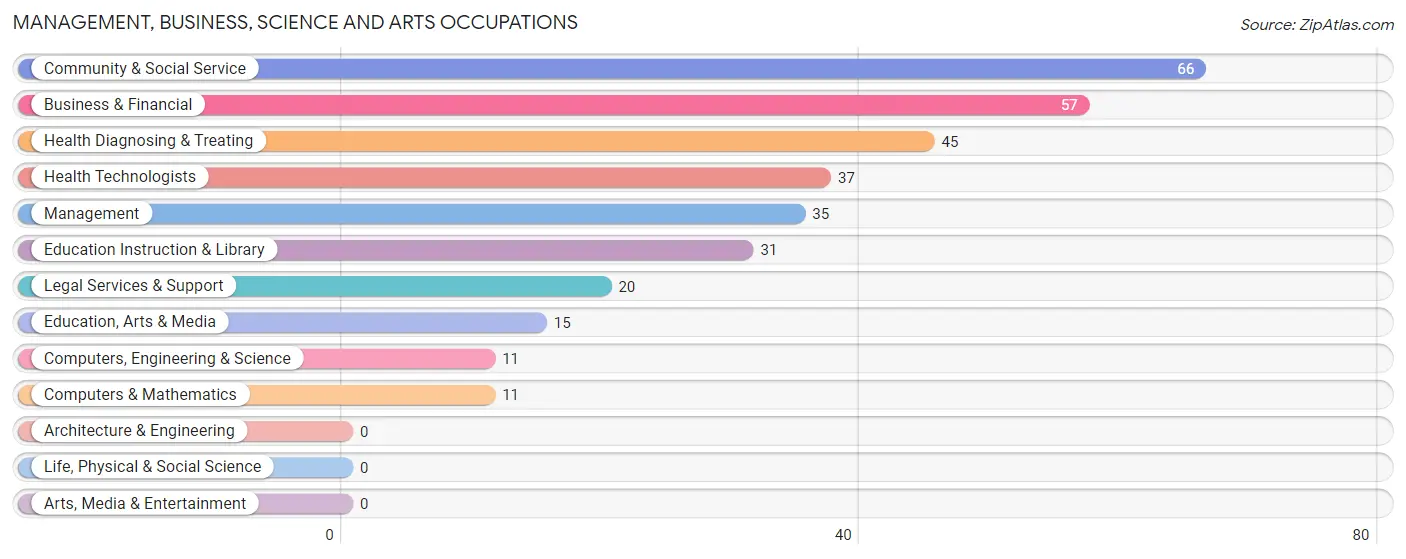
Management, Business, Science and Arts Occupations
The most common Management, Business, Science and Arts occupations in Allenwood are Community & Social Service (66 | 17.1%), Business & Financial (57 | 14.8%), Health Diagnosing & Treating (45 | 11.7%), Health Technologists (37 | 9.6%), and Management (35 | 9.1%).
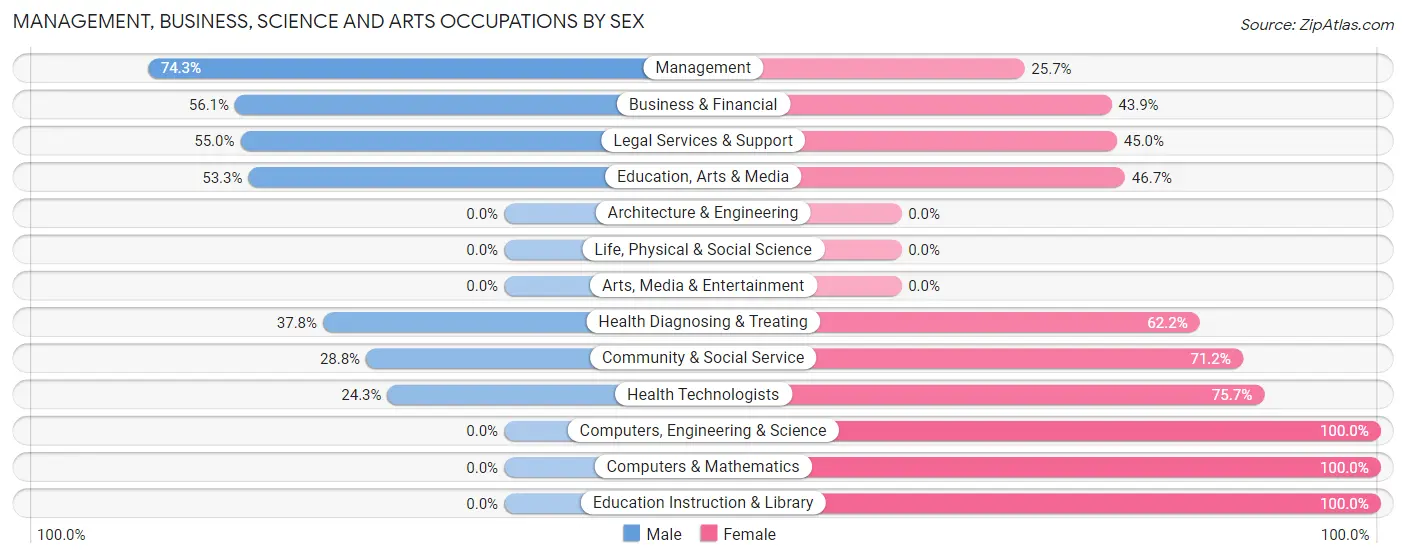
Management, Business, Science and Arts Occupations by Sex
Within the Management, Business, Science and Arts occupations in Allenwood, the most male-oriented occupations are Management (74.3%), Business & Financial (56.1%), and Legal Services & Support (55.0%), while the most female-oriented occupations are Computers, Engineering & Science (100.0%), Computers & Mathematics (100.0%), and Education Instruction & Library (100.0%).
| Occupation | Male | Female |
| Management | 26 (74.3%) | 9 (25.7%) |
| Business & Financial | 32 (56.1%) | 25 (43.9%) |
| Computers, Engineering & Science | 0 (0.0%) | 11 (100.0%) |
| Computers & Mathematics | 0 (0.0%) | 11 (100.0%) |
| Architecture & Engineering | 0 (0.0%) | 0 (0.0%) |
| Life, Physical & Social Science | 0 (0.0%) | 0 (0.0%) |
| Community & Social Service | 19 (28.8%) | 47 (71.2%) |
| Education, Arts & Media | 8 (53.3%) | 7 (46.7%) |
| Legal Services & Support | 11 (55.0%) | 9 (45.0%) |
| Education Instruction & Library | 0 (0.0%) | 31 (100.0%) |
| Arts, Media & Entertainment | 0 (0.0%) | 0 (0.0%) |
| Health Diagnosing & Treating | 17 (37.8%) | 28 (62.2%) |
| Health Technologists | 9 (24.3%) | 28 (75.7%) |
| Total (Category) | 94 (43.9%) | 120 (56.1%) |
| Total (Overall) | 195 (50.5%) | 191 (49.5%) |
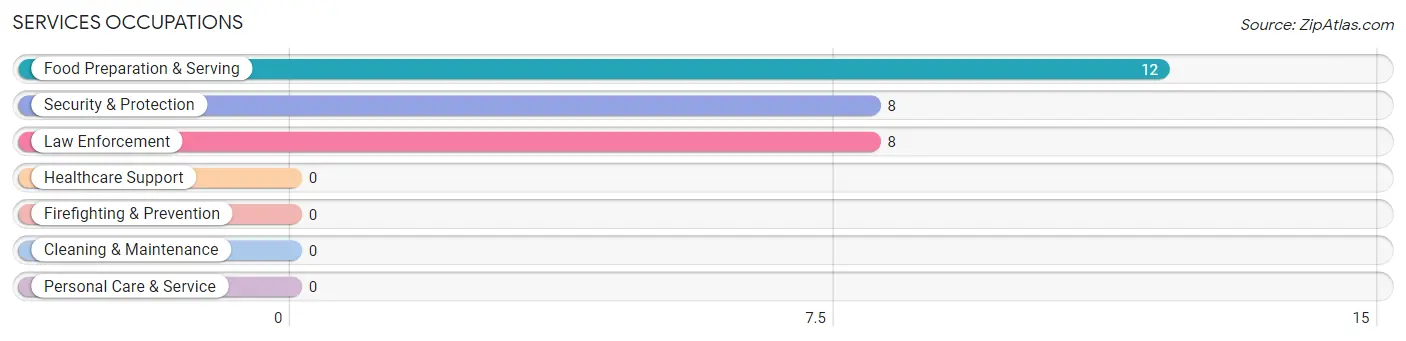
Services Occupations
The most common Services occupations in Allenwood are Food Preparation & Serving (12 | 3.1%), Security & Protection (8 | 2.1%), and Law Enforcement (8 | 2.1%).
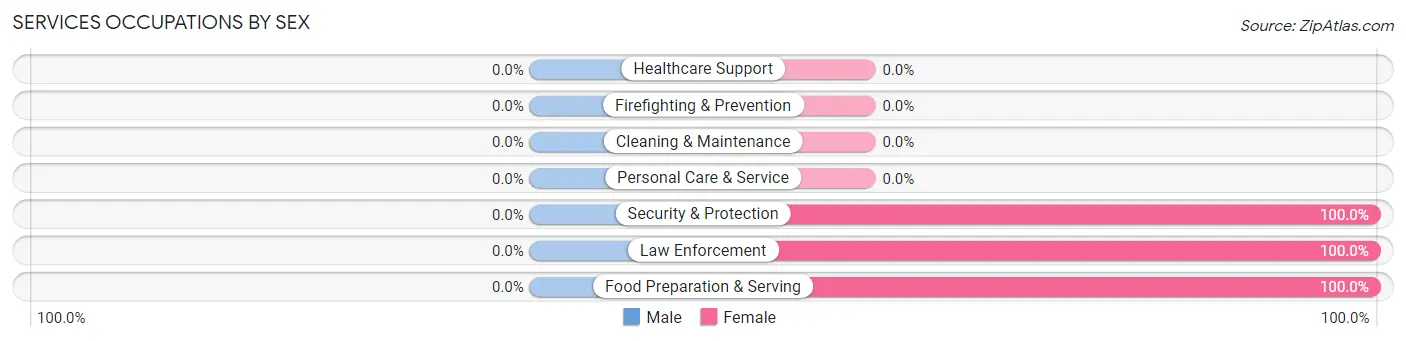
Services Occupations by Sex
| Occupation | Male | Female |
| Healthcare Support | 0 (0.0%) | 0 (0.0%) |
| Security & Protection | 0 (0.0%) | 8 (100.0%) |
| Firefighting & Prevention | 0 (0.0%) | 0 (0.0%) |
| Law Enforcement | 0 (0.0%) | 8 (100.0%) |
| Food Preparation & Serving | 0 (0.0%) | 12 (100.0%) |
| Cleaning & Maintenance | 0 (0.0%) | 0 (0.0%) |
| Personal Care & Service | 0 (0.0%) | 0 (0.0%) |
| Total (Category) | 0 (0.0%) | 20 (100.0%) |
| Total (Overall) | 195 (50.5%) | 191 (49.5%) |
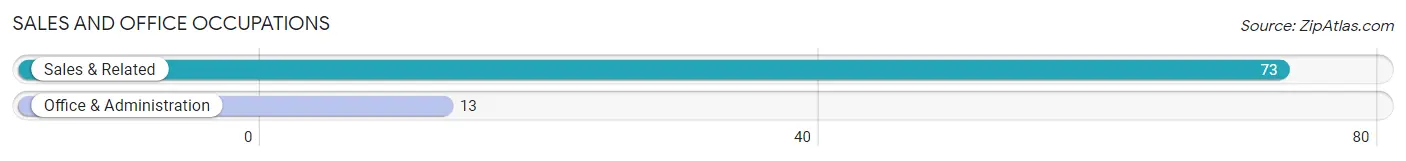
Sales and Office Occupations
The most common Sales and Office occupations in Allenwood are Sales & Related (73 | 18.9%), and Office & Administration (13 | 3.4%).
Sales and Office Occupations by Sex
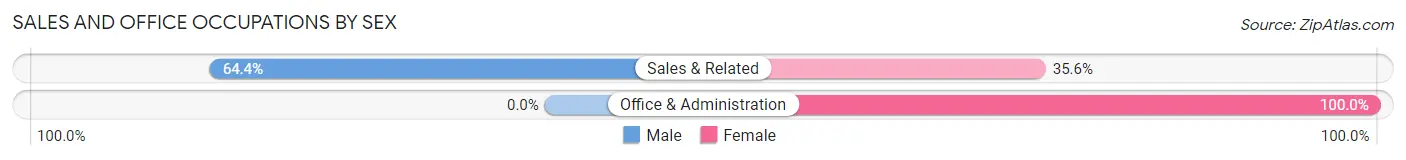
| Occupation | Male | Female |
| Sales & Related | 47 (64.4%) | 26 (35.6%) |
| Office & Administration | 0 (0.0%) | 13 (100.0%) |
| Total (Category) | 47 (54.6%) | 39 (45.4%) |
| Total (Overall) | 195 (50.5%) | 191 (49.5%) |
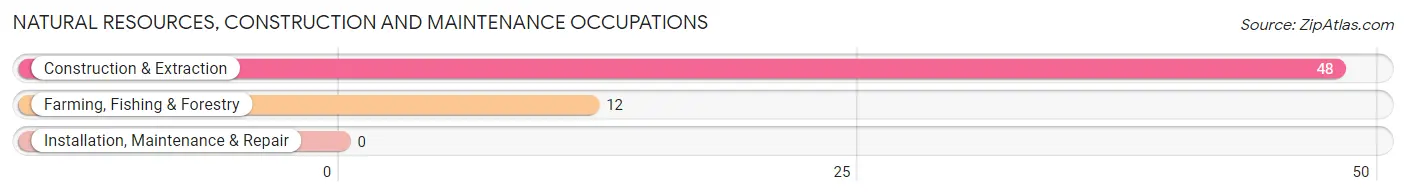
Natural Resources, Construction and Maintenance Occupations
The most common Natural Resources, Construction and Maintenance occupations in Allenwood are Construction & Extraction (48 | 12.4%), and Farming, Fishing & Forestry (12 | 3.1%).
Natural Resources, Construction and Maintenance Occupations by Sex
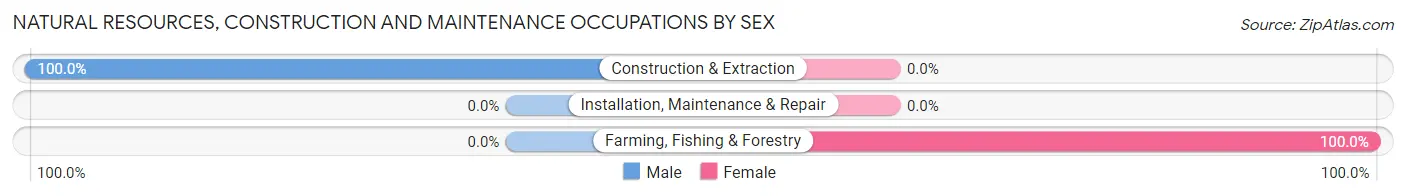
| Occupation | Male | Female |
| Farming, Fishing & Forestry | 0 (0.0%) | 12 (100.0%) |
| Construction & Extraction | 48 (100.0%) | 0 (0.0%) |
| Installation, Maintenance & Repair | 0 (0.0%) | 0 (0.0%) |
| Total (Category) | 48 (80.0%) | 12 (20.0%) |
| Total (Overall) | 195 (50.5%) | 191 (49.5%) |
Production, Transportation and Moving Occupations
The most common Production, Transportation and Moving occupations in Allenwood are , and Transportation (6 | 1.5%).
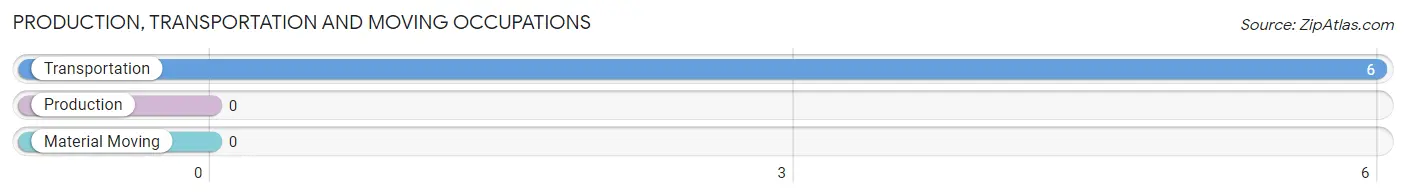
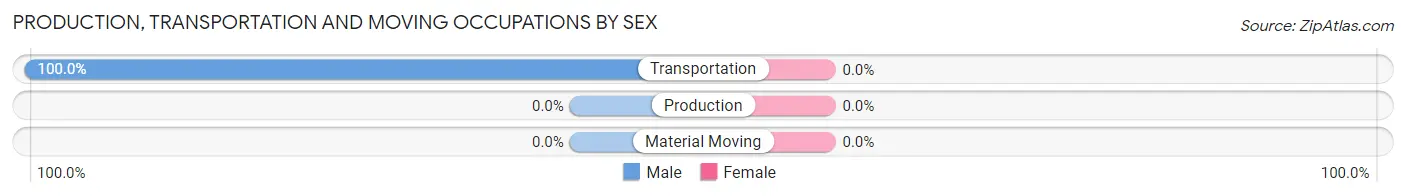
Production, Transportation and Moving Occupations by Sex
| Occupation | Male | Female |
| Production | 0 (0.0%) | 0 (0.0%) |
| Transportation | 6 (100.0%) | 0 (0.0%) |
| Material Moving | 0 (0.0%) | 0 (0.0%) |
| Total (Category) | 6 (100.0%) | 0 (0.0%) |
| Total (Overall) | 195 (50.5%) | 191 (49.5%) |
Employment Industries by Sex in Allenwood
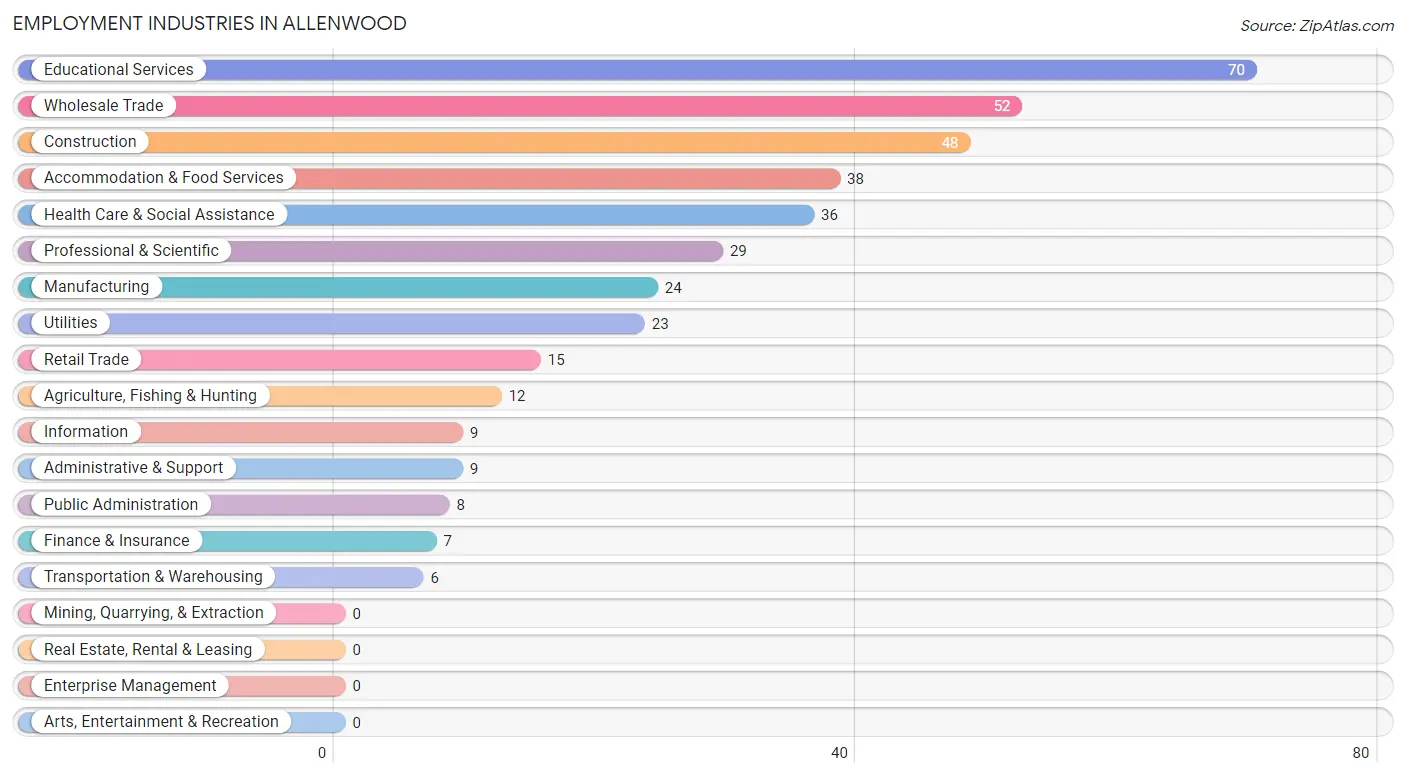
Employment Industries in Allenwood
The major employment industries in Allenwood include Educational Services (70 | 18.1%), Wholesale Trade (52 | 13.5%), Construction (48 | 12.4%), Accommodation & Food Services (38 | 9.8%), and Health Care & Social Assistance (36 | 9.3%).
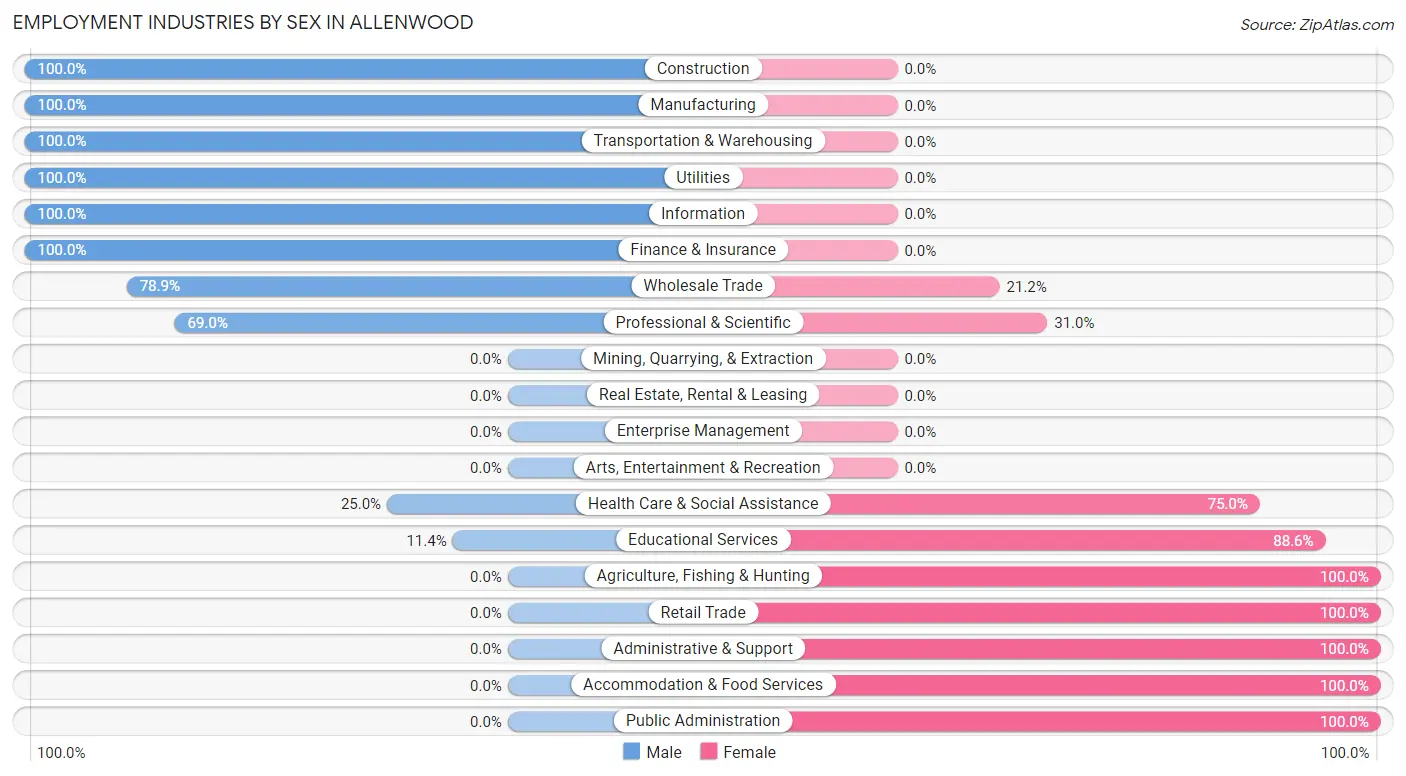
Employment Industries by Sex in Allenwood
The Allenwood industries that see more men than women are Construction (100.0%), Manufacturing (100.0%), and Transportation & Warehousing (100.0%), whereas the industries that tend to have a higher number of women are Agriculture, Fishing & Hunting (100.0%), Retail Trade (100.0%), and Administrative & Support (100.0%).
| Industry | Male | Female |
| Agriculture, Fishing & Hunting | 0 (0.0%) | 12 (100.0%) |
| Mining, Quarrying, & Extraction | 0 (0.0%) | 0 (0.0%) |
| Construction | 48 (100.0%) | 0 (0.0%) |
| Manufacturing | 24 (100.0%) | 0 (0.0%) |
| Wholesale Trade | 41 (78.8%) | 11 (21.1%) |
| Retail Trade | 0 (0.0%) | 15 (100.0%) |
| Transportation & Warehousing | 6 (100.0%) | 0 (0.0%) |
| Utilities | 23 (100.0%) | 0 (0.0%) |
| Information | 9 (100.0%) | 0 (0.0%) |
| Finance & Insurance | 7 (100.0%) | 0 (0.0%) |
| Real Estate, Rental & Leasing | 0 (0.0%) | 0 (0.0%) |
| Professional & Scientific | 20 (69.0%) | 9 (31.0%) |
| Enterprise Management | 0 (0.0%) | 0 (0.0%) |
| Administrative & Support | 0 (0.0%) | 9 (100.0%) |
| Educational Services | 8 (11.4%) | 62 (88.6%) |
| Health Care & Social Assistance | 9 (25.0%) | 27 (75.0%) |
| Arts, Entertainment & Recreation | 0 (0.0%) | 0 (0.0%) |
| Accommodation & Food Services | 0 (0.0%) | 38 (100.0%) |
| Public Administration | 0 (0.0%) | 8 (100.0%) |
| Total | 195 (50.5%) | 191 (49.5%) |
Education in Allenwood
School Enrollment in Allenwood
The most common levels of schooling among the 112 students in Allenwood are high school (39 | 34.8%), middle school (38 | 33.9%), and college / undergraduate (15 | 13.4%).
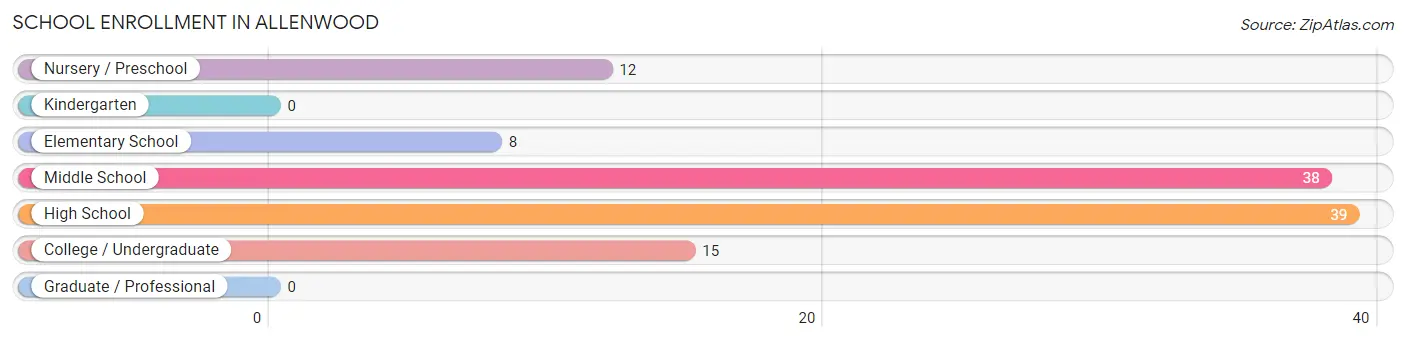
| School Level | # Students | % Students |
| Nursery / Preschool | 12 | 10.7% |
| Kindergarten | 0 | 0.0% |
| Elementary School | 8 | 7.1% |
| Middle School | 38 | 33.9% |
| High School | 39 | 34.8% |
| College / Undergraduate | 15 | 13.4% |
| Graduate / Professional | 0 | 0.0% |
| Total | 112 | 100.0% |
School Enrollment by Age by Funding Source in Allenwood
Out of a total of 112 students who are enrolled in schools in Allenwood, 12 (10.7%) attend a private institution, while the remaining 100 (89.3%) are enrolled in public schools. The age group of 3 to 4 year olds has the highest likelihood of being enrolled in private schools, with 12 (100.0% in the age bracket) enrolled. Conversely, the age group of 10 to 14 year olds has the lowest likelihood of being enrolled in a private school, with 53 (100.0% in the age bracket) attending a public institution.
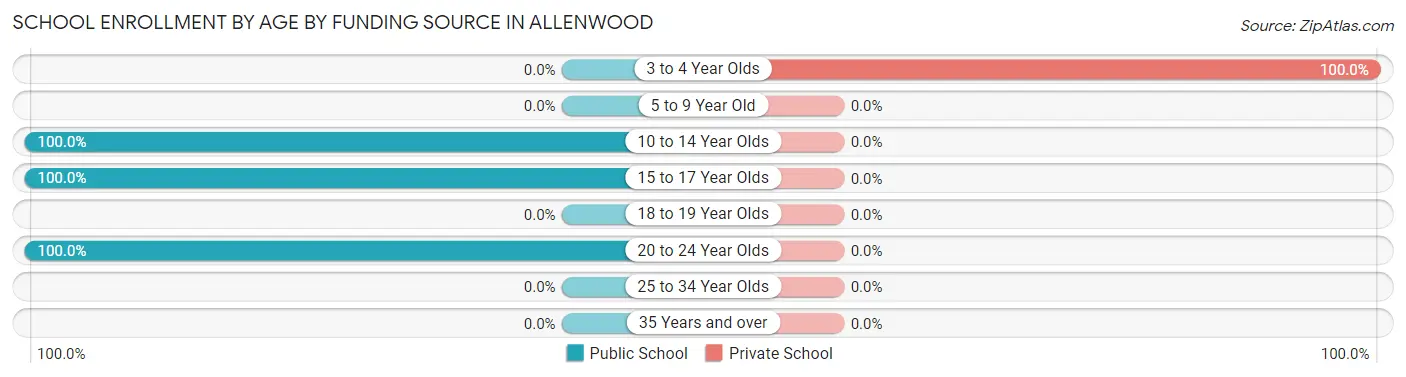
| Age Bracket | Public School | Private School |
| 3 to 4 Year Olds | 0 (0.0%) | 12 (100.0%) |
| 5 to 9 Year Old | 0 (0.0%) | 0 (0.0%) |
| 10 to 14 Year Olds | 53 (100.0%) | 0 (0.0%) |
| 15 to 17 Year Olds | 32 (100.0%) | 0 (0.0%) |
| 18 to 19 Year Olds | 0 (0.0%) | 0 (0.0%) |
| 20 to 24 Year Olds | 15 (100.0%) | 0 (0.0%) |
| 25 to 34 Year Olds | 0 (0.0%) | 0 (0.0%) |
| 35 Years and over | 0 (0.0%) | 0 (0.0%) |
| Total | 100 (89.3%) | 12 (10.7%) |
Educational Attainment by Field of Study in Allenwood
Business (94 | 32.1%), science & technology (58 | 19.8%), bio, nature & agricultural (43 | 14.7%), communications (28 | 9.6%), and education (22 | 7.5%) are the most common fields of study among 293 individuals in Allenwood who have obtained a bachelor's degree or higher.
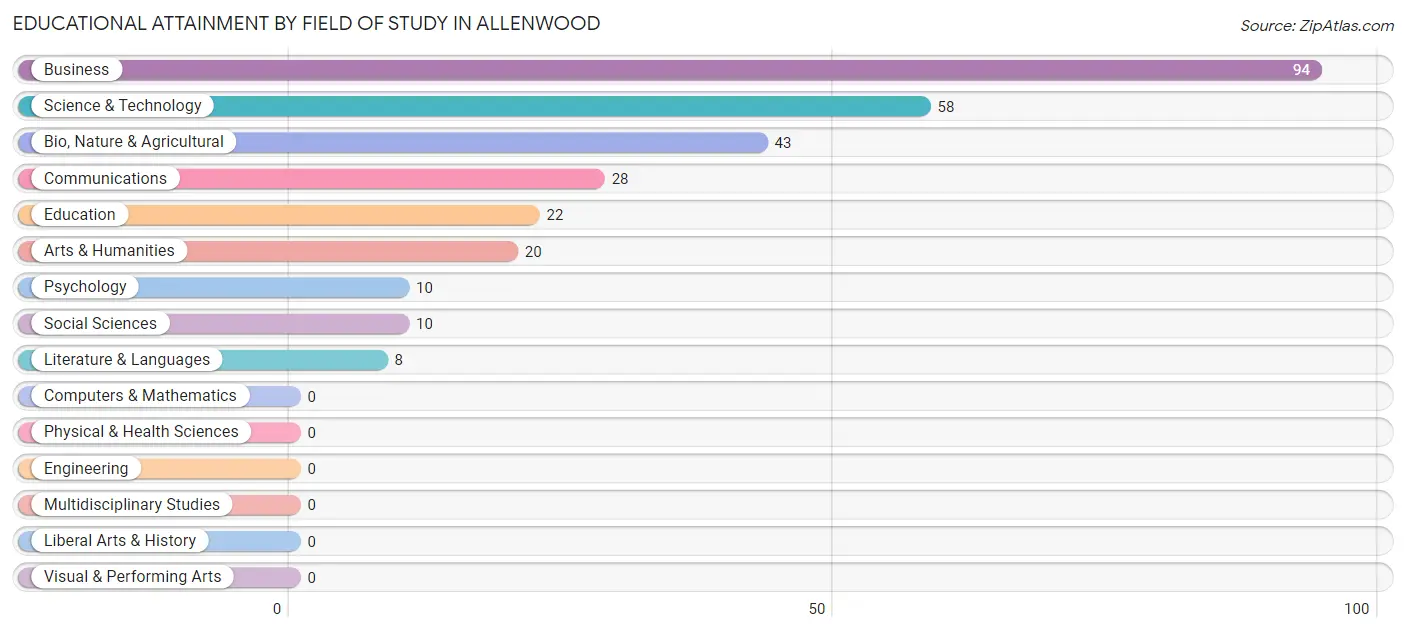
| Field of Study | # Graduates | % Graduates |
| Computers & Mathematics | 0 | 0.0% |
| Bio, Nature & Agricultural | 43 | 14.7% |
| Physical & Health Sciences | 0 | 0.0% |
| Psychology | 10 | 3.4% |
| Social Sciences | 10 | 3.4% |
| Engineering | 0 | 0.0% |
| Multidisciplinary Studies | 0 | 0.0% |
| Science & Technology | 58 | 19.8% |
| Business | 94 | 32.1% |
| Education | 22 | 7.5% |
| Literature & Languages | 8 | 2.7% |
| Liberal Arts & History | 0 | 0.0% |
| Visual & Performing Arts | 0 | 0.0% |
| Communications | 28 | 9.6% |
| Arts & Humanities | 20 | 6.8% |
| Total | 293 | 100.0% |
Transportation & Commute in Allenwood
Vehicle Availability by Sex in Allenwood
The most prevalent vehicle ownership categories in Allenwood are males with 2 vehicles (118, accounting for 60.5%) and females with 2 vehicles (52, making up 61.8%).
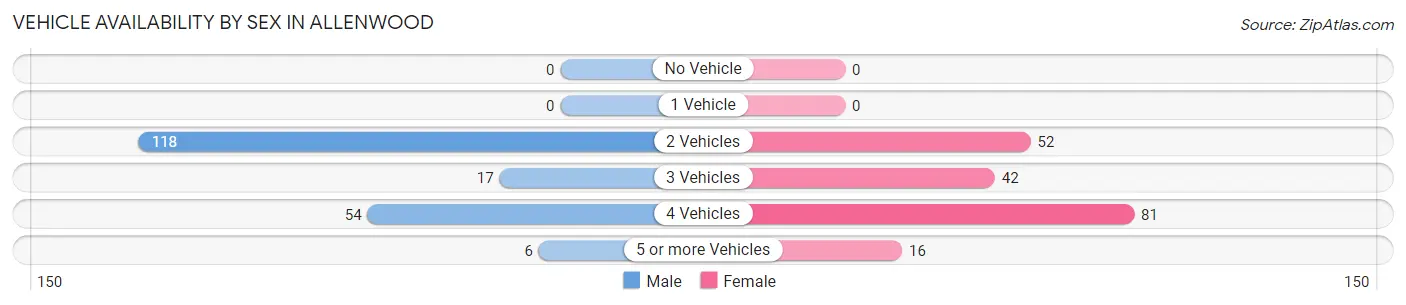
| Vehicles Available | Male | Female |
| No Vehicle | 0 (0.0%) | 0 (0.0%) |
| 1 Vehicle | 0 (0.0%) | 0 (0.0%) |
| 2 Vehicles | 118 (60.5%) | 52 (27.2%) |
| 3 Vehicles | 17 (8.7%) | 42 (22.0%) |
| 4 Vehicles | 54 (27.7%) | 81 (42.4%) |
| 5 or more Vehicles | 6 (3.1%) | 16 (8.4%) |
| Total | 195 (100.0%) | 191 (100.0%) |
Commute Time in Allenwood
The most frequently occuring commute durations in Allenwood are 15 to 19 minutes (101 commuters, 27.5%), 20 to 24 minutes (68 commuters, 18.5%), and 90 or more minutes (59 commuters, 16.0%).
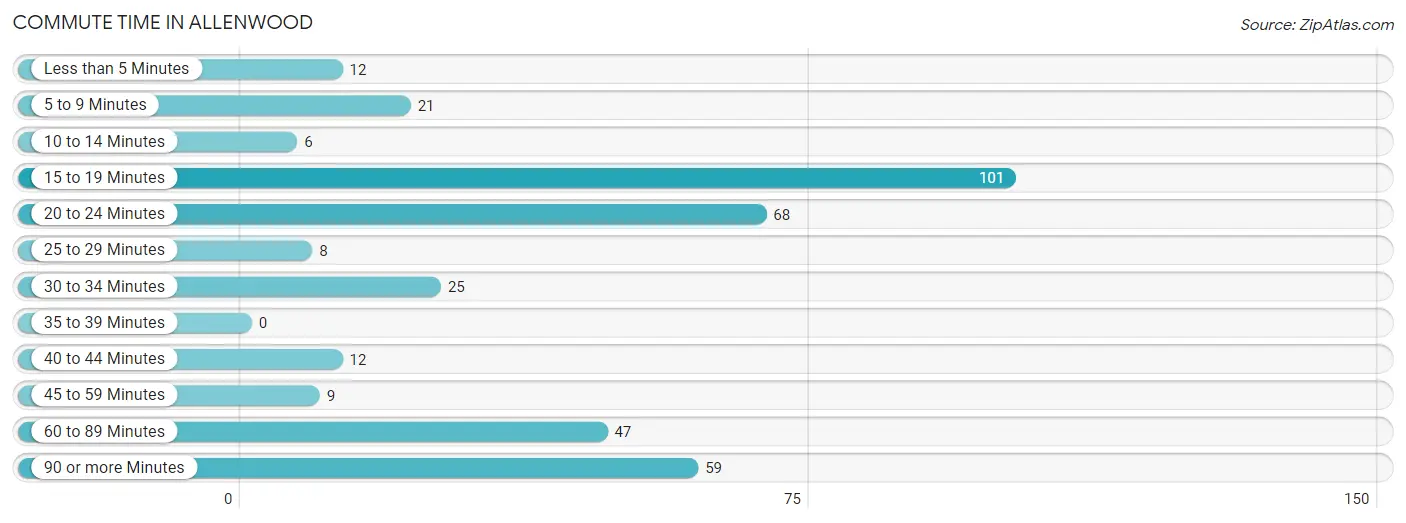
| Commute Time | # Commuters | % Commuters |
| Less than 5 Minutes | 12 | 3.3% |
| 5 to 9 Minutes | 21 | 5.7% |
| 10 to 14 Minutes | 6 | 1.6% |
| 15 to 19 Minutes | 101 | 27.5% |
| 20 to 24 Minutes | 68 | 18.5% |
| 25 to 29 Minutes | 8 | 2.2% |
| 30 to 34 Minutes | 25 | 6.8% |
| 35 to 39 Minutes | 0 | 0.0% |
| 40 to 44 Minutes | 12 | 3.3% |
| 45 to 59 Minutes | 9 | 2.5% |
| 60 to 89 Minutes | 47 | 12.8% |
| 90 or more Minutes | 59 | 16.0% |
Commute Time by Sex in Allenwood
The most common commute times in Allenwood are 15 to 19 minutes (56 commuters, 31.6%) for males and 15 to 19 minutes (45 commuters, 23.6%) for females.
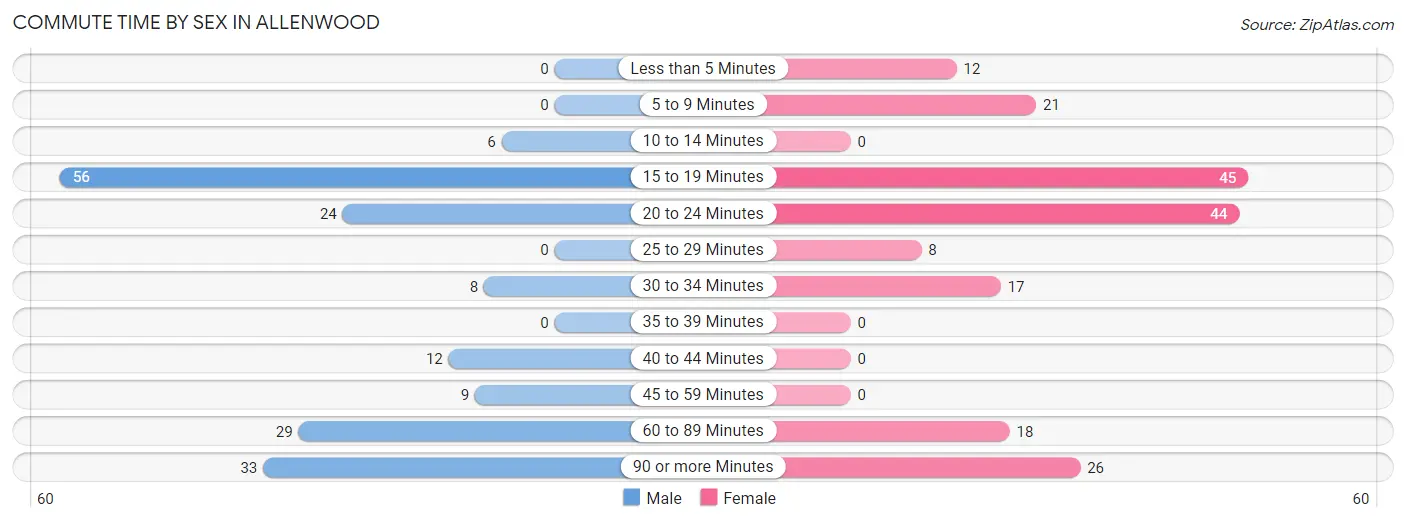
| Commute Time | Male | Female |
| Less than 5 Minutes | 0 (0.0%) | 12 (6.3%) |
| 5 to 9 Minutes | 0 (0.0%) | 21 (11.0%) |
| 10 to 14 Minutes | 6 (3.4%) | 0 (0.0%) |
| 15 to 19 Minutes | 56 (31.6%) | 45 (23.6%) |
| 20 to 24 Minutes | 24 (13.6%) | 44 (23.0%) |
| 25 to 29 Minutes | 0 (0.0%) | 8 (4.2%) |
| 30 to 34 Minutes | 8 (4.5%) | 17 (8.9%) |
| 35 to 39 Minutes | 0 (0.0%) | 0 (0.0%) |
| 40 to 44 Minutes | 12 (6.8%) | 0 (0.0%) |
| 45 to 59 Minutes | 9 (5.1%) | 0 (0.0%) |
| 60 to 89 Minutes | 29 (16.4%) | 18 (9.4%) |
| 90 or more Minutes | 33 (18.6%) | 26 (13.6%) |
Time of Departure to Work by Sex in Allenwood
The most frequent times of departure to work in Allenwood are 8:00 AM to 8:29 AM (54, 30.5%) for males and 8:00 AM to 8:29 AM (63, 33.0%) for females.
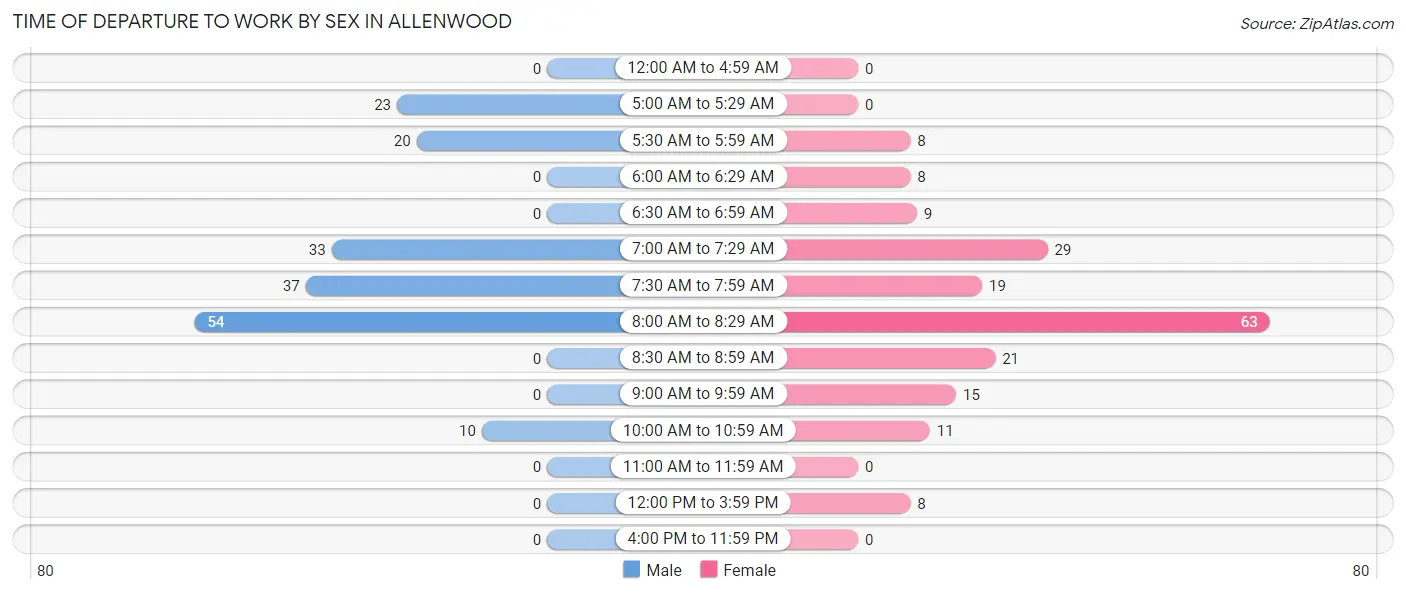
| Time of Departure | Male | Female |
| 12:00 AM to 4:59 AM | 0 (0.0%) | 0 (0.0%) |
| 5:00 AM to 5:29 AM | 23 (13.0%) | 0 (0.0%) |
| 5:30 AM to 5:59 AM | 20 (11.3%) | 8 (4.2%) |
| 6:00 AM to 6:29 AM | 0 (0.0%) | 8 (4.2%) |
| 6:30 AM to 6:59 AM | 0 (0.0%) | 9 (4.7%) |
| 7:00 AM to 7:29 AM | 33 (18.6%) | 29 (15.2%) |
| 7:30 AM to 7:59 AM | 37 (20.9%) | 19 (10.0%) |
| 8:00 AM to 8:29 AM | 54 (30.5%) | 63 (33.0%) |
| 8:30 AM to 8:59 AM | 0 (0.0%) | 21 (11.0%) |
| 9:00 AM to 9:59 AM | 0 (0.0%) | 15 (7.9%) |
| 10:00 AM to 10:59 AM | 10 (5.7%) | 11 (5.8%) |
| 11:00 AM to 11:59 AM | 0 (0.0%) | 0 (0.0%) |
| 12:00 PM to 3:59 PM | 0 (0.0%) | 8 (4.2%) |
| 4:00 PM to 11:59 PM | 0 (0.0%) | 0 (0.0%) |
| Total | 177 (100.0%) | 191 (100.0%) |
Housing Occupancy in Allenwood
Occupancy by Ownership in Allenwood
Of the total 246 dwellings in Allenwood, owner-occupied units account for 210 (85.4%), while renter-occupied units make up 36 (14.6%).
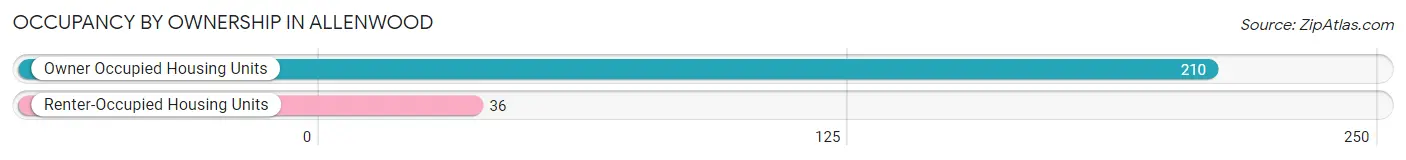
| Occupancy | # Housing Units | % Housing Units |
| Owner Occupied Housing Units | 210 | 85.4% |
| Renter-Occupied Housing Units | 36 | 14.6% |
| Total Occupied Housing Units | 246 | 100.0% |
Occupancy by Household Size in Allenwood
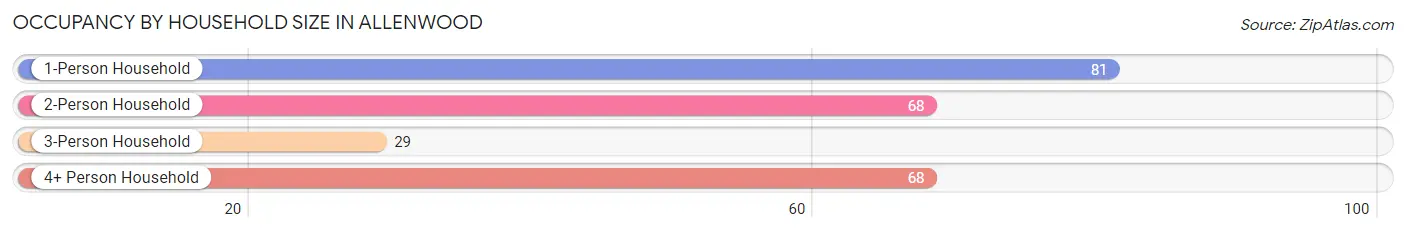
| Household Size | # Housing Units | % Housing Units |
| 1-Person Household | 81 | 32.9% |
| 2-Person Household | 68 | 27.6% |
| 3-Person Household | 29 | 11.8% |
| 4+ Person Household | 68 | 27.6% |
| Total Housing Units | 246 | 100.0% |
Occupancy by Ownership by Household Size in Allenwood
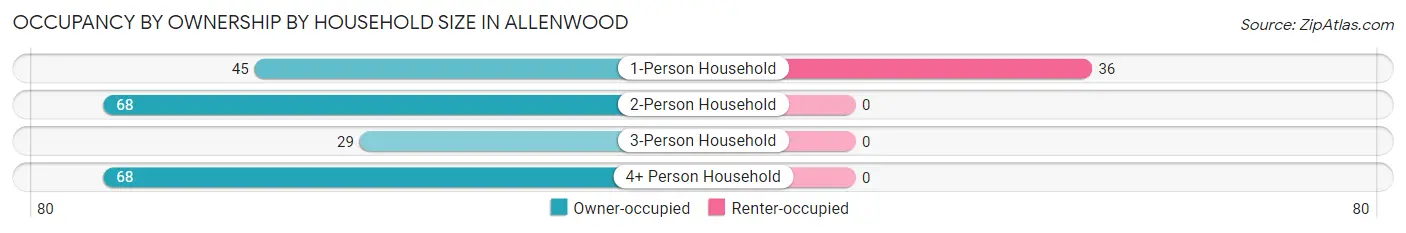
| Household Size | Owner-occupied | Renter-occupied |
| 1-Person Household | 45 (55.6%) | 36 (44.4%) |
| 2-Person Household | 68 (100.0%) | 0 (0.0%) |
| 3-Person Household | 29 (100.0%) | 0 (0.0%) |
| 4+ Person Household | 68 (100.0%) | 0 (0.0%) |
| Total Housing Units | 210 (85.4%) | 36 (14.6%) |
Occupancy by Educational Attainment in Allenwood
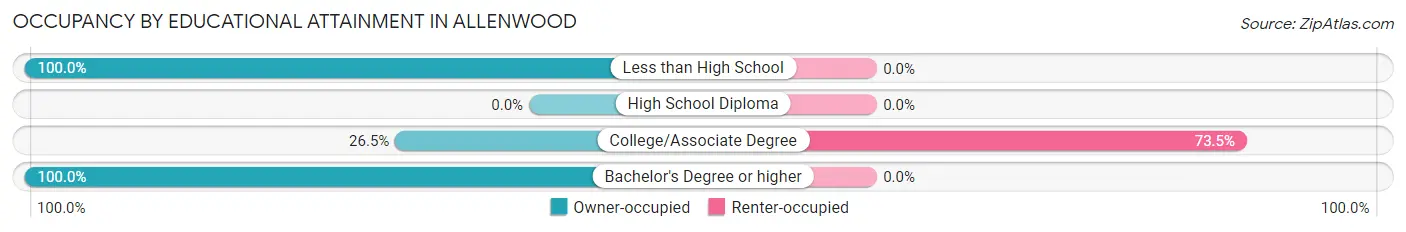
| Household Size | Owner-occupied | Renter-occupied |
| Less than High School | 11 (100.0%) | 0 (0.0%) |
| High School Diploma | 0 (0.0%) | 0 (0.0%) |
| College/Associate Degree | 13 (26.5%) | 36 (73.5%) |
| Bachelor's Degree or higher | 186 (100.0%) | 0 (0.0%) |
Occupancy by Age of Householder in Allenwood
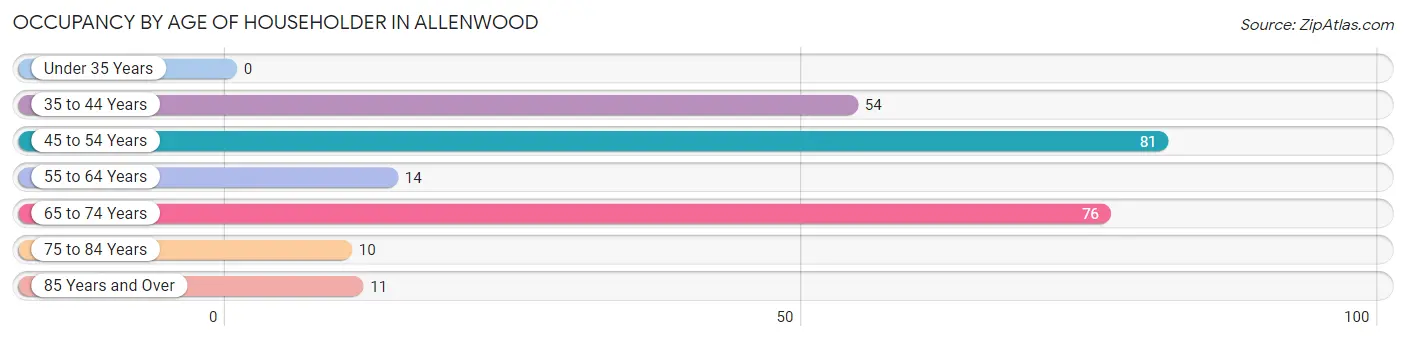
| Age Bracket | # Households | % Households |
| Under 35 Years | 0 | 0.0% |
| 35 to 44 Years | 54 | 22.0% |
| 45 to 54 Years | 81 | 32.9% |
| 55 to 64 Years | 14 | 5.7% |
| 65 to 74 Years | 76 | 30.9% |
| 75 to 84 Years | 10 | 4.1% |
| 85 Years and Over | 11 | 4.5% |
| Total | 246 | 100.0% |
Housing Finances in Allenwood
Median Income by Occupancy in Allenwood
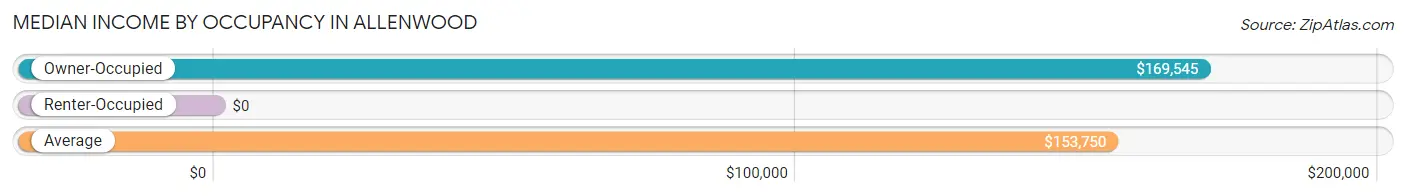
| Occupancy Type | # Households | Median Income |
| Owner-Occupied | 210 (85.4%) | $169,545 |
| Renter-Occupied | 36 (14.6%) | $0 |
| Average | 246 (100.0%) | $153,750 |
Occupancy by Householder Income Bracket in Allenwood
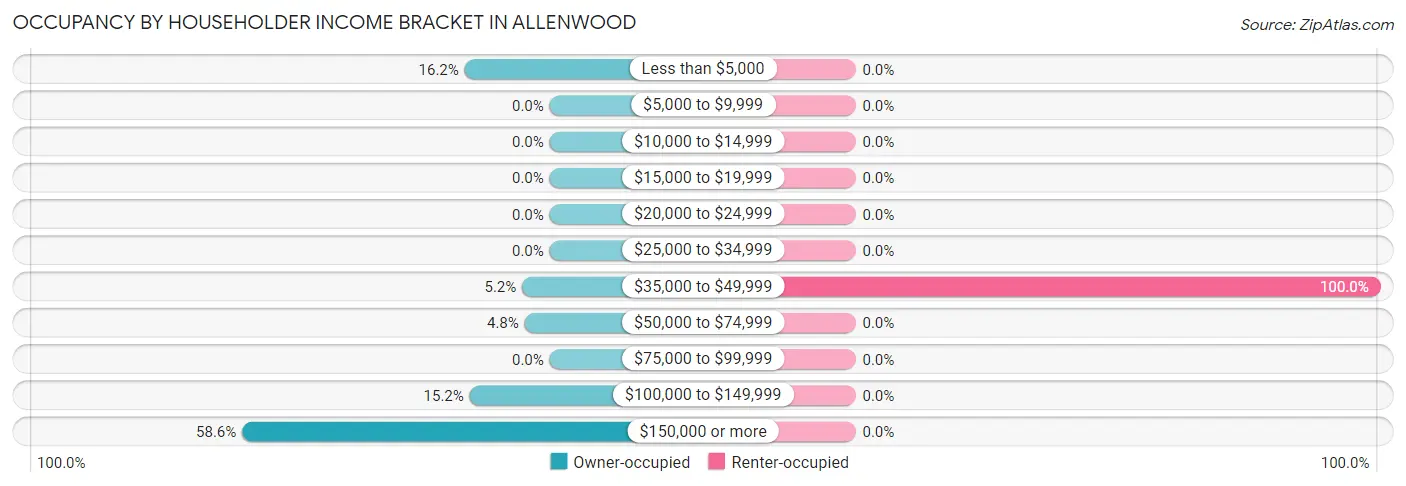
| Income Bracket | Owner-occupied | Renter-occupied |
| Less than $5,000 | 34 (16.2%) | 0 (0.0%) |
| $5,000 to $9,999 | 0 (0.0%) | 0 (0.0%) |
| $10,000 to $14,999 | 0 (0.0%) | 0 (0.0%) |
| $15,000 to $19,999 | 0 (0.0%) | 0 (0.0%) |
| $20,000 to $24,999 | 0 (0.0%) | 0 (0.0%) |
| $25,000 to $34,999 | 0 (0.0%) | 0 (0.0%) |
| $35,000 to $49,999 | 11 (5.2%) | 36 (100.0%) |
| $50,000 to $74,999 | 10 (4.8%) | 0 (0.0%) |
| $75,000 to $99,999 | 0 (0.0%) | 0 (0.0%) |
| $100,000 to $149,999 | 32 (15.2%) | 0 (0.0%) |
| $150,000 or more | 123 (58.6%) | 0 (0.0%) |
| Total | 210 (100.0%) | 36 (100.0%) |
Monthly Housing Cost Tiers in Allenwood
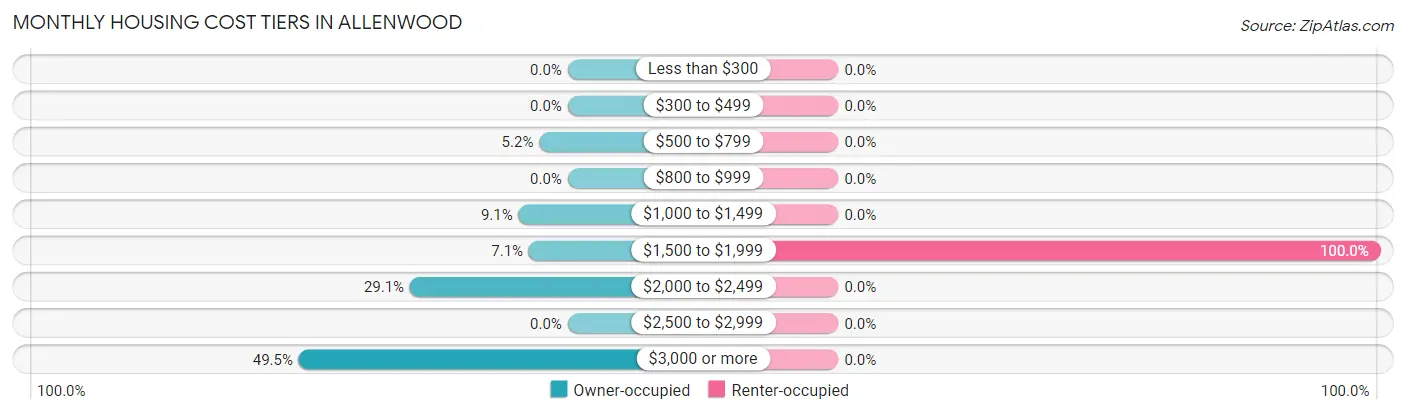
| Monthly Cost | Owner-occupied | Renter-occupied |
| Less than $300 | 0 (0.0%) | 0 (0.0%) |
| $300 to $499 | 0 (0.0%) | 0 (0.0%) |
| $500 to $799 | 11 (5.2%) | 0 (0.0%) |
| $800 to $999 | 0 (0.0%) | 0 (0.0%) |
| $1,000 to $1,499 | 19 (9.0%) | 0 (0.0%) |
| $1,500 to $1,999 | 15 (7.1%) | 36 (100.0%) |
| $2,000 to $2,499 | 61 (29.0%) | 0 (0.0%) |
| $2,500 to $2,999 | 0 (0.0%) | 0 (0.0%) |
| $3,000 or more | 104 (49.5%) | 0 (0.0%) |
| Total | 210 (100.0%) | 36 (100.0%) |
Physical Housing Characteristics in Allenwood
Housing Structures in Allenwood
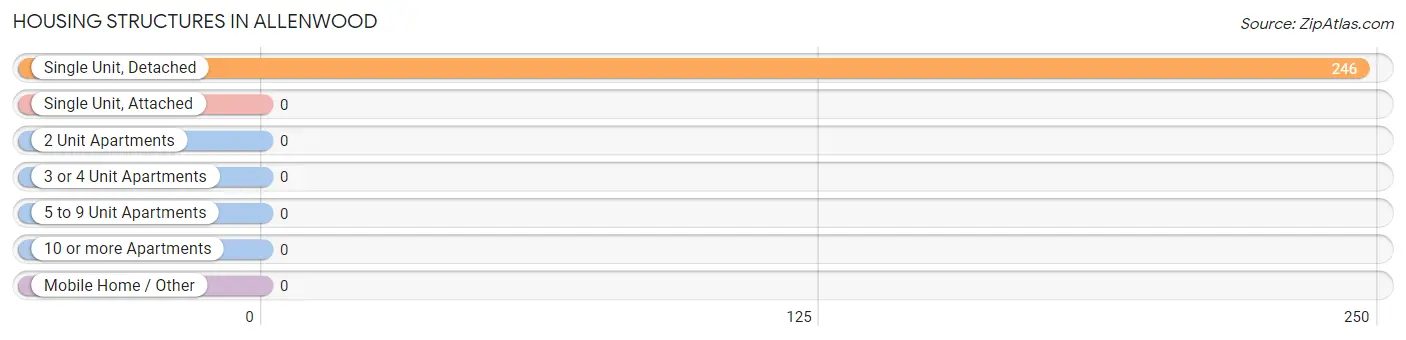
| Structure Type | # Housing Units | % Housing Units |
| Single Unit, Detached | 246 | 100.0% |
| Single Unit, Attached | 0 | 0.0% |
| 2 Unit Apartments | 0 | 0.0% |
| 3 or 4 Unit Apartments | 0 | 0.0% |
| 5 to 9 Unit Apartments | 0 | 0.0% |
| 10 or more Apartments | 0 | 0.0% |
| Mobile Home / Other | 0 | 0.0% |
| Total | 246 | 100.0% |
Housing Structures by Occupancy in Allenwood
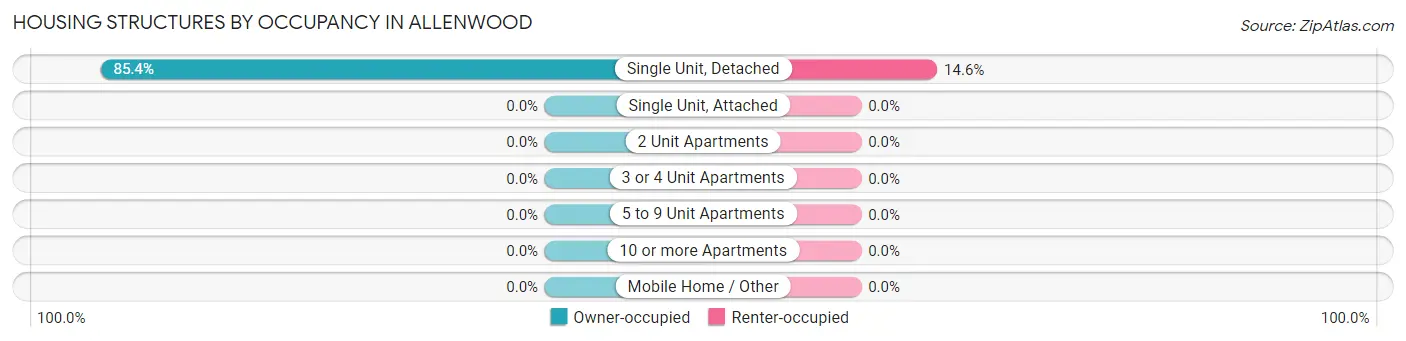
| Structure Type | Owner-occupied | Renter-occupied |
| Single Unit, Detached | 210 (85.4%) | 36 (14.6%) |
| Single Unit, Attached | 0 (0.0%) | 0 (0.0%) |
| 2 Unit Apartments | 0 (0.0%) | 0 (0.0%) |
| 3 or 4 Unit Apartments | 0 (0.0%) | 0 (0.0%) |
| 5 to 9 Unit Apartments | 0 (0.0%) | 0 (0.0%) |
| 10 or more Apartments | 0 (0.0%) | 0 (0.0%) |
| Mobile Home / Other | 0 (0.0%) | 0 (0.0%) |
| Total | 210 (85.4%) | 36 (14.6%) |
Housing Structures by Number of Rooms in Allenwood
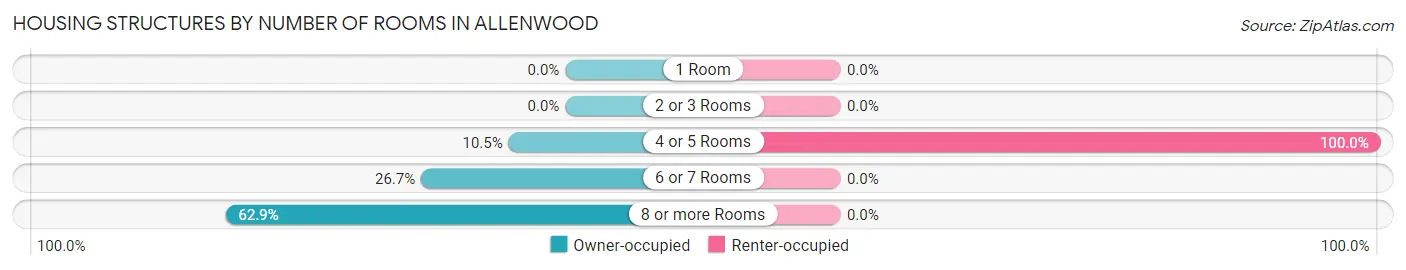
| Number of Rooms | Owner-occupied | Renter-occupied |
| 1 Room | 0 (0.0%) | 0 (0.0%) |
| 2 or 3 Rooms | 0 (0.0%) | 0 (0.0%) |
| 4 or 5 Rooms | 22 (10.5%) | 36 (100.0%) |
| 6 or 7 Rooms | 56 (26.7%) | 0 (0.0%) |
| 8 or more Rooms | 132 (62.9%) | 0 (0.0%) |
| Total | 210 (100.0%) | 36 (100.0%) |
Housing Structure by Heating Type in Allenwood
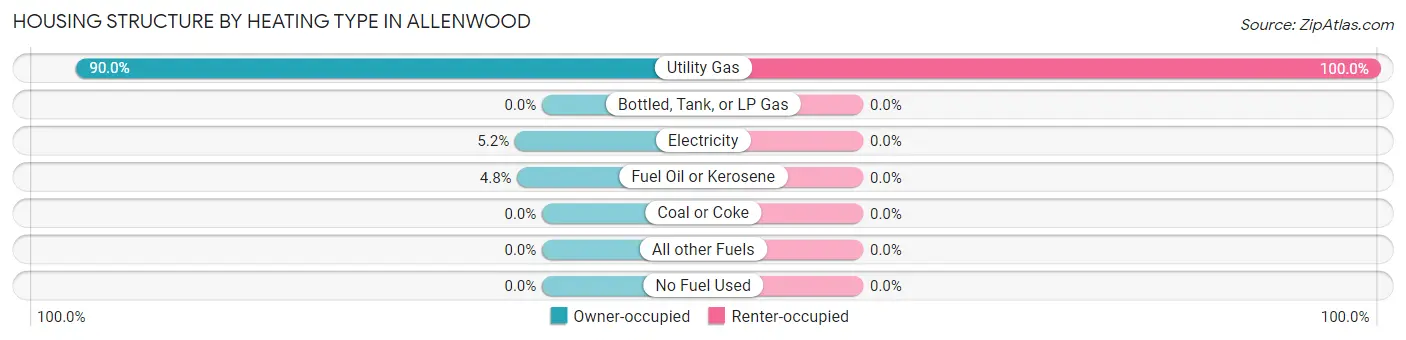
| Heating Type | Owner-occupied | Renter-occupied |
| Utility Gas | 189 (90.0%) | 36 (100.0%) |
| Bottled, Tank, or LP Gas | 0 (0.0%) | 0 (0.0%) |
| Electricity | 11 (5.2%) | 0 (0.0%) |
| Fuel Oil or Kerosene | 10 (4.8%) | 0 (0.0%) |
| Coal or Coke | 0 (0.0%) | 0 (0.0%) |
| All other Fuels | 0 (0.0%) | 0 (0.0%) |
| No Fuel Used | 0 (0.0%) | 0 (0.0%) |
| Total | 210 (100.0%) | 36 (100.0%) |
Household Vehicle Usage in Allenwood
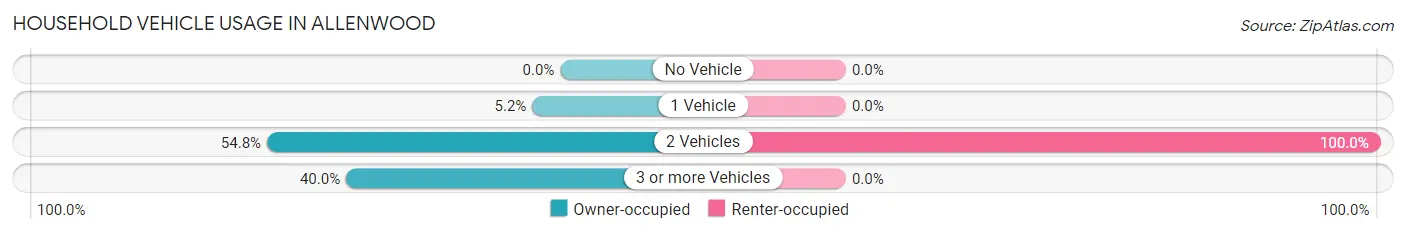
| Vehicles per Household | Owner-occupied | Renter-occupied |
| No Vehicle | 0 (0.0%) | 0 (0.0%) |
| 1 Vehicle | 11 (5.2%) | 0 (0.0%) |
| 2 Vehicles | 115 (54.8%) | 36 (100.0%) |
| 3 or more Vehicles | 84 (40.0%) | 0 (0.0%) |
| Total | 210 (100.0%) | 36 (100.0%) |
Real Estate & Mortgages in Allenwood
Real Estate and Mortgage Overview in Allenwood
| Characteristic | Without Mortgage | With Mortgage |
| Housing Units | 49 | 161 |
| Median Property Value | $545,800 | $629,900 |
| Median Household Income | $170,781 | $96 |
| Monthly Housing Costs | $1,271 | $104 |
| Real Estate Taxes | $9,276 | $0 |
Property Value by Mortgage Status in Allenwood
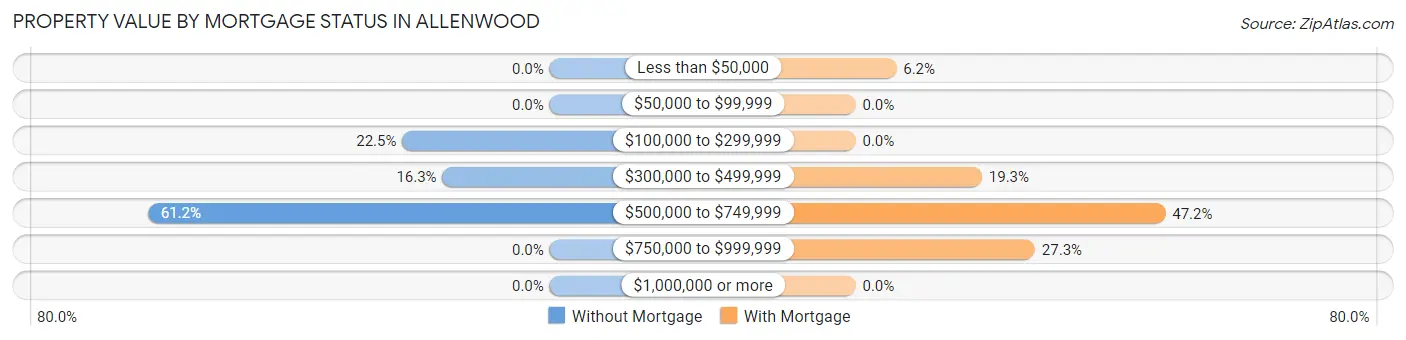
| Property Value | Without Mortgage | With Mortgage |
| Less than $50,000 | 0 (0.0%) | 10 (6.2%) |
| $50,000 to $99,999 | 0 (0.0%) | 0 (0.0%) |
| $100,000 to $299,999 | 11 (22.5%) | 0 (0.0%) |
| $300,000 to $499,999 | 8 (16.3%) | 31 (19.3%) |
| $500,000 to $749,999 | 30 (61.2%) | 76 (47.2%) |
| $750,000 to $999,999 | 0 (0.0%) | 44 (27.3%) |
| $1,000,000 or more | 0 (0.0%) | 0 (0.0%) |
| Total | 49 (100.0%) | 161 (100.0%) |
Household Income by Mortgage Status in Allenwood
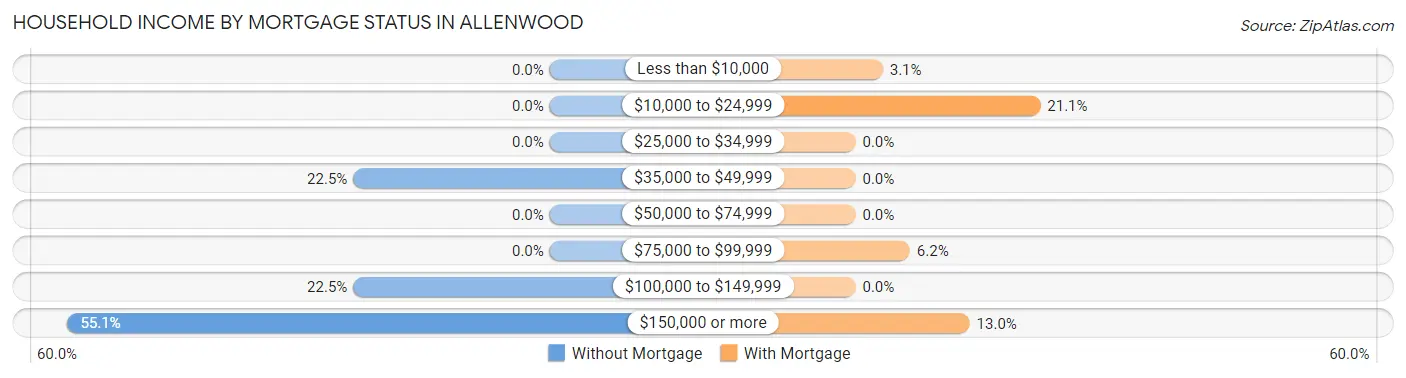
| Household Income | Without Mortgage | With Mortgage |
| Less than $10,000 | 0 (0.0%) | 5 (3.1%) |
| $10,000 to $24,999 | 0 (0.0%) | 34 (21.1%) |
| $25,000 to $34,999 | 0 (0.0%) | 0 (0.0%) |
| $35,000 to $49,999 | 11 (22.5%) | 0 (0.0%) |
| $50,000 to $74,999 | 0 (0.0%) | 0 (0.0%) |
| $75,000 to $99,999 | 0 (0.0%) | 10 (6.2%) |
| $100,000 to $149,999 | 11 (22.5%) | 0 (0.0%) |
| $150,000 or more | 27 (55.1%) | 21 (13.0%) |
| Total | 49 (100.0%) | 161 (100.0%) |
Property Value to Household Income Ratio in Allenwood
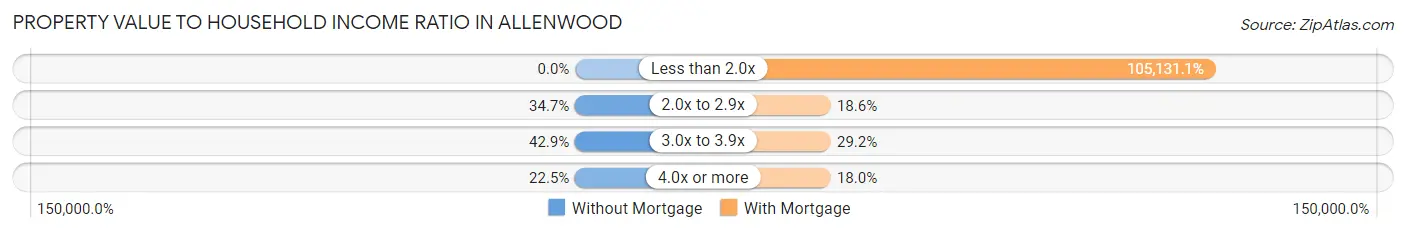
| Value-to-Income Ratio | Without Mortgage | With Mortgage |
| Less than 2.0x | 0 (0.0%) | 169,261 (105,131.1%) |
| 2.0x to 2.9x | 17 (34.7%) | 30 (18.6%) |
| 3.0x to 3.9x | 21 (42.9%) | 47 (29.2%) |
| 4.0x or more | 11 (22.5%) | 29 (18.0%) |
| Total | 49 (100.0%) | 161 (100.0%) |
Real Estate Taxes by Mortgage Status in Allenwood
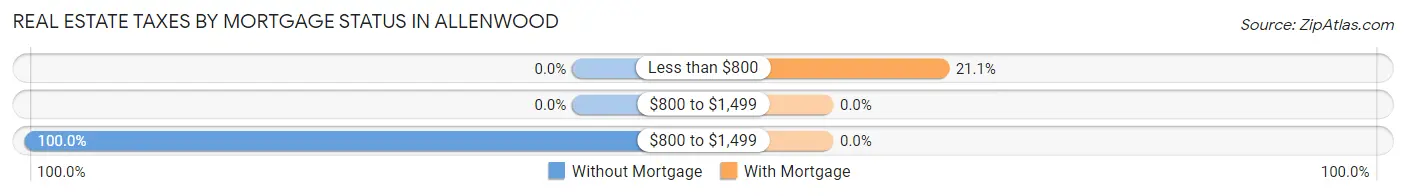
| Property Taxes | Without Mortgage | With Mortgage |
| Less than $800 | 0 (0.0%) | 34 (21.1%) |
| $800 to $1,499 | 0 (0.0%) | 0 (0.0%) |
| $800 to $1,499 | 49 (100.0%) | 0 (0.0%) |
| Total | 49 (100.0%) | 161 (100.0%) |
Health & Disability in Allenwood
Health Insurance Coverage by Age in Allenwood
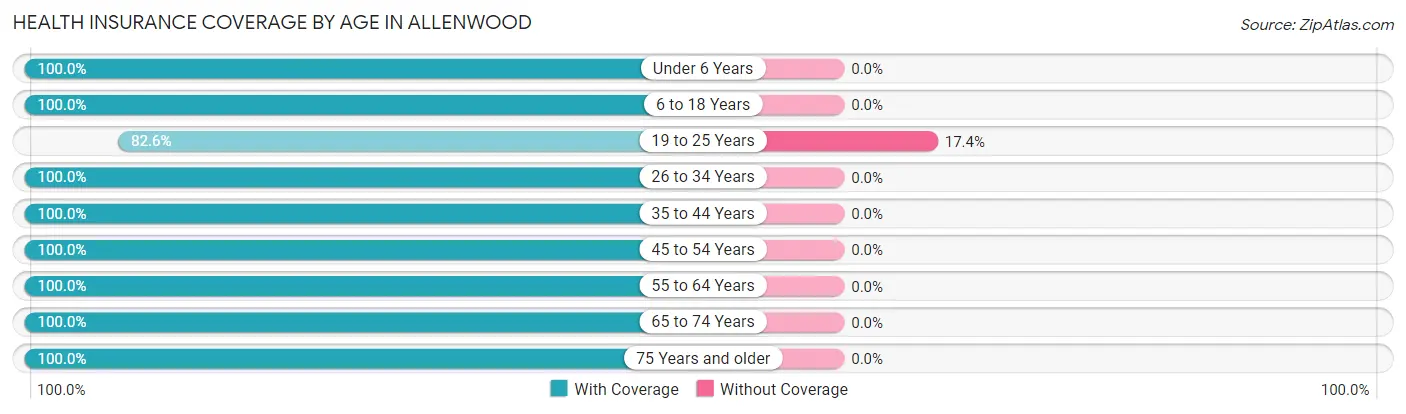
| Age Bracket | With Coverage | Without Coverage |
| Under 6 Years | 21 (100.0%) | 0 (0.0%) |
| 6 to 18 Years | 94 (100.0%) | 0 (0.0%) |
| 19 to 25 Years | 71 (82.6%) | 15 (17.4%) |
| 26 to 34 Years | 28 (100.0%) | 0 (0.0%) |
| 35 to 44 Years | 75 (100.0%) | 0 (0.0%) |
| 45 to 54 Years | 153 (100.0%) | 0 (0.0%) |
| 55 to 64 Years | 46 (100.0%) | 0 (0.0%) |
| 65 to 74 Years | 99 (100.0%) | 0 (0.0%) |
| 75 Years and older | 21 (100.0%) | 0 (0.0%) |
| Total | 608 (97.6%) | 15 (2.4%) |
Health Insurance Coverage by Citizenship Status in Allenwood
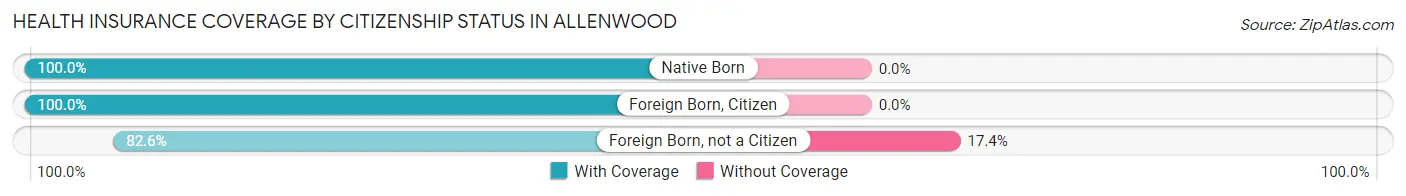
| Citizenship Status | With Coverage | Without Coverage |
| Native Born | 21 (100.0%) | 0 (0.0%) |
| Foreign Born, Citizen | 94 (100.0%) | 0 (0.0%) |
| Foreign Born, not a Citizen | 71 (82.6%) | 15 (17.4%) |
Health Insurance Coverage by Household Income in Allenwood
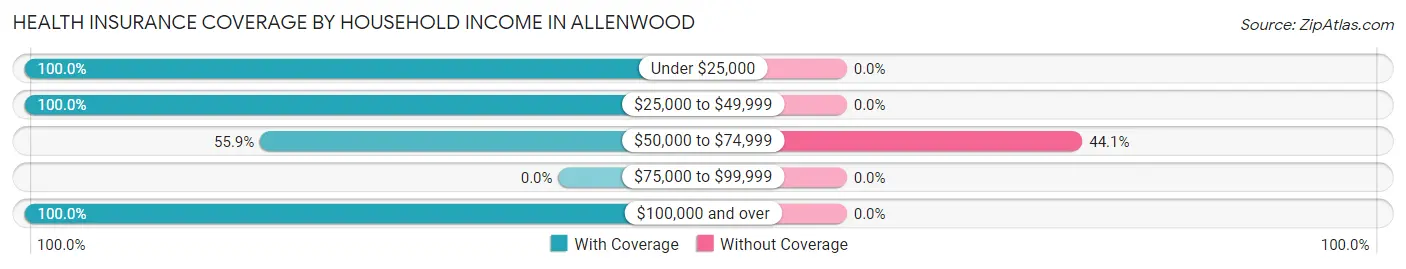
| Household Income | With Coverage | Without Coverage |
| Under $25,000 | 34 (100.0%) | 0 (0.0%) |
| $25,000 to $49,999 | 47 (100.0%) | 0 (0.0%) |
| $50,000 to $74,999 | 19 (55.9%) | 15 (44.1%) |
| $75,000 to $99,999 | 0 (0.0%) | 0 (0.0%) |
| $100,000 and over | 508 (100.0%) | 0 (0.0%) |
Public vs Private Health Insurance Coverage by Age in Allenwood
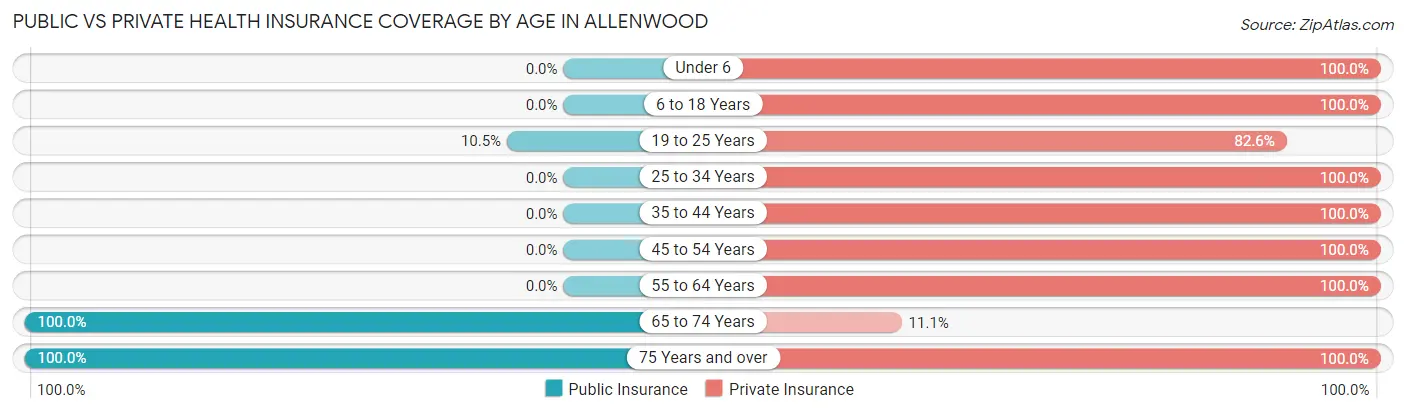
| Age Bracket | Public Insurance | Private Insurance |
| Under 6 | 0 (0.0%) | 21 (100.0%) |
| 6 to 18 Years | 0 (0.0%) | 94 (100.0%) |
| 19 to 25 Years | 9 (10.5%) | 71 (82.6%) |
| 25 to 34 Years | 0 (0.0%) | 28 (100.0%) |
| 35 to 44 Years | 0 (0.0%) | 75 (100.0%) |
| 45 to 54 Years | 0 (0.0%) | 153 (100.0%) |
| 55 to 64 Years | 0 (0.0%) | 46 (100.0%) |
| 65 to 74 Years | 99 (100.0%) | 11 (11.1%) |
| 75 Years and over | 21 (100.0%) | 21 (100.0%) |
| Total | 129 (20.7%) | 520 (83.5%) |
Disability Status by Sex by Age in Allenwood
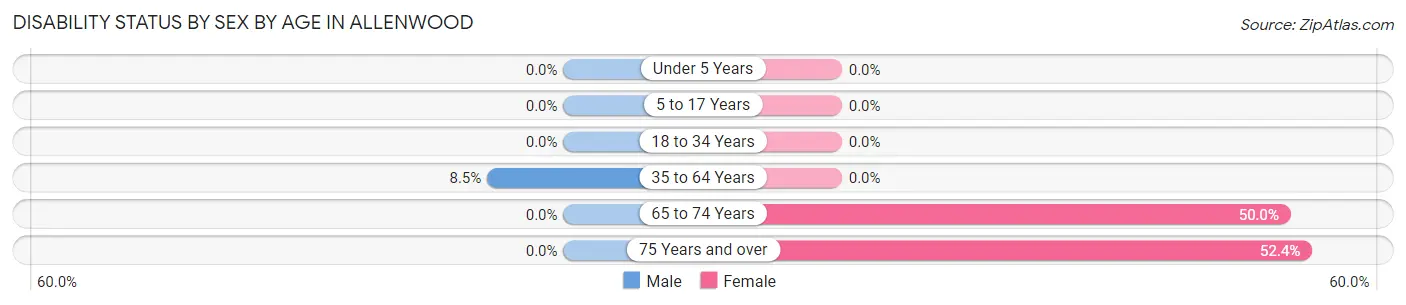
| Age Bracket | Male | Female |
| Under 5 Years | 0 (0.0%) | 0 (0.0%) |
| 5 to 17 Years | 0 (0.0%) | 0 (0.0%) |
| 18 to 34 Years | 0 (0.0%) | 0 (0.0%) |
| 35 to 64 Years | 9 (8.5%) | 0 (0.0%) |
| 65 to 74 Years | 0 (0.0%) | 11 (50.0%) |
| 75 Years and over | 0 (0.0%) | 11 (52.4%) |
Disability Class by Sex by Age in Allenwood
Disability Class: Hearing Difficulty
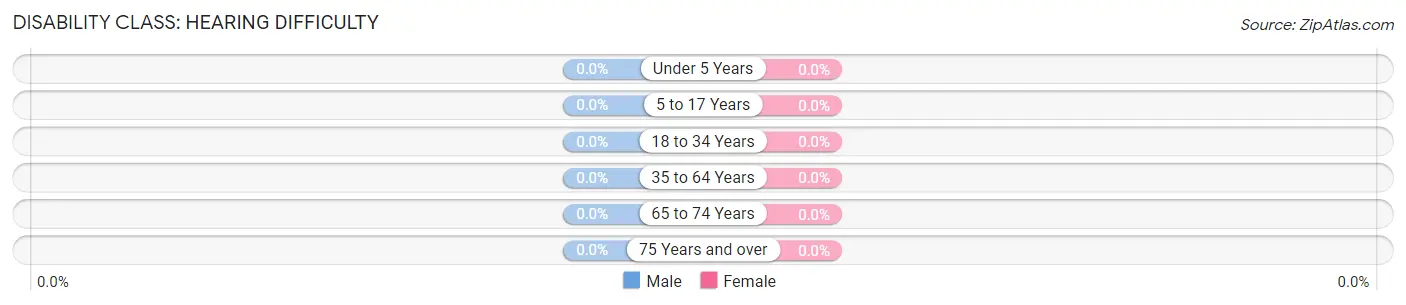
| Age Bracket | Male | Female |
| Under 5 Years | 0 (0.0%) | 0 (0.0%) |
| 5 to 17 Years | 0 (0.0%) | 0 (0.0%) |
| 18 to 34 Years | 0 (0.0%) | 0 (0.0%) |
| 35 to 64 Years | 0 (0.0%) | 0 (0.0%) |
| 65 to 74 Years | 0 (0.0%) | 0 (0.0%) |
| 75 Years and over | 0 (0.0%) | 0 (0.0%) |
Disability Class: Vision Difficulty
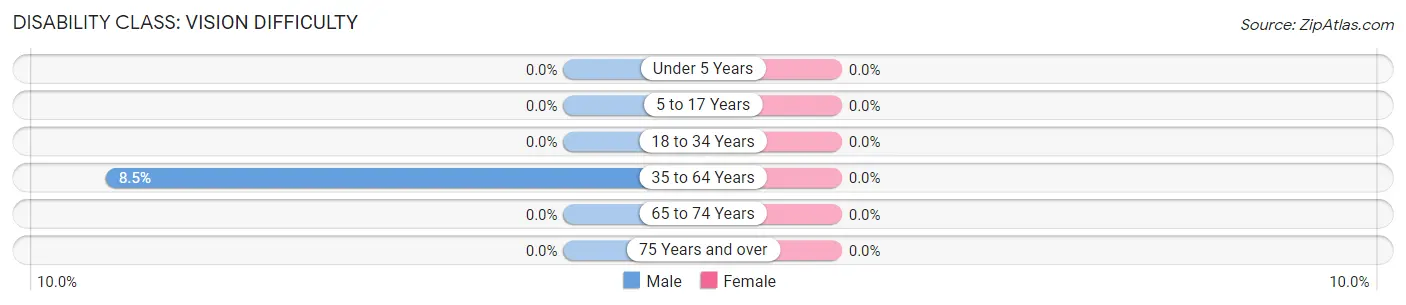
| Age Bracket | Male | Female |
| Under 5 Years | 0 (0.0%) | 0 (0.0%) |
| 5 to 17 Years | 0 (0.0%) | 0 (0.0%) |
| 18 to 34 Years | 0 (0.0%) | 0 (0.0%) |
| 35 to 64 Years | 9 (8.5%) | 0 (0.0%) |
| 65 to 74 Years | 0 (0.0%) | 0 (0.0%) |
| 75 Years and over | 0 (0.0%) | 0 (0.0%) |
Disability Class: Cognitive Difficulty

| Age Bracket | Male | Female |
| 5 to 17 Years | 0 (0.0%) | 0 (0.0%) |
| 18 to 34 Years | 0 (0.0%) | 0 (0.0%) |
| 35 to 64 Years | 0 (0.0%) | 0 (0.0%) |
| 65 to 74 Years | 0 (0.0%) | 0 (0.0%) |
| 75 Years and over | 0 (0.0%) | 0 (0.0%) |
Disability Class: Ambulatory Difficulty
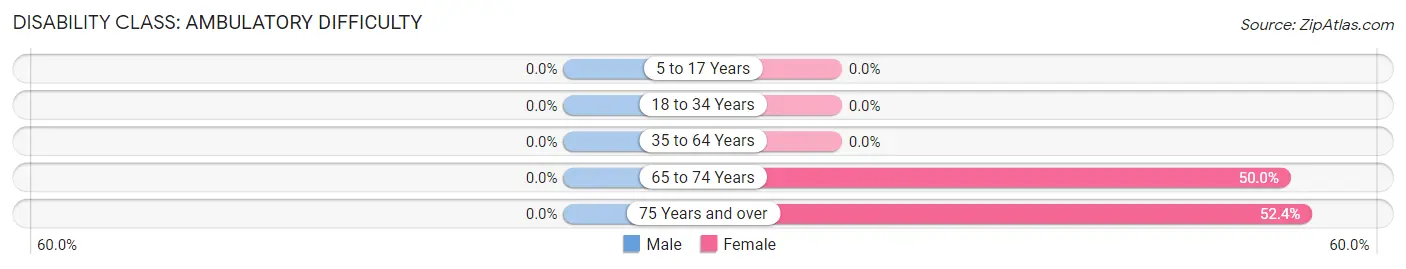
| Age Bracket | Male | Female |
| 5 to 17 Years | 0 (0.0%) | 0 (0.0%) |
| 18 to 34 Years | 0 (0.0%) | 0 (0.0%) |
| 35 to 64 Years | 0 (0.0%) | 0 (0.0%) |
| 65 to 74 Years | 0 (0.0%) | 11 (50.0%) |
| 75 Years and over | 0 (0.0%) | 11 (52.4%) |
Disability Class: Self-Care Difficulty
| Age Bracket | Male | Female |
| 5 to 17 Years | 0 (0.0%) | 0 (0.0%) |
| 18 to 34 Years | 0 (0.0%) | 0 (0.0%) |
| 35 to 64 Years | 0 (0.0%) | 0 (0.0%) |
| 65 to 74 Years | 0 (0.0%) | 0 (0.0%) |
| 75 Years and over | 0 (0.0%) | 0 (0.0%) |
Technology Access in Allenwood
Computing Device Access in Allenwood
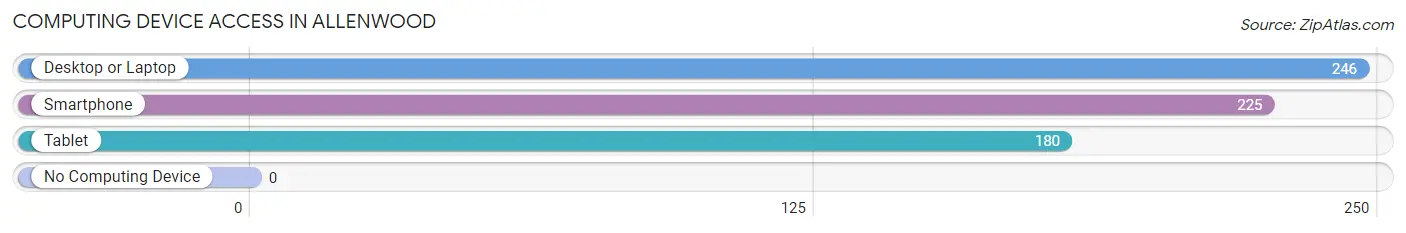
| Device Type | # Households | % Households |
| Desktop or Laptop | 246 | 100.0% |
| Smartphone | 225 | 91.5% |
| Tablet | 180 | 73.2% |
| No Computing Device | 0 | 0.0% |
| Total | 246 | 100.0% |
Internet Access in Allenwood
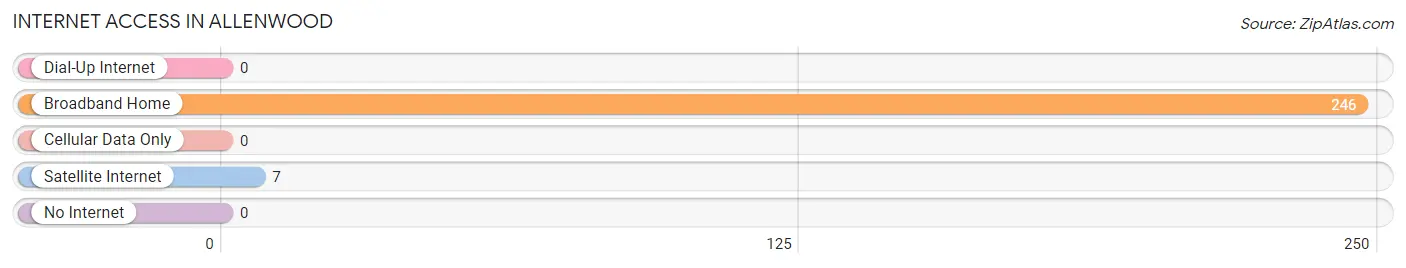
| Internet Type | # Households | % Households |
| Dial-Up Internet | 0 | 0.0% |
| Broadband Home | 246 | 100.0% |
| Cellular Data Only | 0 | 0.0% |
| Satellite Internet | 7 | 2.9% |
| No Internet | 0 | 0.0% |
| Total | 246 | 100.0% |
Allenwood Summary
Allenwood is a small unincorporated community located in Ocean County, New Jersey. It is situated in the northern part of the county, near the border with Monmouth County. The community is located within the boundaries of Wall Township, and is bordered by the communities of Belmar, Manasquan, and Spring Lake. The population of Allenwood was estimated to be 1,845 in 2019.
History
The area that is now Allenwood was originally inhabited by the Lenape Native Americans. The first European settlers arrived in the area in the late 17th century, and the community was established in 1790. The community was named after the Allen family, who were among the first settlers in the area.
In the 19th century, Allenwood was a popular summer resort destination for wealthy New Yorkers. The community was home to several large hotels, including the Allenwood Hotel, which was built in 1875. The hotel was destroyed by fire in 1891, but was rebuilt and reopened in 1895.
Geography
Allenwood is located in northern Ocean County, near the border with Monmouth County. It is situated in Wall Township, and is bordered by the communities of Belmar, Manasquan, and Spring Lake. The community is located on the Atlantic Ocean, and is approximately 10 miles south of Long Branch.
The climate in Allenwood is humid subtropical, with hot, humid summers and mild winters. The average annual temperature is around 60°F, and the average annual precipitation is around 45 inches.
Economy
The economy of Allenwood is largely based on tourism and recreation. The community is home to several popular beaches, including Allenwood Beach, which is a popular destination for swimming, fishing, and other water activities. The community is also home to several restaurants, bars, and shops.
Demographics
As of 2019, the population of Allenwood was estimated to be 1,845. The racial makeup of the community was 94.3% White, 2.2% Hispanic or Latino, 1.2% Asian, and 0.9% African American. The median household income was $76,944, and the median home value was $521,000.
Conclusion
Allenwood is a small unincorporated community located in Ocean County, New Jersey. It is situated in the northern part of the county, near the border with Monmouth County. The community is located within the boundaries of Wall Township, and is bordered by the communities of Belmar, Manasquan, and Spring Lake. The population of Allenwood was estimated to be 1,845 in 2019. The economy of Allenwood is largely based on tourism and recreation, and the community is home to several popular beaches, restaurants, bars, and shops. The racial makeup of the community was 94.3% White, 2.2% Hispanic or Latino, 1.2% Asian, and 0.9% African American. The median household income was $76,944, and the median home value was $521,000.
Common Questions
What is Per Capita Income in Allenwood?
Per Capita income in Allenwood is $59,249.
What is the Median Family Income in Allenwood?
Median Family Income in Allenwood is $207,750.
What is the Median Household income in Allenwood?
Median Household Income in Allenwood is $153,750.
What is Income or Wage Gap in Allenwood?
Income or Wage Gap in Allenwood is 69.5%.
Women in Allenwood earn 30.5 cents for every dollar earned by a man.
What is Inequality or Gini Index in Allenwood?
Inequality or Gini Index in Allenwood is 0.42.
What is the Total Population of Allenwood?
Total Population of Allenwood is 623.
What is the Total Male Population of Allenwood?
Total Male Population of Allenwood is 270.
What is the Total Female Population of Allenwood?
Total Female Population of Allenwood is 353.
What is the Ratio of Males per 100 Females in Allenwood?
There are 76.49 Males per 100 Females in Allenwood.
What is the Ratio of Females per 100 Males in Allenwood?
There are 130.74 Females per 100 Males in Allenwood.
What is the Median Population Age in Allenwood?
Median Population Age in Allenwood is 45.9 Years.
What is the Average Family Size in Allenwood
Average Family Size in Allenwood is 3.3 People.
What is the Average Household Size in Allenwood
Average Household Size in Allenwood is 2.5 People.
How Large is the Labor Force in Allenwood?
There are 412 People in the Labor Forcein in Allenwood.
What is the Percentage of People in the Labor Force in Allenwood?
76.3% of People are in the Labor Force in Allenwood.
What is the Unemployment Rate in Allenwood?
Unemployment Rate in Allenwood is 6.3%.