Peapack and Gladstone borough, NJ Map & Demographics
Peapack and Gladstone borough Overview
$103,719
PER CAPITA INCOME
$221,000
AVG FAMILY INCOME
$183,125
AVG HOUSEHOLD INCOME
52.4%
WAGE / INCOME GAP [ % ]
47.6¢/ $1
WAGE / INCOME GAP [ $ ]
0.55
INEQUALITY / GINI INDEX
2,561
TOTAL POPULATION
1,208
MALE POPULATION
1,353
FEMALE POPULATION
89.28
MALES / 100 FEMALES
112.00
FEMALES / 100 MALES
44.9
MEDIAN AGE
3.0
AVG FAMILY SIZE
2.6
AVG HOUSEHOLD SIZE
1,236
LABOR FORCE [ PEOPLE ]
61.2%
PERCENT IN LABOR FORCE
1.8%
UNEMPLOYMENT RATE
Income in Peapack and Gladstone borough
Income Overview in Peapack and Gladstone borough
Per Capita Income in Peapack and Gladstone borough is $103,719, while median incomes of families and households are $221,000 and $183,125 respectively.
| Characteristic | Number | Measure |
| Per Capita Income | 2,561 | $103,719 |
| Median Family Income | 724 | $221,000 |
| Mean Family Income | 724 | $323,864 |
| Median Household Income | 940 | $183,125 |
| Mean Household Income | 940 | $277,038 |
| Income Deficit | 724 | $0 |
| Wage / Income Gap (%) | 2,561 | 52.39% |
| Wage / Income Gap ($) | 2,561 | 47.61¢ per $1 |
| Gini / Inequality Index | 2,561 | 0.55 |
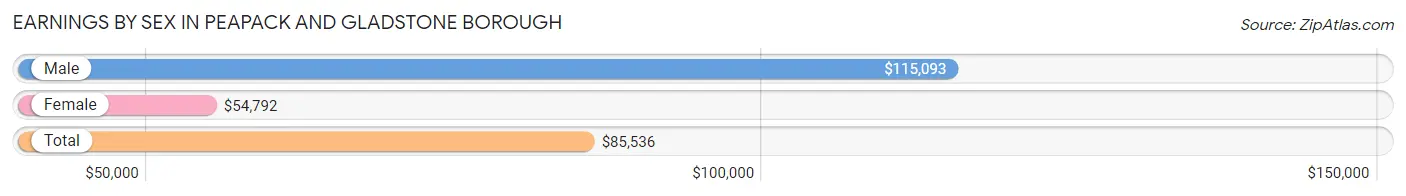
Earnings by Sex in Peapack and Gladstone borough
Average Earnings in Peapack and Gladstone borough are $85,536, $115,093 for men and $54,792 for women, a difference of 52.4%.
| Sex | Number | Average Earnings |
| Male | 702 (53.7%) | $115,093 |
| Female | 605 (46.3%) | $54,792 |
| Total | 1,307 (100.0%) | $85,536 |
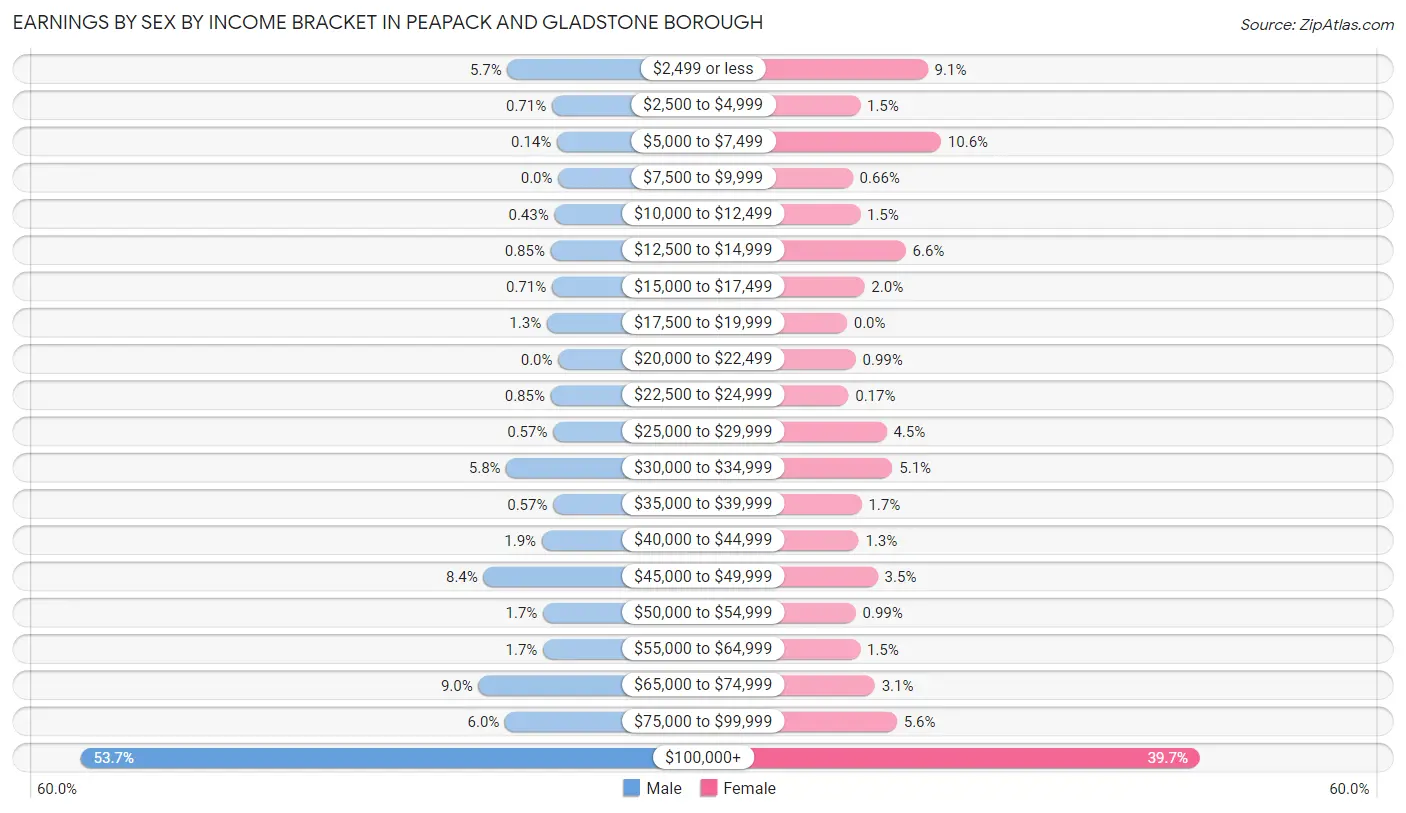
Earnings by Sex by Income Bracket in Peapack and Gladstone borough
The most common earnings brackets in Peapack and Gladstone borough are $100,000+ for men (377 | 53.7%) and $100,000+ for women (240 | 39.7%).
| Income | Male | Female |
| $2,499 or less | 40 (5.7%) | 55 (9.1%) |
| $2,500 to $4,999 | 5 (0.7%) | 9 (1.5%) |
| $5,000 to $7,499 | 1 (0.1%) | 64 (10.6%) |
| $7,500 to $9,999 | 0 (0.0%) | 4 (0.7%) |
| $10,000 to $12,499 | 3 (0.4%) | 9 (1.5%) |
| $12,500 to $14,999 | 6 (0.9%) | 40 (6.6%) |
| $15,000 to $17,499 | 5 (0.7%) | 12 (2.0%) |
| $17,500 to $19,999 | 9 (1.3%) | 0 (0.0%) |
| $20,000 to $22,499 | 0 (0.0%) | 6 (1.0%) |
| $22,500 to $24,999 | 6 (0.9%) | 1 (0.2%) |
| $25,000 to $29,999 | 4 (0.6%) | 27 (4.5%) |
| $30,000 to $34,999 | 41 (5.8%) | 31 (5.1%) |
| $35,000 to $39,999 | 4 (0.6%) | 10 (1.7%) |
| $40,000 to $44,999 | 13 (1.8%) | 8 (1.3%) |
| $45,000 to $49,999 | 59 (8.4%) | 21 (3.5%) |
| $50,000 to $54,999 | 12 (1.7%) | 6 (1.0%) |
| $55,000 to $64,999 | 12 (1.7%) | 9 (1.5%) |
| $65,000 to $74,999 | 63 (9.0%) | 19 (3.1%) |
| $75,000 to $99,999 | 42 (6.0%) | 34 (5.6%) |
| $100,000+ | 377 (53.7%) | 240 (39.7%) |
| Total | 702 (100.0%) | 605 (100.0%) |
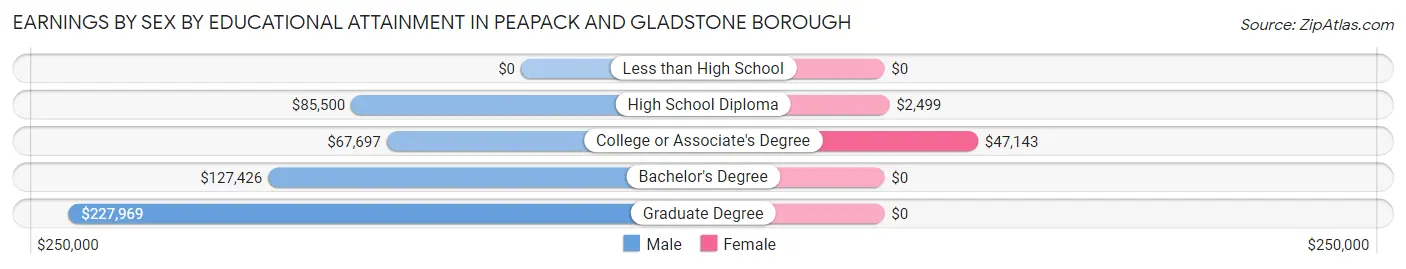
Earnings by Sex by Educational Attainment in Peapack and Gladstone borough
Average earnings in Peapack and Gladstone borough are $116,759 for men and $63,889 for women, a difference of 45.3%. Men with an educational attainment of graduate degree enjoy the highest average annual earnings of $227,969, while those with college or associate's degree education earn the least with $67,697. Women with an educational attainment of college or associate's degree earn the most with the average annual earnings of $47,143, while those with high school diploma education have the smallest earnings of $2,499.
| Educational Attainment | Male Income | Female Income |
| Less than High School | - | - |
| High School Diploma | $85,500 | $2,499 |
| College or Associate's Degree | $67,697 | $47,143 |
| Bachelor's Degree | $127,426 | $0 |
| Graduate Degree | $227,969 | $0 |
| Total | $116,759 | $63,889 |
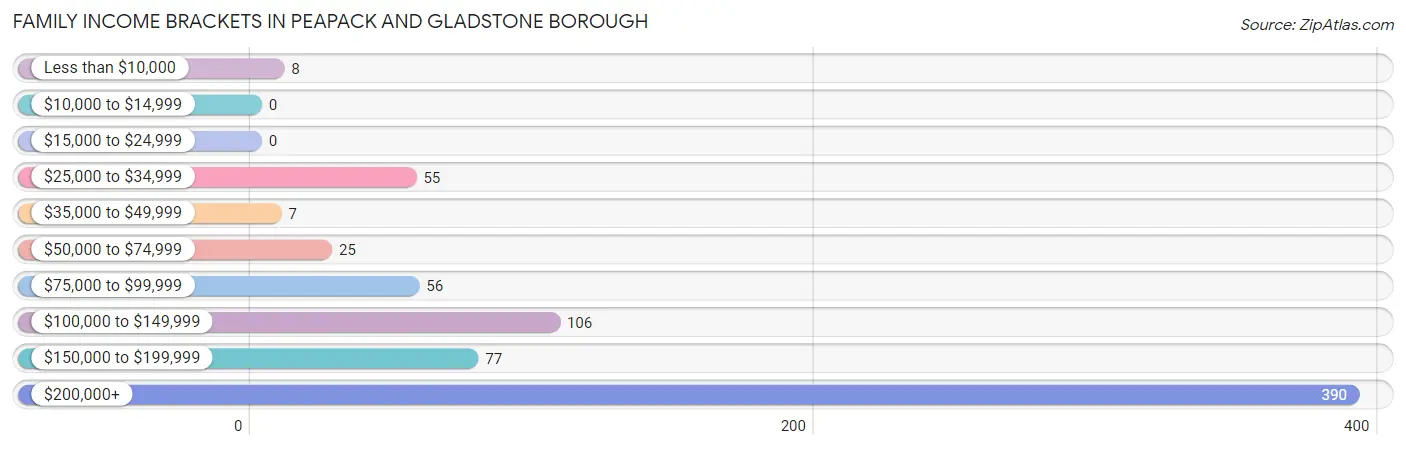
Family Income in Peapack and Gladstone borough
Family Income Brackets in Peapack and Gladstone borough
According to the Peapack and Gladstone borough family income data, there are 390 families falling into the $200,000+ income range, which is the most common income bracket and makes up 53.9% of all families.
| Income Bracket | # Families | % Families |
| Less than $10,000 | 8 | 1.1% |
| $10,000 to $14,999 | 0 | 0.0% |
| $15,000 to $24,999 | 0 | 0.0% |
| $25,000 to $34,999 | 55 | 7.6% |
| $35,000 to $49,999 | 7 | 1.0% |
| $50,000 to $74,999 | 25 | 3.5% |
| $75,000 to $99,999 | 56 | 7.7% |
| $100,000 to $149,999 | 106 | 14.6% |
| $150,000 to $199,999 | 77 | 10.6% |
| $200,000+ | 390 | 53.9% |
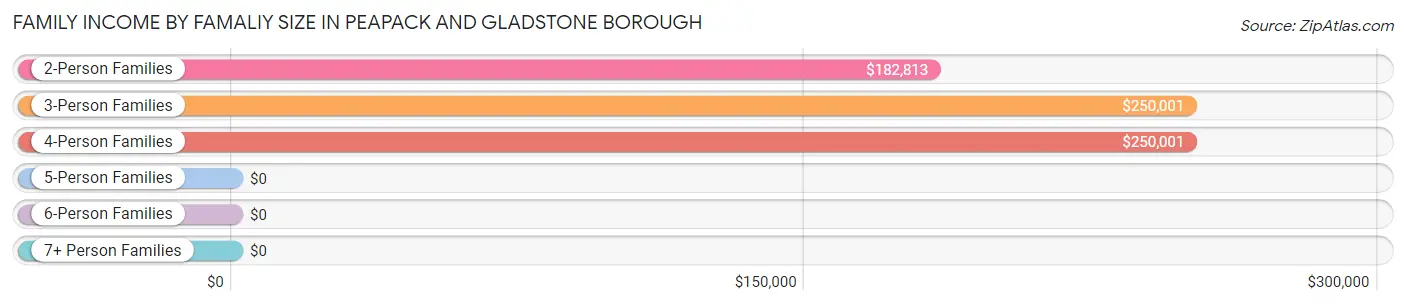
Family Income by Famaliy Size in Peapack and Gladstone borough
3-person families (154 | 21.3%) account for the highest median family income in Peapack and Gladstone borough with $250,001 per family, while 2-person families (347 | 47.9%) have the highest median income of $91,406 per family member.
| Income Bracket | # Families | Median Income |
| 2-Person Families | 347 (47.9%) | $182,813 |
| 3-Person Families | 154 (21.3%) | $250,001 |
| 4-Person Families | 146 (20.2%) | $250,001 |
| 5-Person Families | 68 (9.4%) | $0 |
| 6-Person Families | 0 (0.0%) | $0 |
| 7+ Person Families | 9 (1.2%) | $0 |
| Total | 724 (100.0%) | $221,000 |
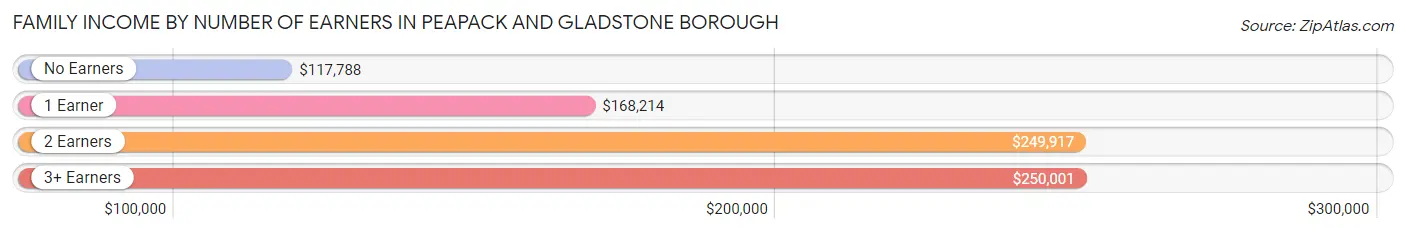
Family Income by Number of Earners in Peapack and Gladstone borough
The median family income in Peapack and Gladstone borough is $221,000, with families comprising 3+ earners (80) having the highest median family income of $250,001, while families with no earners (61) have the lowest median family income of $117,788, accounting for 11.1% and 8.4% of families, respectively.
| Number of Earners | # Families | Median Income |
| No Earners | 61 (8.4%) | $117,788 |
| 1 Earner | 270 (37.3%) | $168,214 |
| 2 Earners | 313 (43.2%) | $249,917 |
| 3+ Earners | 80 (11.1%) | $250,001 |
| Total | 724 (100.0%) | $221,000 |
Household Income in Peapack and Gladstone borough
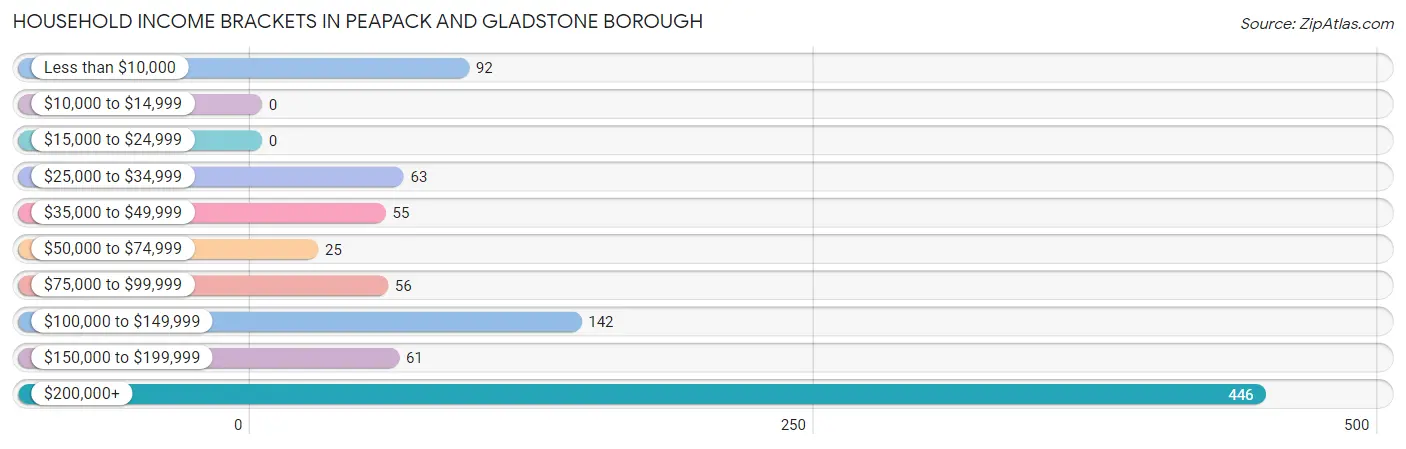
Household Income Brackets in Peapack and Gladstone borough
With 446 households falling in the category, the $200,000+ income range is the most frequent in Peapack and Gladstone borough, accounting for 47.4% of all households.
| Income Bracket | # Households | % Households |
| Less than $10,000 | 92 | 9.8% |
| $10,000 to $14,999 | 0 | 0.0% |
| $15,000 to $24,999 | 0 | 0.0% |
| $25,000 to $34,999 | 63 | 6.7% |
| $35,000 to $49,999 | 55 | 5.9% |
| $50,000 to $74,999 | 25 | 2.7% |
| $75,000 to $99,999 | 56 | 6.0% |
| $100,000 to $149,999 | 142 | 15.1% |
| $150,000 to $199,999 | 61 | 6.5% |
| $200,000+ | 446 | 47.4% |
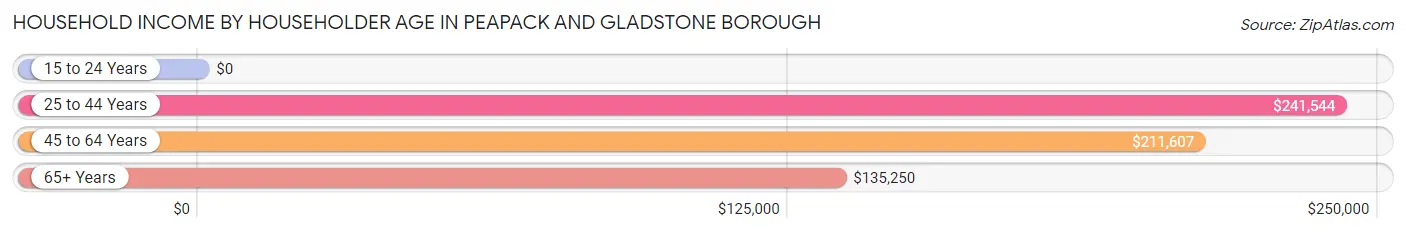
Household Income by Householder Age in Peapack and Gladstone borough
The median household income in Peapack and Gladstone borough is $183,125, with the highest median household income of $241,544 found in the 25 to 44 years age bracket for the primary householder. A total of 151 households (16.1%) fall into this category. Meanwhile, the 15 to 24 years age bracket for the primary householder has the lowest median household income of $0, with 36 households (3.8%) in this group.
| Income Bracket | # Households | Median Income |
| 15 to 24 Years | 36 (3.8%) | $0 |
| 25 to 44 Years | 151 (16.1%) | $241,544 |
| 45 to 64 Years | 483 (51.4%) | $211,607 |
| 65+ Years | 270 (28.7%) | $135,250 |
| Total | 940 (100.0%) | $183,125 |
Poverty in Peapack and Gladstone borough
Income Below Poverty by Sex and Age in Peapack and Gladstone borough
With 2.4% poverty level for males and 6.7% for females among the residents of Peapack and Gladstone borough, 18 to 24 year old males and 75 year old and over females are the most vulnerable to poverty, with 11 males (15.7%) and 32 females (26.7%) in their respective age groups living below the poverty level.
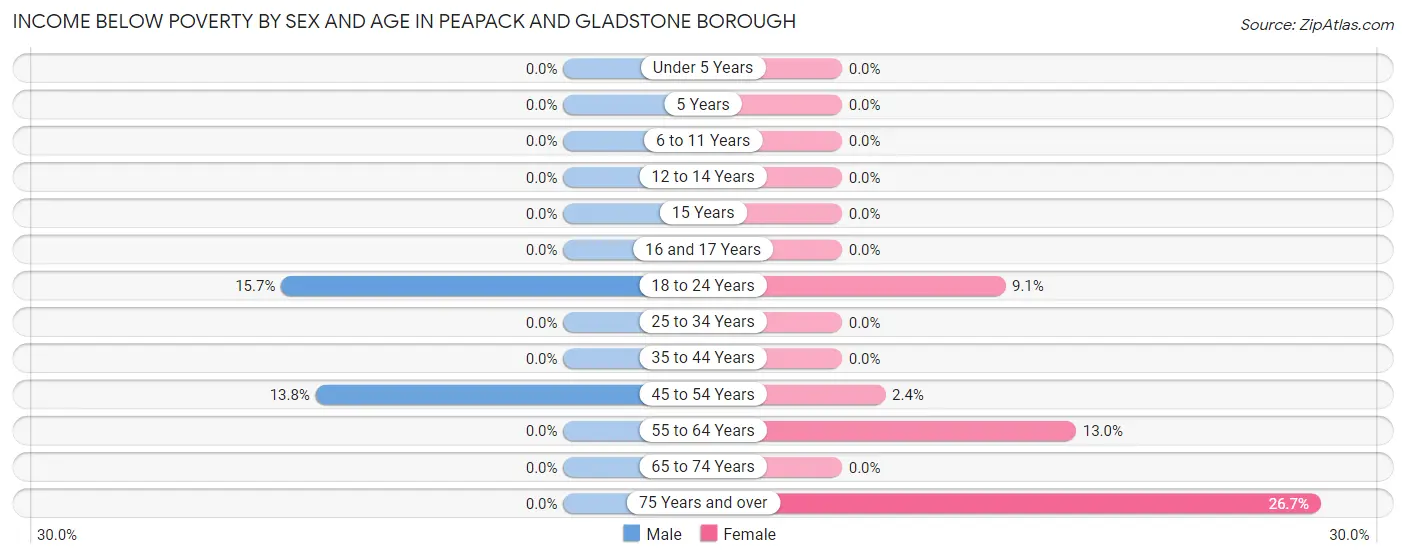
| Age Bracket | Male | Female |
| Under 5 Years | 0 (0.0%) | 0 (0.0%) |
| 5 Years | 0 (0.0%) | 0 (0.0%) |
| 6 to 11 Years | 0 (0.0%) | 0 (0.0%) |
| 12 to 14 Years | 0 (0.0%) | 0 (0.0%) |
| 15 Years | 0 (0.0%) | 0 (0.0%) |
| 16 and 17 Years | 0 (0.0%) | 0 (0.0%) |
| 18 to 24 Years | 11 (15.7%) | 9 (9.1%) |
| 25 to 34 Years | 0 (0.0%) | 0 (0.0%) |
| 35 to 44 Years | 0 (0.0%) | 0 (0.0%) |
| 45 to 54 Years | 16 (13.8%) | 4 (2.4%) |
| 55 to 64 Years | 0 (0.0%) | 40 (13.0%) |
| 65 to 74 Years | 0 (0.0%) | 0 (0.0%) |
| 75 Years and over | 0 (0.0%) | 32 (26.7%) |
| Total | 27 (2.4%) | 85 (6.7%) |
Income Above Poverty by Sex and Age in Peapack and Gladstone borough
According to the poverty statistics in Peapack and Gladstone borough, males aged under 5 years and females aged under 5 years are the age groups that are most secure financially, with 100.0% of males and 100.0% of females in these age groups living above the poverty line.
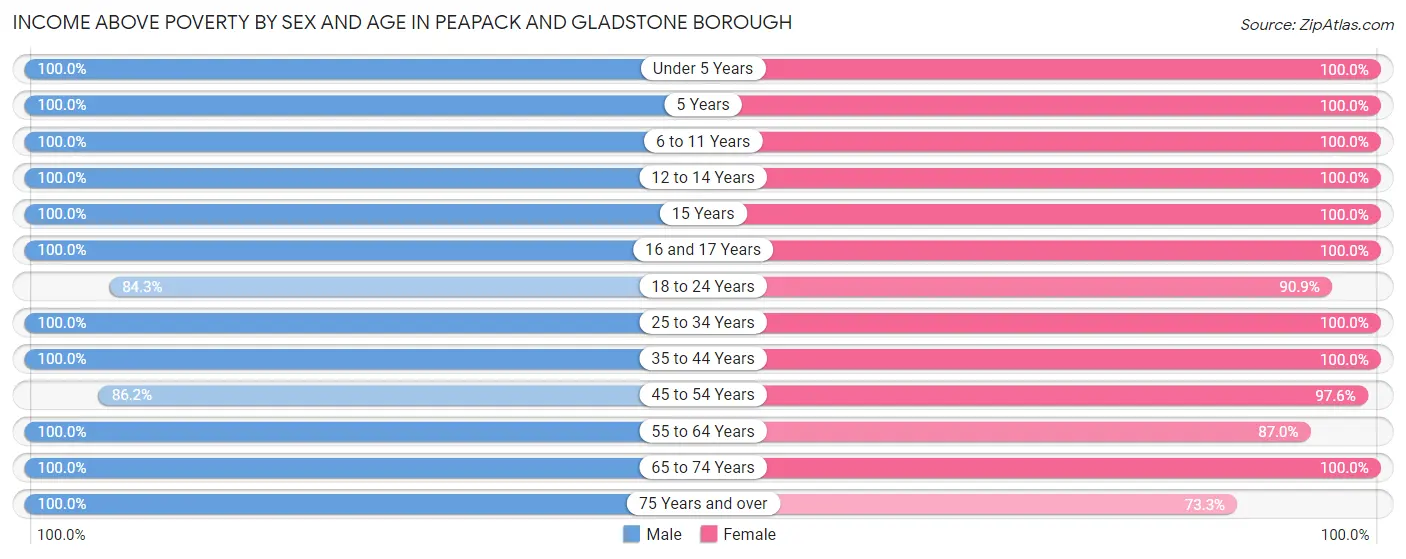
| Age Bracket | Male | Female |
| Under 5 Years | 43 (100.0%) | 93 (100.0%) |
| 5 Years | 13 (100.0%) | 2 (100.0%) |
| 6 to 11 Years | 110 (100.0%) | 59 (100.0%) |
| 12 to 14 Years | 22 (100.0%) | 145 (100.0%) |
| 15 Years | 13 (100.0%) | 14 (100.0%) |
| 16 and 17 Years | 35 (100.0%) | 13 (100.0%) |
| 18 to 24 Years | 59 (84.3%) | 90 (90.9%) |
| 25 to 34 Years | 95 (100.0%) | 11 (100.0%) |
| 35 to 44 Years | 139 (100.0%) | 156 (100.0%) |
| 45 to 54 Years | 100 (86.2%) | 162 (97.6%) |
| 55 to 64 Years | 201 (100.0%) | 267 (87.0%) |
| 65 to 74 Years | 210 (100.0%) | 80 (100.0%) |
| 75 Years and over | 76 (100.0%) | 88 (73.3%) |
| Total | 1,116 (97.6%) | 1,180 (93.3%) |
Income Below Poverty Among Married-Couple Families in Peapack and Gladstone borough
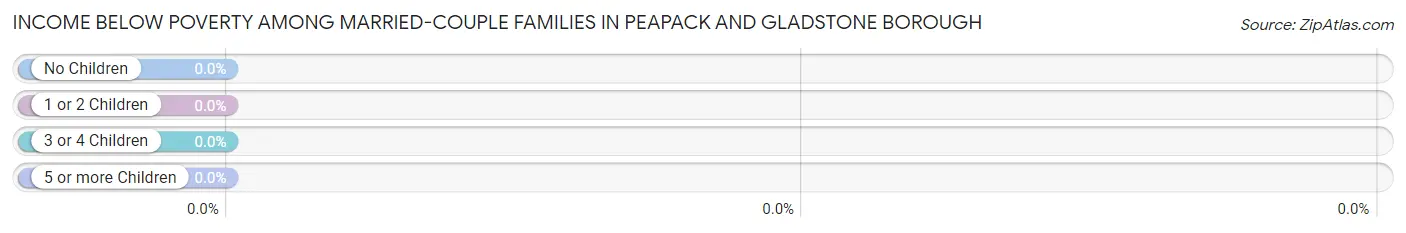
| Children | Above Poverty | Below Poverty |
| No Children | 318 (100.0%) | 0 (0.0%) |
| 1 or 2 Children | 213 (100.0%) | 0 (0.0%) |
| 3 or 4 Children | 47 (100.0%) | 0 (0.0%) |
| 5 or more Children | 9 (100.0%) | 0 (0.0%) |
| Total | 587 (100.0%) | 0 (0.0%) |
Income Below Poverty Among Single-Parent Households in Peapack and Gladstone borough
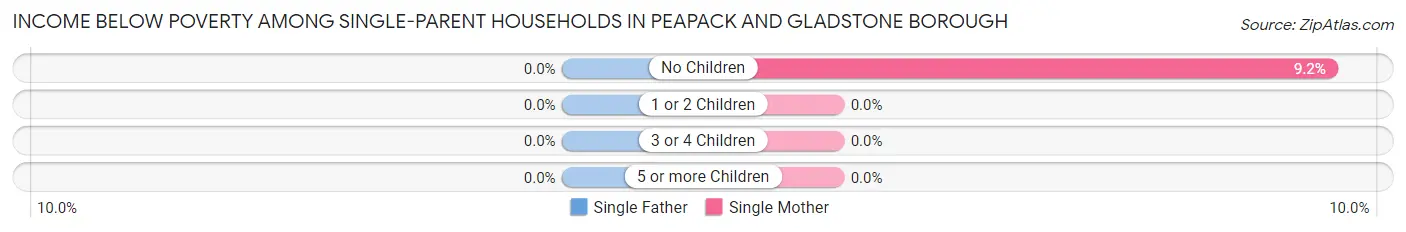
| Children | Single Father | Single Mother |
| No Children | 0 (0.0%) | 8 (9.2%) |
| 1 or 2 Children | 0 (0.0%) | 0 (0.0%) |
| 3 or 4 Children | 0 (0.0%) | 0 (0.0%) |
| 5 or more Children | 0 (0.0%) | 0 (0.0%) |
| Total | 0 (0.0%) | 8 (7.8%) |
Income Below Poverty Among Married-Couple vs Single-Parent Households in Peapack and Gladstone borough
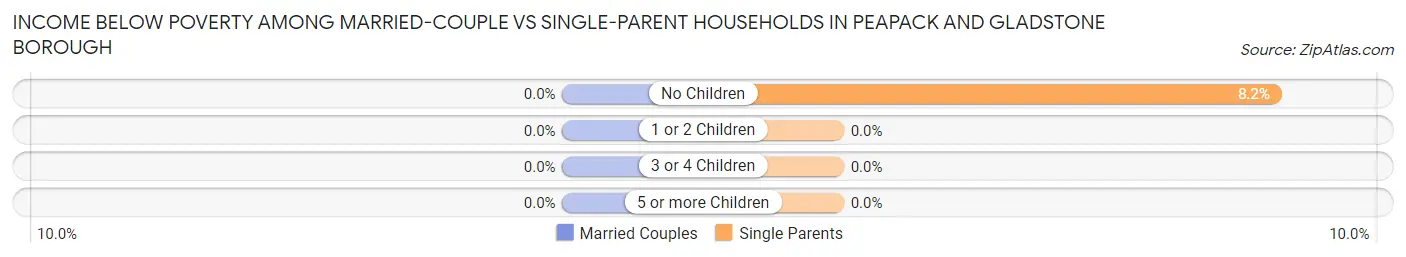
| Children | Married-Couple Families | Single-Parent Households |
| No Children | 0 (0.0%) | 8 (8.2%) |
| 1 or 2 Children | 0 (0.0%) | 0 (0.0%) |
| 3 or 4 Children | 0 (0.0%) | 0 (0.0%) |
| 5 or more Children | 0 (0.0%) | 0 (0.0%) |
| Total | 0 (0.0%) | 8 (5.8%) |
Race in Peapack and Gladstone borough
The most populous races in Peapack and Gladstone borough are White / Caucasian (2,215 | 86.5%), Hispanic or Latino (258 | 10.1%), and Two or more Races (127 | 5.0%).
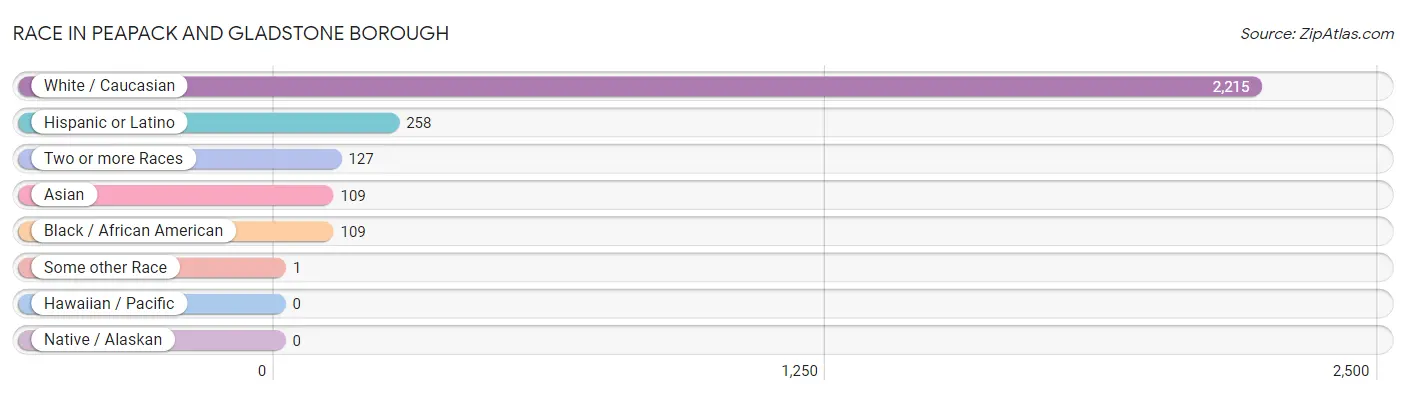
| Race | # Population | % Population |
| Asian | 109 | 4.3% |
| Black / African American | 109 | 4.3% |
| Hawaiian / Pacific | 0 | 0.0% |
| Hispanic or Latino | 258 | 10.1% |
| Native / Alaskan | 0 | 0.0% |
| White / Caucasian | 2,215 | 86.5% |
| Two or more Races | 127 | 5.0% |
| Some other Race | 1 | 0.0% |
| Total | 2,561 | 100.0% |
Ancestry in Peapack and Gladstone borough
The most populous ancestries reported in Peapack and Gladstone borough are German (428 | 16.7%), Irish (418 | 16.3%), English (385 | 15.0%), Italian (333 | 13.0%), and Dutch (185 | 7.2%), together accounting for 68.3% of all Peapack and Gladstone borough residents.
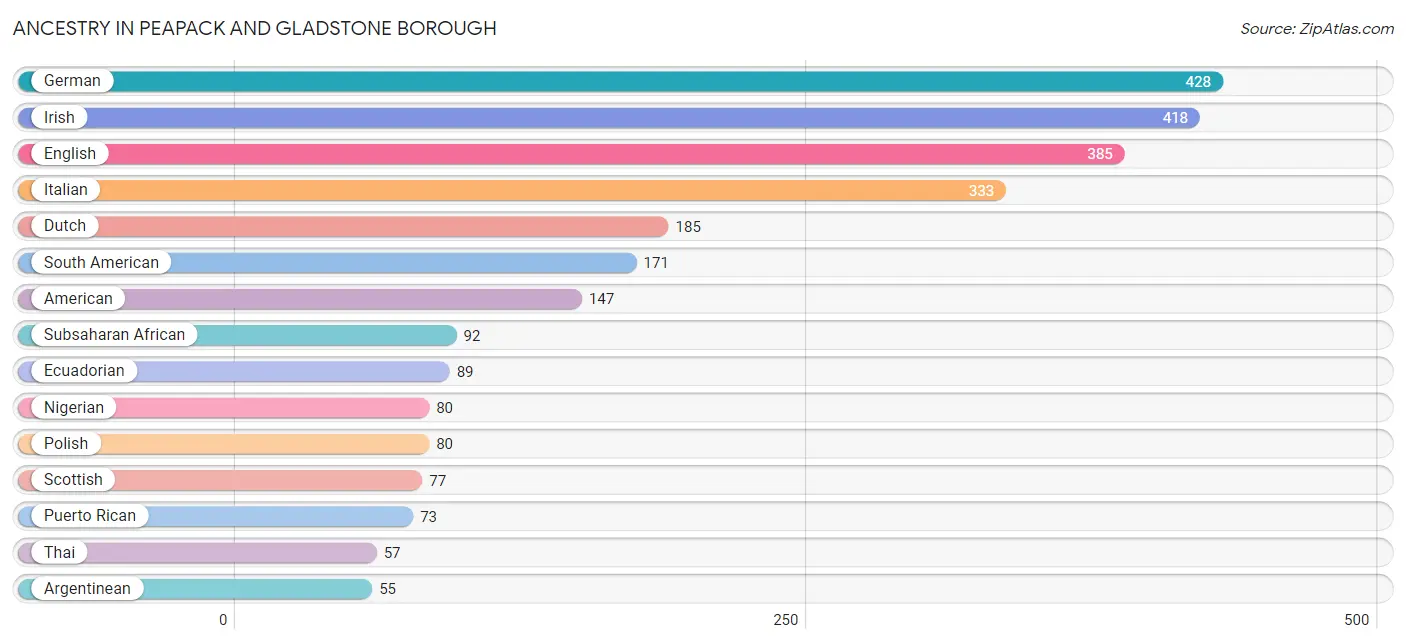
| Ancestry | # Population | % Population |
| American | 147 | 5.7% |
| Argentinean | 55 | 2.1% |
| Armenian | 3 | 0.1% |
| Austrian | 6 | 0.2% |
| Brazilian | 1 | 0.0% |
| British | 44 | 1.7% |
| Dutch | 185 | 7.2% |
| Eastern European | 20 | 0.8% |
| Ecuadorian | 89 | 3.5% |
| English | 385 | 15.0% |
| European | 19 | 0.7% |
| French | 10 | 0.4% |
| German | 428 | 16.7% |
| Greek | 38 | 1.5% |
| Haitian | 10 | 0.4% |
| Hungarian | 32 | 1.3% |
| Indian (Asian) | 48 | 1.9% |
| Irish | 418 | 16.3% |
| Italian | 333 | 13.0% |
| Macedonian | 34 | 1.3% |
| Nigerian | 80 | 3.1% |
| Paraguayan | 27 | 1.1% |
| Polish | 80 | 3.1% |
| Puerto Rican | 73 | 2.9% |
| Russian | 12 | 0.5% |
| Scandinavian | 4 | 0.2% |
| Scotch-Irish | 12 | 0.5% |
| Scottish | 77 | 3.0% |
| Slovak | 7 | 0.3% |
| South African | 12 | 0.5% |
| South American | 171 | 6.7% |
| Spaniard | 8 | 0.3% |
| Sri Lankan | 11 | 0.4% |
| Subsaharan African | 92 | 3.6% |
| Swedish | 33 | 1.3% |
| Swiss | 52 | 2.0% |
| Thai | 57 | 2.2% |
| Ukrainian | 5 | 0.2% |
| Welsh | 47 | 1.8% | View All 39 Rows |
Immigrants in Peapack and Gladstone borough
The most numerous immigrant groups reported in Peapack and Gladstone borough came from Europe (126 | 4.9%), Latin America (122 | 4.8%), South America (114 | 4.4%), Africa (92 | 3.6%), and Asia (82 | 3.2%), together accounting for 20.9% of all Peapack and Gladstone borough residents.
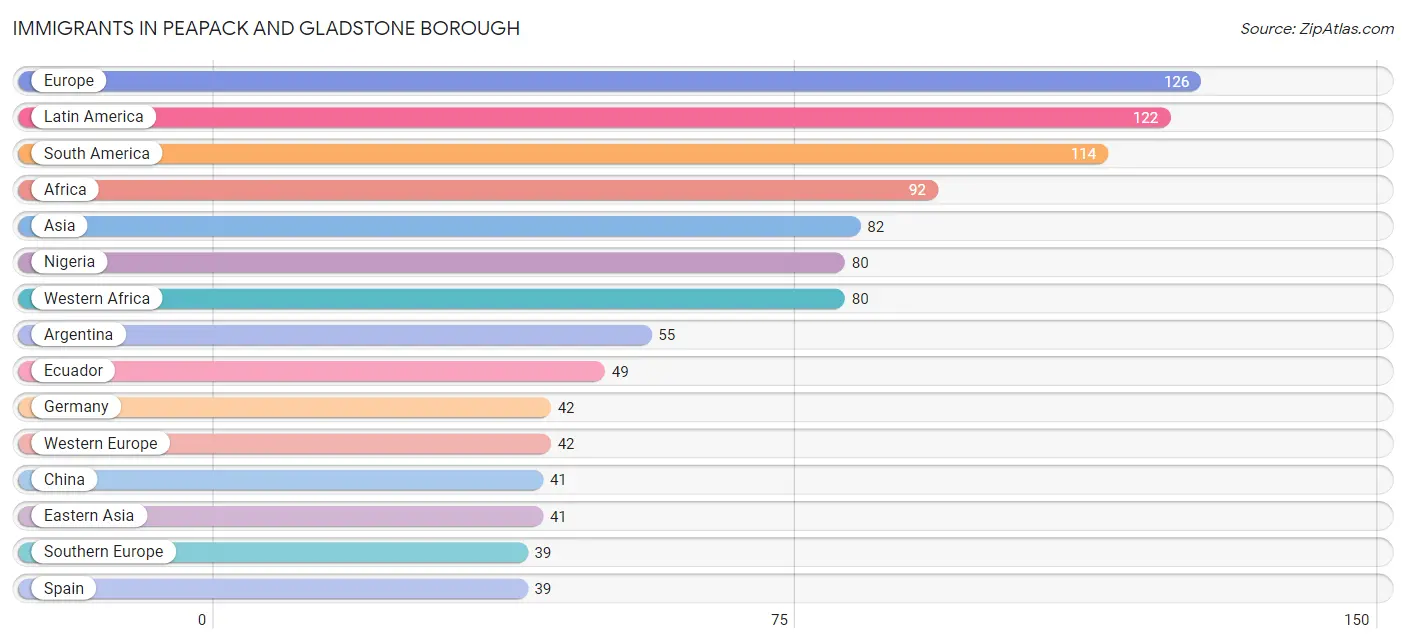
| Immigration Origin | # Population | % Population |
| Africa | 92 | 3.6% |
| Argentina | 55 | 2.1% |
| Asia | 82 | 3.2% |
| Australia | 6 | 0.2% |
| Brazil | 1 | 0.0% |
| Canada | 36 | 1.4% |
| Caribbean | 4 | 0.2% |
| Central America | 4 | 0.2% |
| China | 41 | 1.6% |
| Cuba | 4 | 0.2% |
| Eastern Asia | 41 | 1.6% |
| Eastern Europe | 29 | 1.1% |
| Ecuador | 49 | 1.9% |
| England | 4 | 0.2% |
| Europe | 126 | 4.9% |
| Germany | 42 | 1.6% |
| India | 30 | 1.2% |
| Latin America | 122 | 4.8% |
| Mexico | 4 | 0.2% |
| Nigeria | 80 | 3.1% |
| North Macedonia | 18 | 0.7% |
| Northern Europe | 16 | 0.6% |
| Oceania | 6 | 0.2% |
| Romania | 8 | 0.3% |
| Russia | 3 | 0.1% |
| South Africa | 12 | 0.5% |
| South America | 114 | 4.4% |
| South Central Asia | 30 | 1.2% |
| South Eastern Asia | 11 | 0.4% |
| Southern Europe | 39 | 1.5% |
| Spain | 39 | 1.5% |
| Vietnam | 11 | 0.4% |
| Western Africa | 80 | 3.1% |
| Western Europe | 42 | 1.6% | View All 34 Rows |
Sex and Age in Peapack and Gladstone borough
Sex and Age in Peapack and Gladstone borough
The most populous age groups in Peapack and Gladstone borough are 65 to 69 Years (109 | 9.0%) for men and 60 to 64 Years (211 | 15.6%) for women.
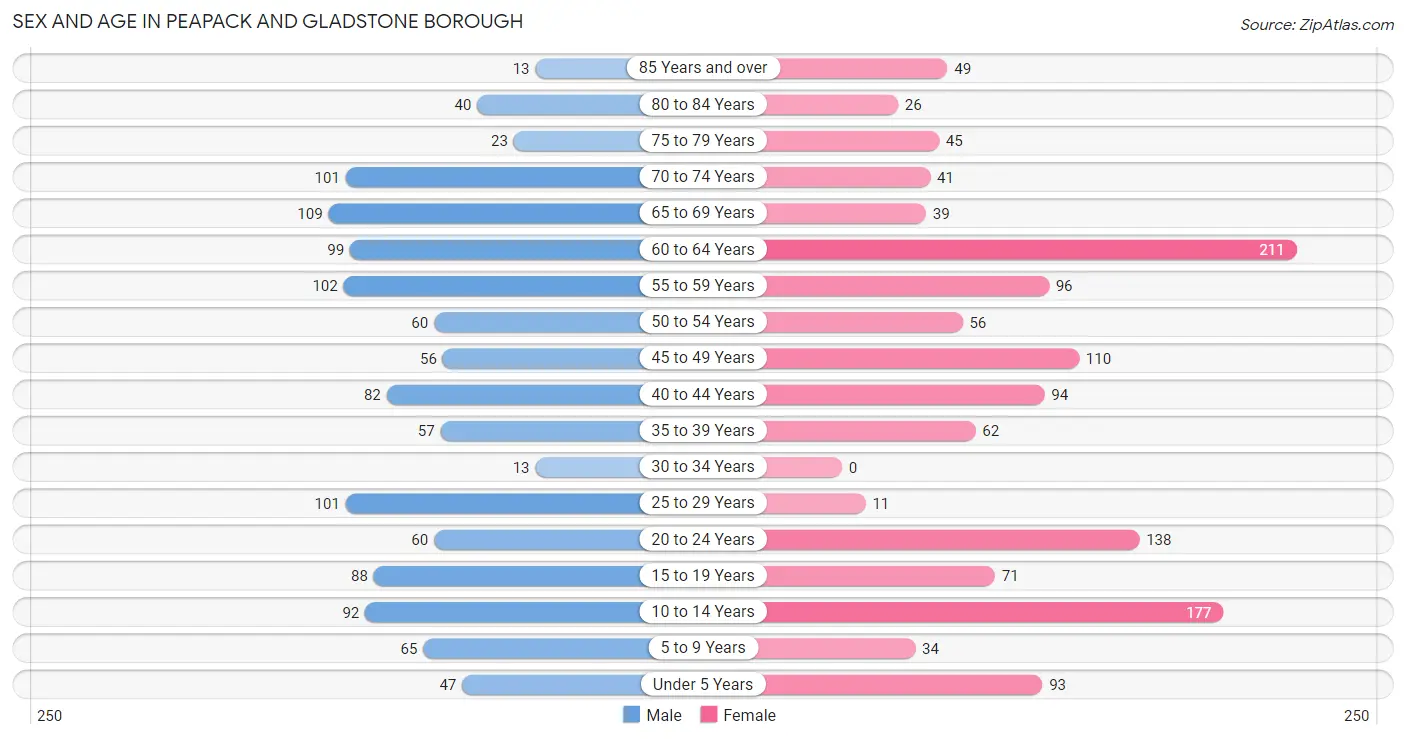
| Age Bracket | Male | Female |
| Under 5 Years | 47 (3.9%) | 93 (6.9%) |
| 5 to 9 Years | 65 (5.4%) | 34 (2.5%) |
| 10 to 14 Years | 92 (7.6%) | 177 (13.1%) |
| 15 to 19 Years | 88 (7.3%) | 71 (5.2%) |
| 20 to 24 Years | 60 (5.0%) | 138 (10.2%) |
| 25 to 29 Years | 101 (8.4%) | 11 (0.8%) |
| 30 to 34 Years | 13 (1.1%) | 0 (0.0%) |
| 35 to 39 Years | 57 (4.7%) | 62 (4.6%) |
| 40 to 44 Years | 82 (6.8%) | 94 (7.0%) |
| 45 to 49 Years | 56 (4.6%) | 110 (8.1%) |
| 50 to 54 Years | 60 (5.0%) | 56 (4.1%) |
| 55 to 59 Years | 102 (8.4%) | 96 (7.1%) |
| 60 to 64 Years | 99 (8.2%) | 211 (15.6%) |
| 65 to 69 Years | 109 (9.0%) | 39 (2.9%) |
| 70 to 74 Years | 101 (8.4%) | 41 (3.0%) |
| 75 to 79 Years | 23 (1.9%) | 45 (3.3%) |
| 80 to 84 Years | 40 (3.3%) | 26 (1.9%) |
| 85 Years and over | 13 (1.1%) | 49 (3.6%) |
| Total | 1,208 (100.0%) | 1,353 (100.0%) |
Families and Households in Peapack and Gladstone borough
Median Family Size in Peapack and Gladstone borough
The median family size in Peapack and Gladstone borough is 2.98 persons per family, with married-couple families (587 | 81.1%) accounting for the largest median family size of 3.18 persons per family. On the other hand, single female/mother families (103 | 14.2%) represent the smallest median family size with 2.11 persons per family.
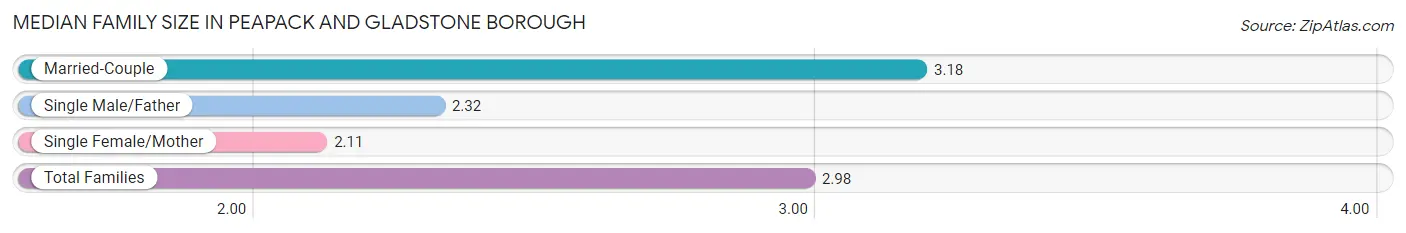
| Family Type | # Families | Family Size |
| Married-Couple | 587 (81.1%) | 3.18 |
| Single Male/Father | 34 (4.7%) | 2.32 |
| Single Female/Mother | 103 (14.2%) | 2.11 |
| Total Families | 724 (100.0%) | 2.98 |
Median Household Size in Peapack and Gladstone borough
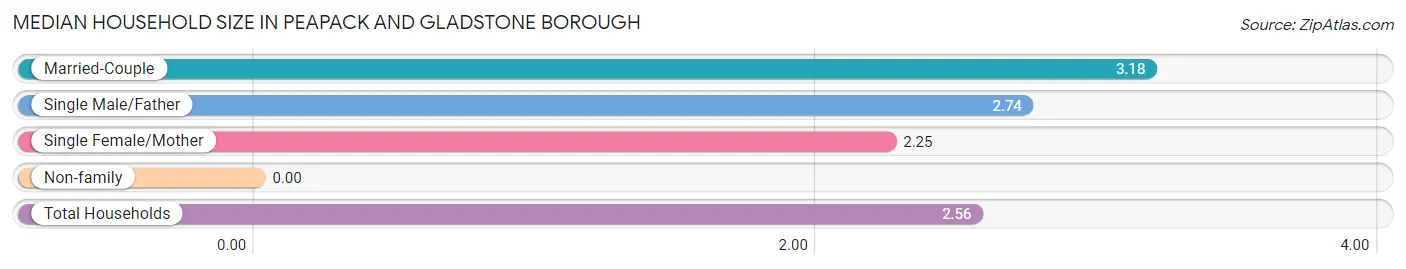
| Household Type | # Households | Household Size |
| Married-Couple | 587 (62.5%) | 3.18 |
| Single Male/Father | 34 (3.6%) | 2.74 |
| Single Female/Mother | 103 (11.0%) | 2.25 |
| Non-family | 216 (23.0%) | - |
| Total Households | 940 (100.0%) | 2.56 |
Household Size by Marriage Status in Peapack and Gladstone borough
Out of a total of 940 households in Peapack and Gladstone borough, 724 (77.0%) are family households, while 216 (23.0%) are nonfamily households. The most numerous type of family households are 2-person households, comprising 343, and the most common type of nonfamily households are 1-person households, comprising 216.
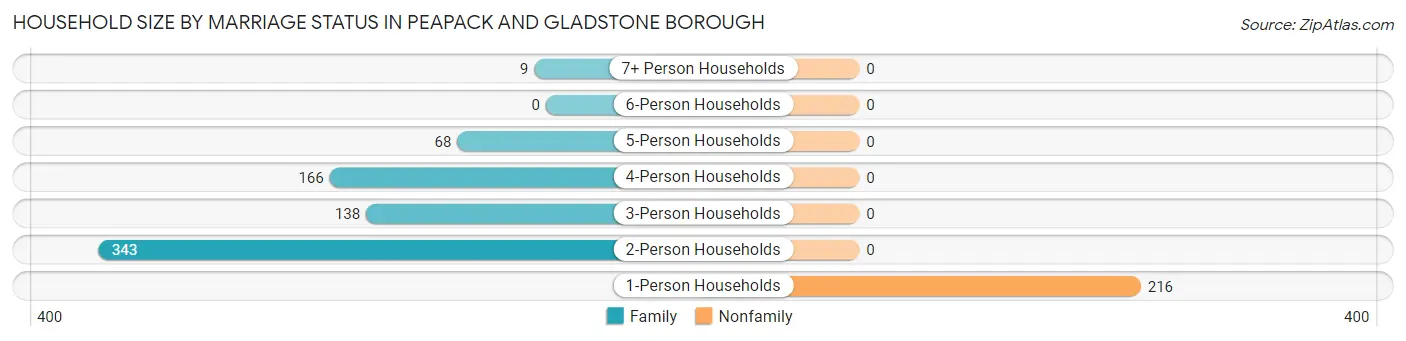
| Household Size | Family Households | Nonfamily Households |
| 1-Person Households | - | 216 (23.0%) |
| 2-Person Households | 343 (36.5%) | 0 (0.0%) |
| 3-Person Households | 138 (14.7%) | 0 (0.0%) |
| 4-Person Households | 166 (17.7%) | 0 (0.0%) |
| 5-Person Households | 68 (7.2%) | 0 (0.0%) |
| 6-Person Households | 0 (0.0%) | 0 (0.0%) |
| 7+ Person Households | 9 (1.0%) | 0 (0.0%) |
| Total | 724 (77.0%) | 216 (23.0%) |
Female Fertility in Peapack and Gladstone borough
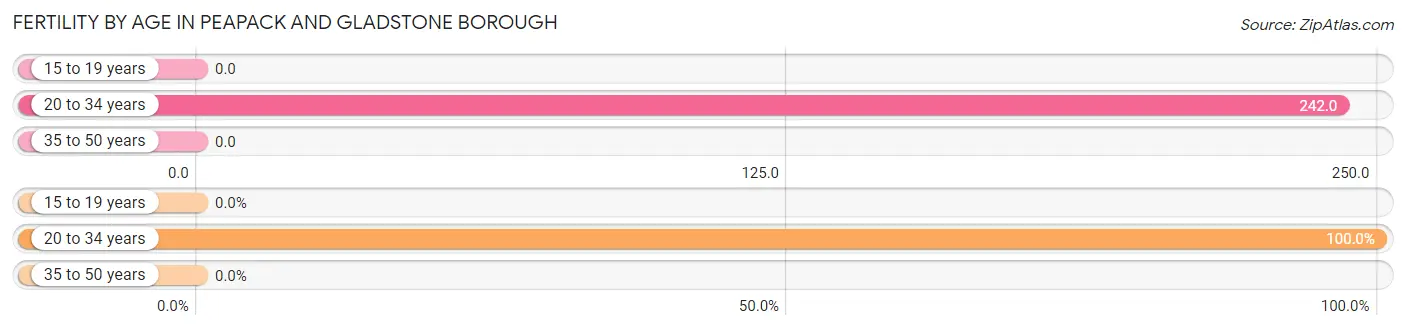
Fertility by Age in Peapack and Gladstone borough
Average fertility rate in Peapack and Gladstone borough is 73.0 births per 1,000 women. Women in the age bracket of 20 to 34 years have the highest fertility rate with 242.0 births per 1,000 women. Women in the age bracket of 20 to 34 years acount for 100.0% of all women with births.
| Age Bracket | Women with Births | Births / 1,000 Women |
| 15 to 19 years | 0 (0.0%) | 0.0 |
| 20 to 34 years | 36 (100.0%) | 242.0 |
| 35 to 50 years | 0 (0.0%) | 0.0 |
| Total | 36 (100.0%) | 73.0 |
Fertility by Age by Marriage Status in Peapack and Gladstone borough
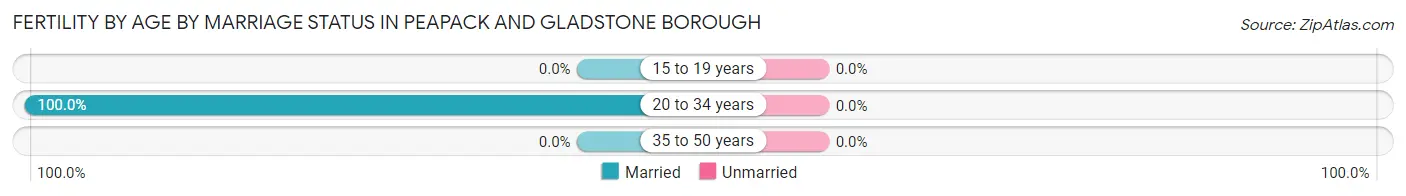
| Age Bracket | Married | Unmarried |
| 15 to 19 years | 0 (0.0%) | 0 (0.0%) |
| 20 to 34 years | 36 (100.0%) | 0 (0.0%) |
| 35 to 50 years | 0 (0.0%) | 0 (0.0%) |
| Total | 36 (100.0%) | 0 (0.0%) |
Fertility by Education in Peapack and Gladstone borough
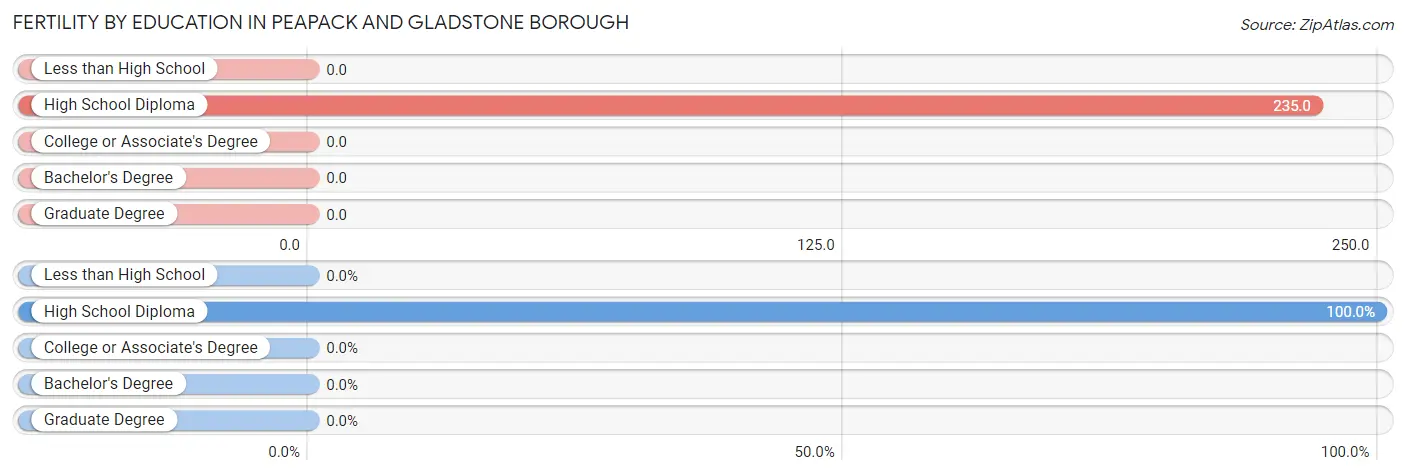
| Educational Attainment | Women with Births | Births / 1,000 Women |
| Less than High School | 0 (0.0%) | 0.0 |
| High School Diploma | 36 (100.0%) | 235.0 |
| College or Associate's Degree | 0 (0.0%) | 0.0 |
| Bachelor's Degree | 0 (0.0%) | 0.0 |
| Graduate Degree | 0 (0.0%) | 0.0 |
| Total | 36 (100.0%) | 73.0 |
Fertility by Education by Marriage Status in Peapack and Gladstone borough
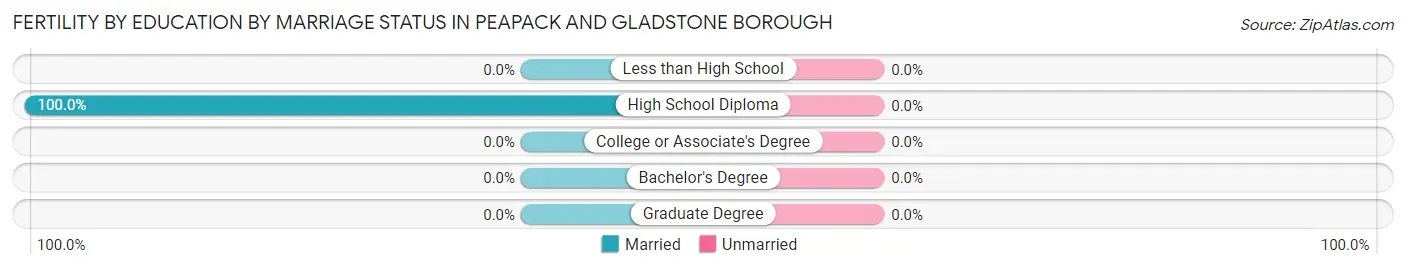
| Educational Attainment | Married | Unmarried |
| Less than High School | 0 (0.0%) | 0 (0.0%) |
| High School Diploma | 36 (100.0%) | 0 (0.0%) |
| College or Associate's Degree | 0 (0.0%) | 0 (0.0%) |
| Bachelor's Degree | 0 (0.0%) | 0 (0.0%) |
| Graduate Degree | 0 (0.0%) | 0 (0.0%) |
| Total | 36 (100.0%) | 0 (0.0%) |
Employment Characteristics in Peapack and Gladstone borough
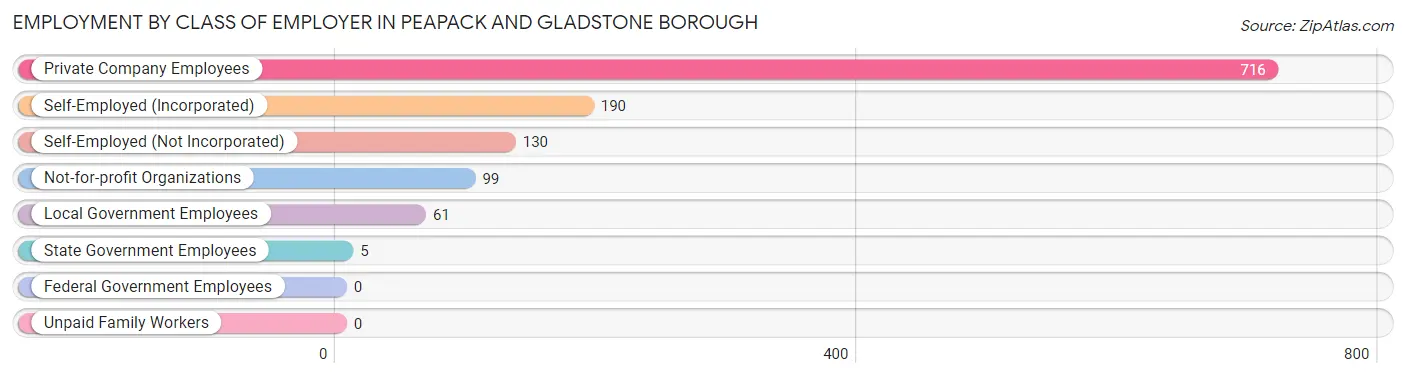
Employment by Class of Employer in Peapack and Gladstone borough
Among the 1,201 employed individuals in Peapack and Gladstone borough, private company employees (716 | 59.6%), self-employed (incorporated) (190 | 15.8%), and self-employed (not incorporated) (130 | 10.8%) make up the most common classes of employment.
| Employer Class | # Employees | % Employees |
| Private Company Employees | 716 | 59.6% |
| Self-Employed (Incorporated) | 190 | 15.8% |
| Self-Employed (Not Incorporated) | 130 | 10.8% |
| Not-for-profit Organizations | 99 | 8.2% |
| Local Government Employees | 61 | 5.1% |
| State Government Employees | 5 | 0.4% |
| Federal Government Employees | 0 | 0.0% |
| Unpaid Family Workers | 0 | 0.0% |
| Total | 1,201 | 100.0% |
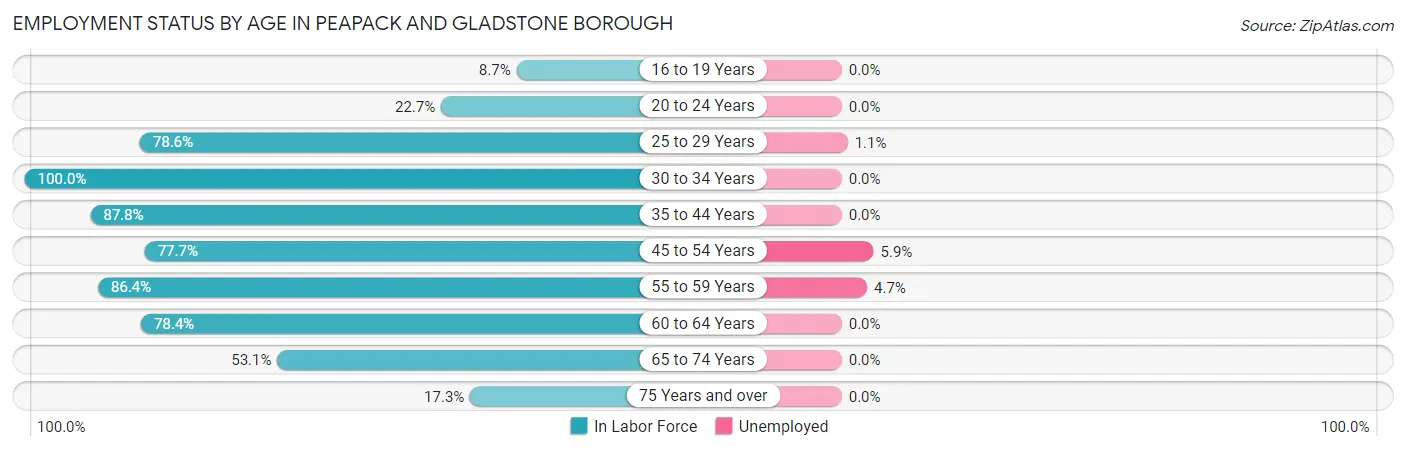
Employment Status by Age in Peapack and Gladstone borough
According to the labor force statistics for Peapack and Gladstone borough, out of the total population over 16 years of age (2,020), 61.2% or 1,236 individuals are in the labor force, with 1.8% or 22 of them unemployed. The age group with the highest labor force participation rate is 30 to 34 years, with 100.0% or 13 individuals in the labor force. Within the labor force, the 45 to 54 years age range has the highest percentage of unemployed individuals, with 5.9% or 13 of them being unemployed.
| Age Bracket | In Labor Force | Unemployed |
| 16 to 19 Years | 11 (8.7%) | 0 (0.0%) |
| 20 to 24 Years | 45 (22.7%) | 0 (0.0%) |
| 25 to 29 Years | 88 (78.6%) | 1 (1.1%) |
| 30 to 34 Years | 13 (100.0%) | 0 (0.0%) |
| 35 to 44 Years | 259 (87.8%) | 0 (0.0%) |
| 45 to 54 Years | 219 (77.7%) | 13 (5.9%) |
| 55 to 59 Years | 171 (86.4%) | 8 (4.7%) |
| 60 to 64 Years | 243 (78.4%) | 0 (0.0%) |
| 65 to 74 Years | 154 (53.1%) | 0 (0.0%) |
| 75 Years and over | 34 (17.3%) | 0 (0.0%) |
| Total | 1,236 (61.2%) | 22 (1.8%) |
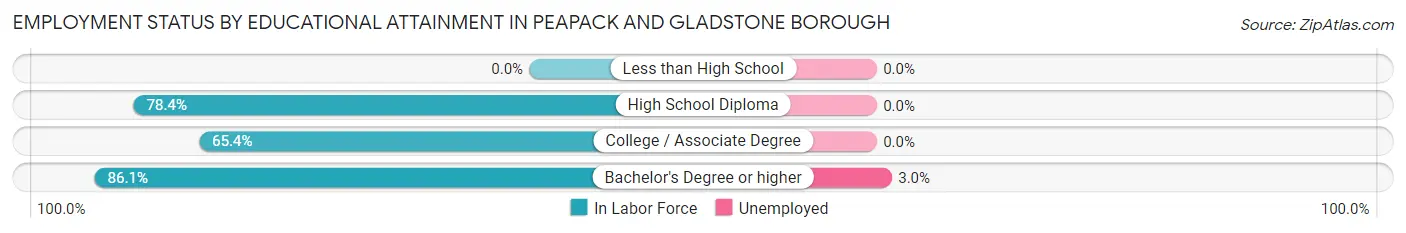
Employment Status by Educational Attainment in Peapack and Gladstone borough
According to labor force statistics for Peapack and Gladstone borough, 82.1% of individuals (993) out of the total population between 25 and 64 years of age (1,210) are in the labor force, with 2.2% or 22 of them being unemployed. The group with the highest labor force participation rate are those with the educational attainment of bachelor's degree or higher, with 86.1% or 727 individuals in the labor force. Within the labor force, individuals with bachelor's degree or higher education have the highest percentage of unemployment, with 3.0% or 22 of them being unemployed.
| Educational Attainment | In Labor Force | Unemployed |
| Less than High School | 0 (0.0%) | 0 (0.0%) |
| High School Diploma | 160 (78.4%) | 0 (0.0%) |
| College / Associate Degree | 106 (65.4%) | 0 (0.0%) |
| Bachelor's Degree or higher | 727 (86.1%) | 25 (3.0%) |
| Total | 993 (82.1%) | 27 (2.2%) |
Employment Occupations by Sex in Peapack and Gladstone borough
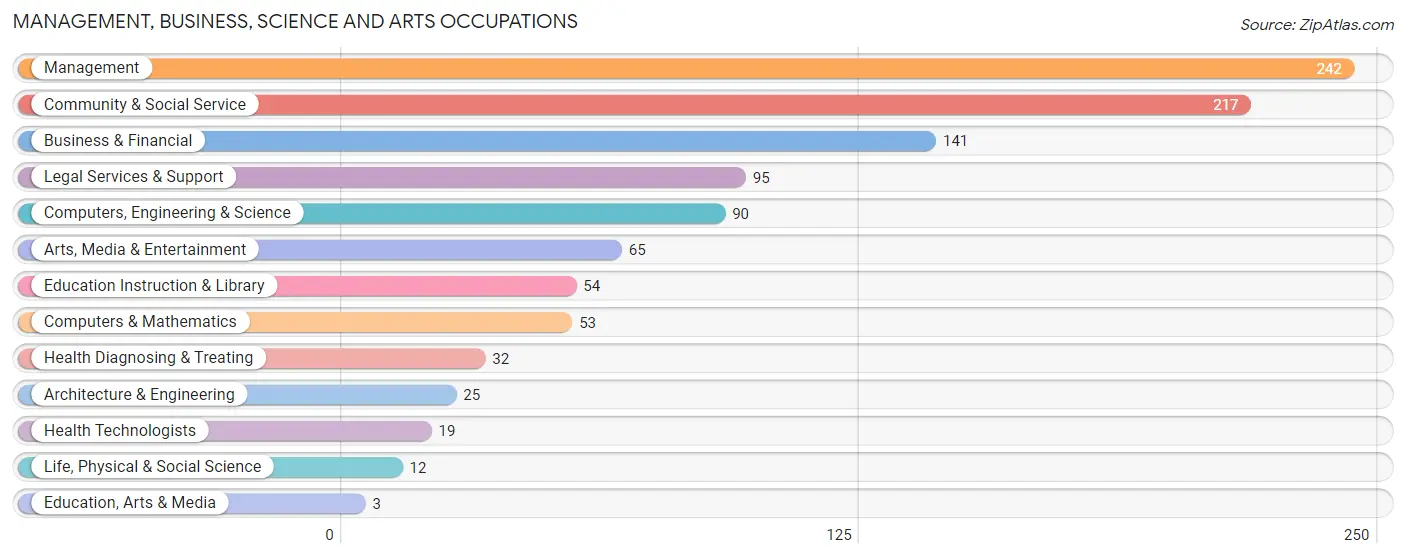
Management, Business, Science and Arts Occupations
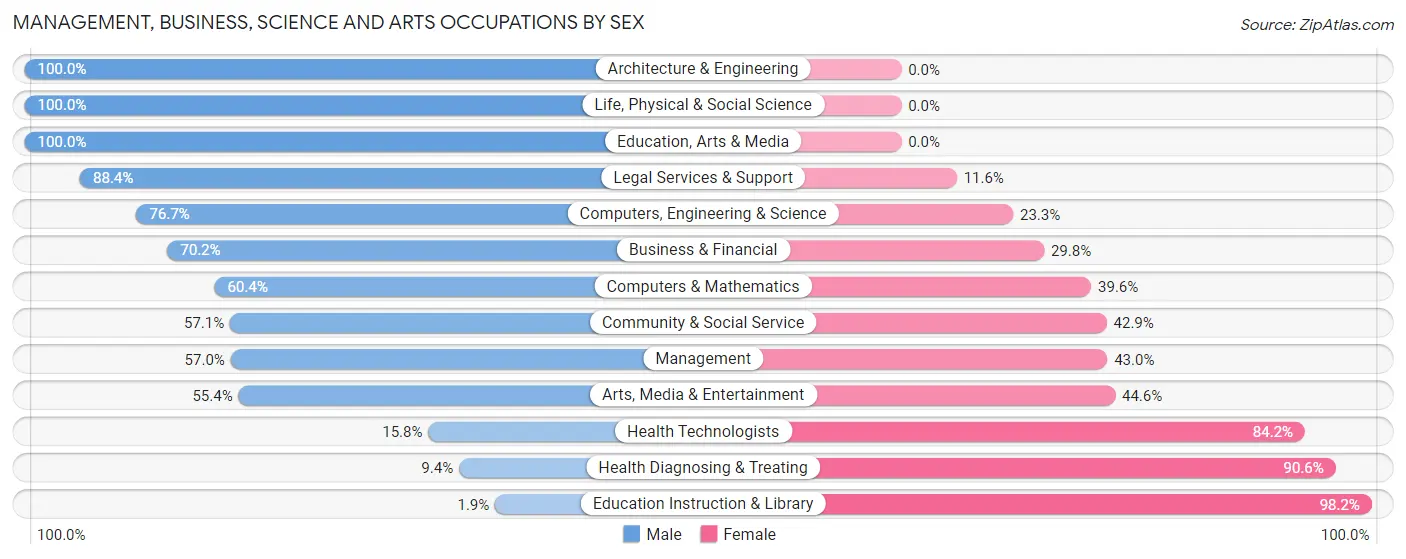
The most common Management, Business, Science and Arts occupations in Peapack and Gladstone borough are Management (242 | 19.9%), Community & Social Service (217 | 17.9%), Business & Financial (141 | 11.6%), Legal Services & Support (95 | 7.8%), and Computers, Engineering & Science (90 | 7.4%).
Management, Business, Science and Arts Occupations by Sex
Within the Management, Business, Science and Arts occupations in Peapack and Gladstone borough, the most male-oriented occupations are Architecture & Engineering (100.0%), Life, Physical & Social Science (100.0%), and Education, Arts & Media (100.0%), while the most female-oriented occupations are Education Instruction & Library (98.2%), Health Diagnosing & Treating (90.6%), and Health Technologists (84.2%).
| Occupation | Male | Female |
| Management | 138 (57.0%) | 104 (43.0%) |
| Business & Financial | 99 (70.2%) | 42 (29.8%) |
| Computers, Engineering & Science | 69 (76.7%) | 21 (23.3%) |
| Computers & Mathematics | 32 (60.4%) | 21 (39.6%) |
| Architecture & Engineering | 25 (100.0%) | 0 (0.0%) |
| Life, Physical & Social Science | 12 (100.0%) | 0 (0.0%) |
| Community & Social Service | 124 (57.1%) | 93 (42.9%) |
| Education, Arts & Media | 3 (100.0%) | 0 (0.0%) |
| Legal Services & Support | 84 (88.4%) | 11 (11.6%) |
| Education Instruction & Library | 1 (1.8%) | 53 (98.2%) |
| Arts, Media & Entertainment | 36 (55.4%) | 29 (44.6%) |
| Health Diagnosing & Treating | 3 (9.4%) | 29 (90.6%) |
| Health Technologists | 3 (15.8%) | 16 (84.2%) |
| Total (Category) | 433 (60.0%) | 289 (40.0%) |
| Total (Overall) | 656 (54.0%) | 559 (46.0%) |
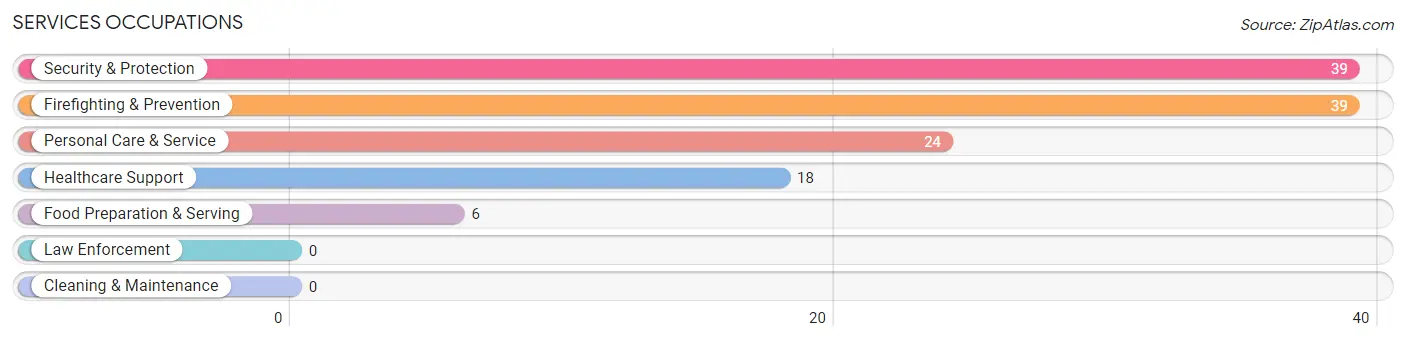
Services Occupations
The most common Services occupations in Peapack and Gladstone borough are Security & Protection (39 | 3.2%), Firefighting & Prevention (39 | 3.2%), Personal Care & Service (24 | 2.0%), Healthcare Support (18 | 1.5%), and Food Preparation & Serving (6 | 0.5%).
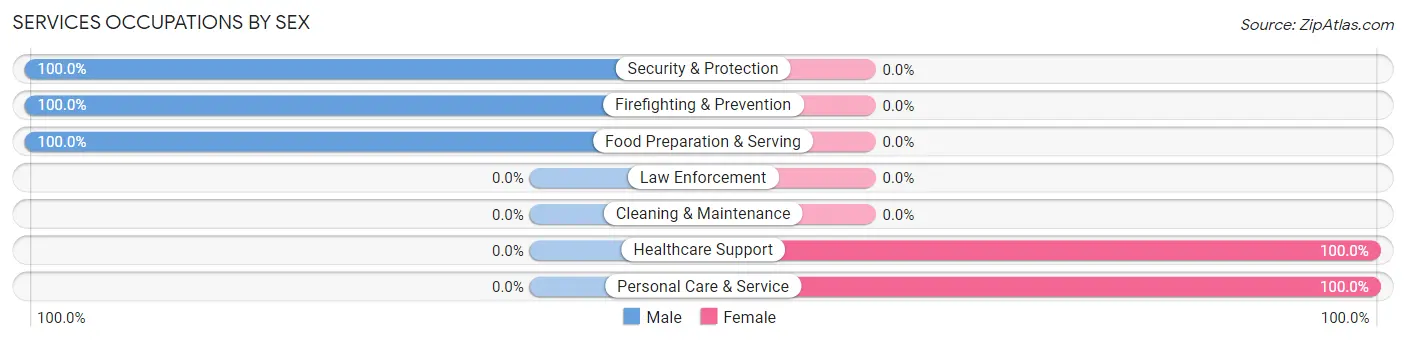
Services Occupations by Sex
Within the Services occupations in Peapack and Gladstone borough, the most male-oriented occupations are Security & Protection (100.0%), Firefighting & Prevention (100.0%), and Food Preparation & Serving (100.0%), while the most female-oriented occupations are Healthcare Support (100.0%), and Personal Care & Service (100.0%).
| Occupation | Male | Female |
| Healthcare Support | 0 (0.0%) | 18 (100.0%) |
| Security & Protection | 39 (100.0%) | 0 (0.0%) |
| Firefighting & Prevention | 39 (100.0%) | 0 (0.0%) |
| Law Enforcement | 0 (0.0%) | 0 (0.0%) |
| Food Preparation & Serving | 6 (100.0%) | 0 (0.0%) |
| Cleaning & Maintenance | 0 (0.0%) | 0 (0.0%) |
| Personal Care & Service | 0 (0.0%) | 24 (100.0%) |
| Total (Category) | 45 (51.7%) | 42 (48.3%) |
| Total (Overall) | 656 (54.0%) | 559 (46.0%) |
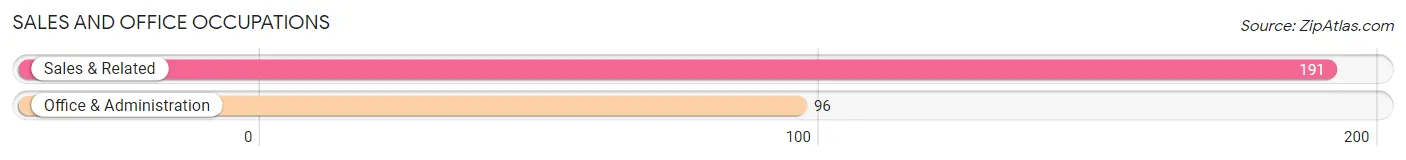
Sales and Office Occupations
The most common Sales and Office occupations in Peapack and Gladstone borough are Sales & Related (191 | 15.7%), and Office & Administration (96 | 7.9%).
Sales and Office Occupations by Sex
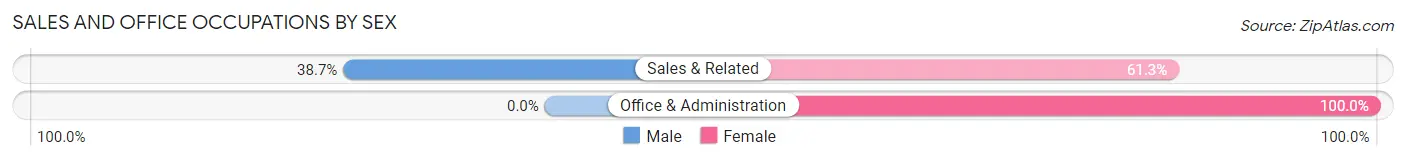
| Occupation | Male | Female |
| Sales & Related | 74 (38.7%) | 117 (61.3%) |
| Office & Administration | 0 (0.0%) | 96 (100.0%) |
| Total (Category) | 74 (25.8%) | 213 (74.2%) |
| Total (Overall) | 656 (54.0%) | 559 (46.0%) |
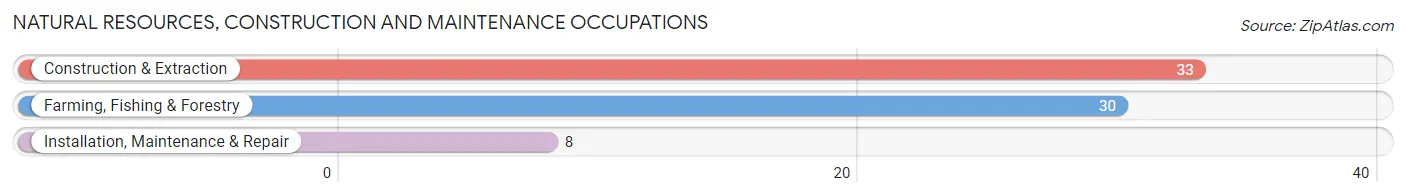
Natural Resources, Construction and Maintenance Occupations
The most common Natural Resources, Construction and Maintenance occupations in Peapack and Gladstone borough are Construction & Extraction (33 | 2.7%), Farming, Fishing & Forestry (30 | 2.5%), and Installation, Maintenance & Repair (8 | 0.7%).
Natural Resources, Construction and Maintenance Occupations by Sex
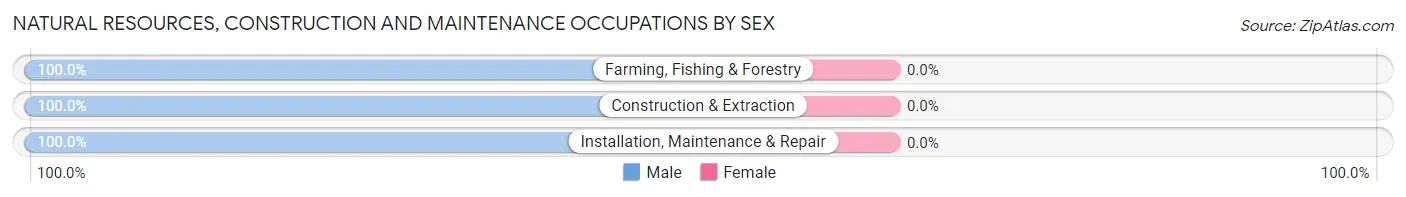
| Occupation | Male | Female |
| Farming, Fishing & Forestry | 30 (100.0%) | 0 (0.0%) |
| Construction & Extraction | 33 (100.0%) | 0 (0.0%) |
| Installation, Maintenance & Repair | 8 (100.0%) | 0 (0.0%) |
| Total (Category) | 71 (100.0%) | 0 (0.0%) |
| Total (Overall) | 656 (54.0%) | 559 (46.0%) |
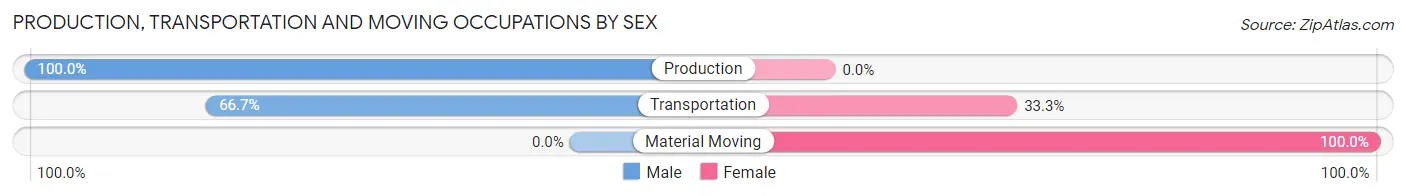
Production, Transportation and Moving Occupations
The most common Production, Transportation and Moving occupations in Peapack and Gladstone borough are Transportation (42 | 3.5%), Production (5 | 0.4%), and Material Moving (1 | 0.1%).
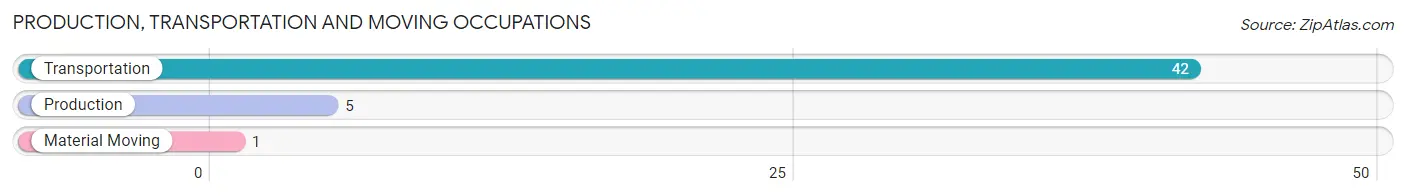
Production, Transportation and Moving Occupations by Sex
| Occupation | Male | Female |
| Production | 5 (100.0%) | 0 (0.0%) |
| Transportation | 28 (66.7%) | 14 (33.3%) |
| Material Moving | 0 (0.0%) | 1 (100.0%) |
| Total (Category) | 33 (68.8%) | 15 (31.2%) |
| Total (Overall) | 656 (54.0%) | 559 (46.0%) |
Employment Industries by Sex in Peapack and Gladstone borough
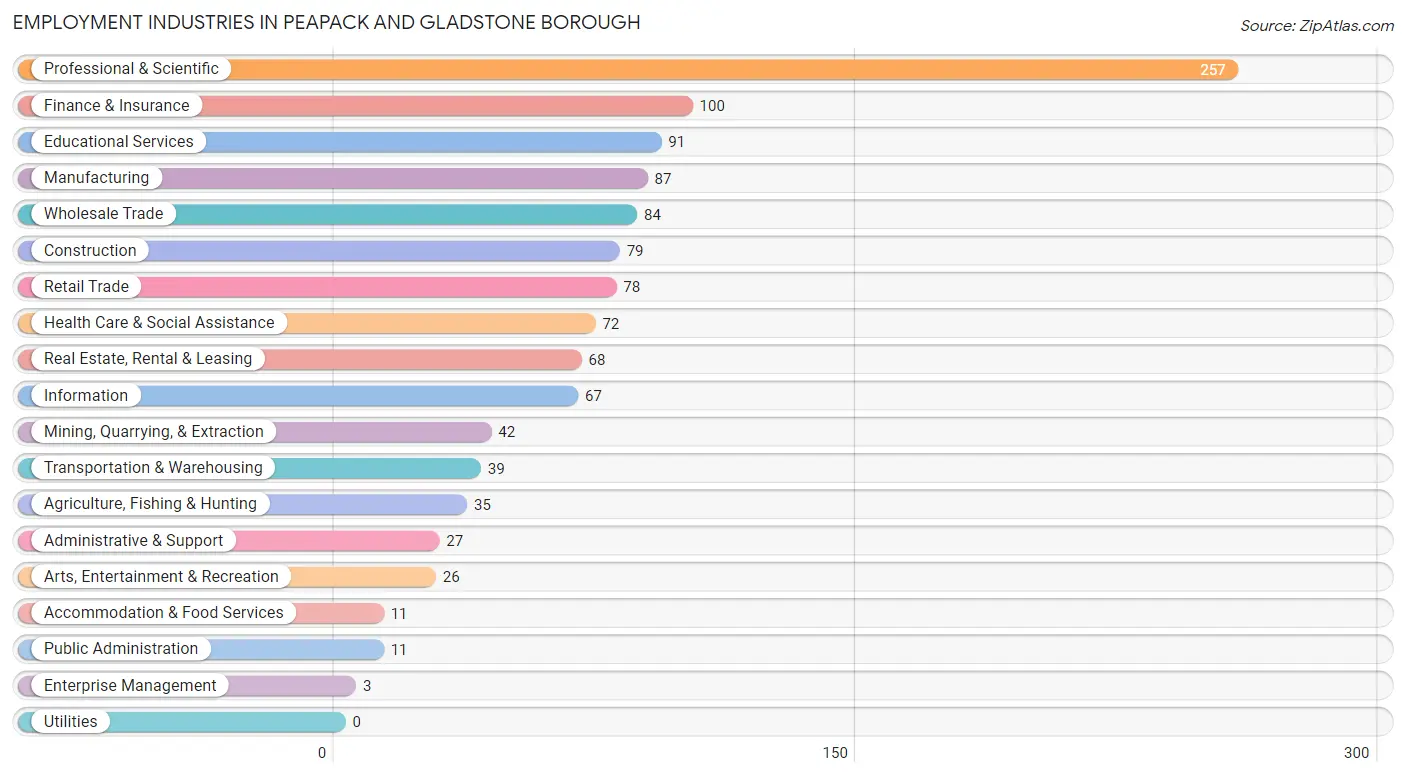
Employment Industries in Peapack and Gladstone borough
The major employment industries in Peapack and Gladstone borough include Professional & Scientific (257 | 21.1%), Finance & Insurance (100 | 8.2%), Educational Services (91 | 7.5%), Manufacturing (87 | 7.2%), and Wholesale Trade (84 | 6.9%).
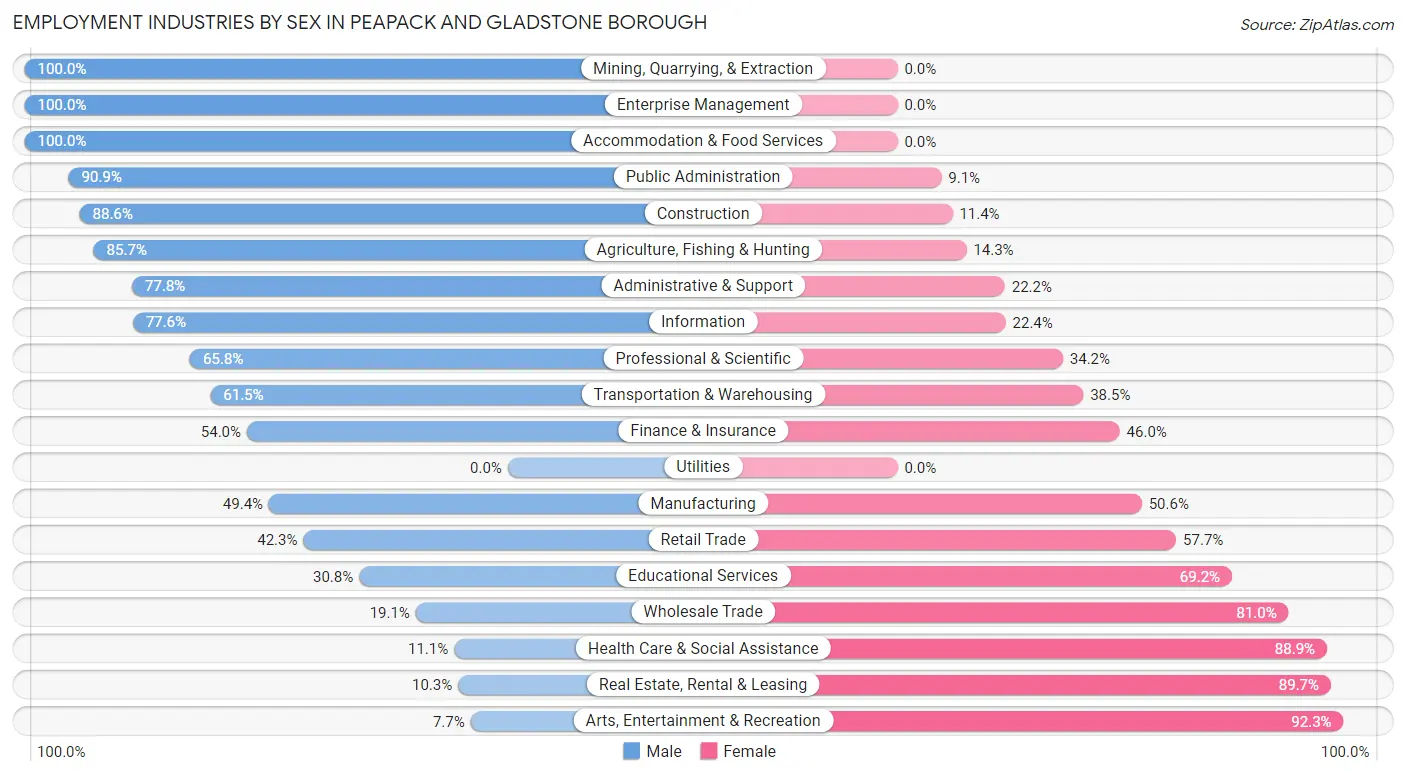
Employment Industries by Sex in Peapack and Gladstone borough
The Peapack and Gladstone borough industries that see more men than women are Mining, Quarrying, & Extraction (100.0%), Enterprise Management (100.0%), and Accommodation & Food Services (100.0%), whereas the industries that tend to have a higher number of women are Arts, Entertainment & Recreation (92.3%), Real Estate, Rental & Leasing (89.7%), and Health Care & Social Assistance (88.9%).
| Industry | Male | Female |
| Agriculture, Fishing & Hunting | 30 (85.7%) | 5 (14.3%) |
| Mining, Quarrying, & Extraction | 42 (100.0%) | 0 (0.0%) |
| Construction | 70 (88.6%) | 9 (11.4%) |
| Manufacturing | 43 (49.4%) | 44 (50.6%) |
| Wholesale Trade | 16 (19.1%) | 68 (80.9%) |
| Retail Trade | 33 (42.3%) | 45 (57.7%) |
| Transportation & Warehousing | 24 (61.5%) | 15 (38.5%) |
| Utilities | 0 (0.0%) | 0 (0.0%) |
| Information | 52 (77.6%) | 15 (22.4%) |
| Finance & Insurance | 54 (54.0%) | 46 (46.0%) |
| Real Estate, Rental & Leasing | 7 (10.3%) | 61 (89.7%) |
| Professional & Scientific | 169 (65.8%) | 88 (34.2%) |
| Enterprise Management | 3 (100.0%) | 0 (0.0%) |
| Administrative & Support | 21 (77.8%) | 6 (22.2%) |
| Educational Services | 28 (30.8%) | 63 (69.2%) |
| Health Care & Social Assistance | 8 (11.1%) | 64 (88.9%) |
| Arts, Entertainment & Recreation | 2 (7.7%) | 24 (92.3%) |
| Accommodation & Food Services | 11 (100.0%) | 0 (0.0%) |
| Public Administration | 10 (90.9%) | 1 (9.1%) |
| Total | 656 (54.0%) | 559 (46.0%) |
Education in Peapack and Gladstone borough
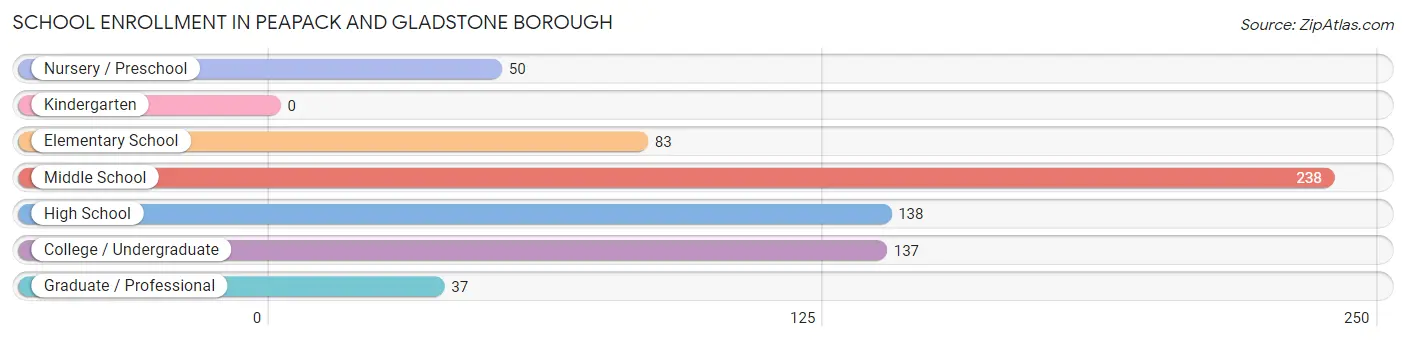
School Enrollment in Peapack and Gladstone borough
The most common levels of schooling among the 683 students in Peapack and Gladstone borough are middle school (238 | 34.8%), high school (138 | 20.2%), and college / undergraduate (137 | 20.1%).
| School Level | # Students | % Students |
| Nursery / Preschool | 50 | 7.3% |
| Kindergarten | 0 | 0.0% |
| Elementary School | 83 | 12.1% |
| Middle School | 238 | 34.8% |
| High School | 138 | 20.2% |
| College / Undergraduate | 137 | 20.1% |
| Graduate / Professional | 37 | 5.4% |
| Total | 683 | 100.0% |
School Enrollment by Age by Funding Source in Peapack and Gladstone borough
Out of a total of 683 students who are enrolled in schools in Peapack and Gladstone borough, 242 (35.4%) attend a private institution, while the remaining 441 (64.6%) are enrolled in public schools. The age group of 3 to 4 year olds has the highest likelihood of being enrolled in private schools, with 30 (85.7% in the age bracket) enrolled. Conversely, the age group of 15 to 17 year olds has the lowest likelihood of being enrolled in a private school, with 76 (80.0% in the age bracket) attending a public institution.
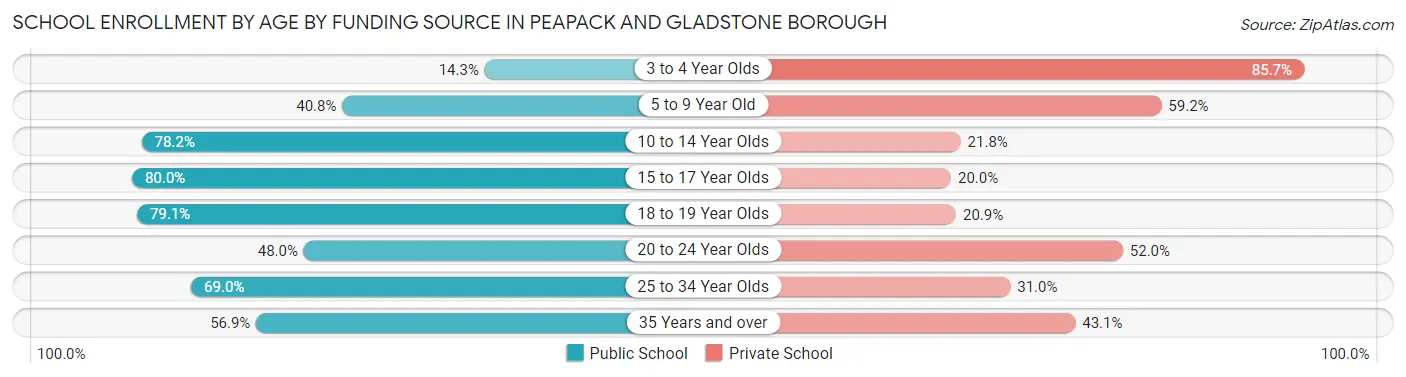
| Age Bracket | Public School | Private School |
| 3 to 4 Year Olds | 5 (14.3%) | 30 (85.7%) |
| 5 to 9 Year Old | 40 (40.8%) | 58 (59.2%) |
| 10 to 14 Year Olds | 201 (78.2%) | 56 (21.8%) |
| 15 to 17 Year Olds | 76 (80.0%) | 19 (20.0%) |
| 18 to 19 Year Olds | 34 (79.1%) | 9 (20.9%) |
| 20 to 24 Year Olds | 36 (48.0%) | 39 (52.0%) |
| 25 to 34 Year Olds | 20 (69.0%) | 9 (31.0%) |
| 35 Years and over | 29 (56.9%) | 22 (43.1%) |
| Total | 441 (64.6%) | 242 (35.4%) |
Educational Attainment by Field of Study in Peapack and Gladstone borough
Business (308 | 26.2%), literature & languages (119 | 10.1%), education (110 | 9.3%), bio, nature & agricultural (103 | 8.7%), and social sciences (102 | 8.7%) are the most common fields of study among 1,178 individuals in Peapack and Gladstone borough who have obtained a bachelor's degree or higher.
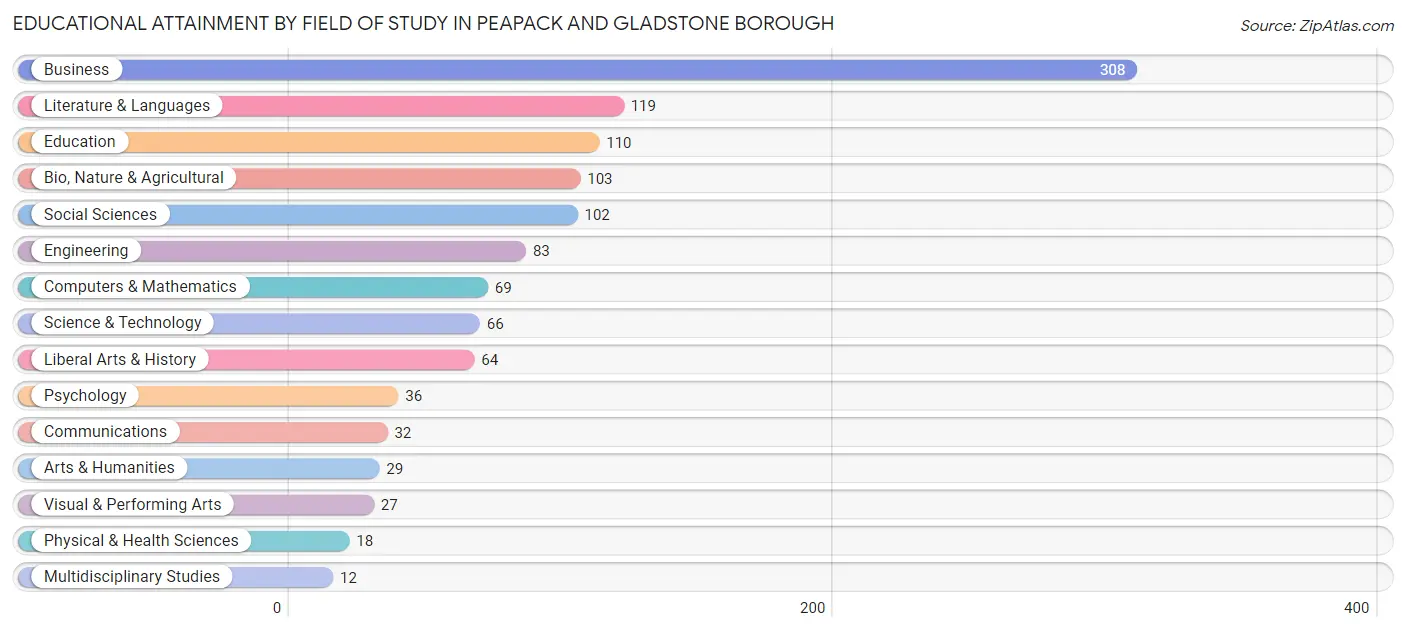
| Field of Study | # Graduates | % Graduates |
| Computers & Mathematics | 69 | 5.9% |
| Bio, Nature & Agricultural | 103 | 8.7% |
| Physical & Health Sciences | 18 | 1.5% |
| Psychology | 36 | 3.1% |
| Social Sciences | 102 | 8.7% |
| Engineering | 83 | 7.0% |
| Multidisciplinary Studies | 12 | 1.0% |
| Science & Technology | 66 | 5.6% |
| Business | 308 | 26.2% |
| Education | 110 | 9.3% |
| Literature & Languages | 119 | 10.1% |
| Liberal Arts & History | 64 | 5.4% |
| Visual & Performing Arts | 27 | 2.3% |
| Communications | 32 | 2.7% |
| Arts & Humanities | 29 | 2.5% |
| Total | 1,178 | 100.0% |
Transportation & Commute in Peapack and Gladstone borough
Vehicle Availability by Sex in Peapack and Gladstone borough
The most prevalent vehicle ownership categories in Peapack and Gladstone borough are males with 2 vehicles (255, accounting for 38.9%) and females with 2 vehicles (246, making up 47.0%).
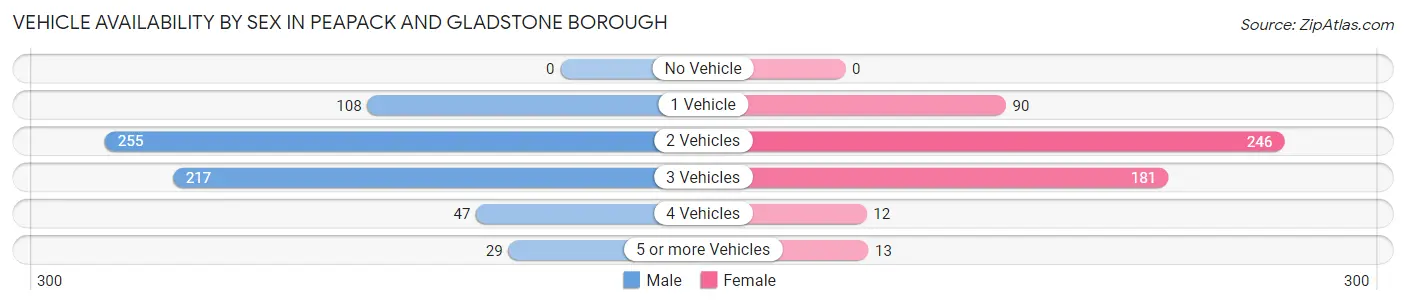
| Vehicles Available | Male | Female |
| No Vehicle | 0 (0.0%) | 0 (0.0%) |
| 1 Vehicle | 108 (16.5%) | 90 (16.6%) |
| 2 Vehicles | 255 (38.9%) | 246 (45.4%) |
| 3 Vehicles | 217 (33.1%) | 181 (33.4%) |
| 4 Vehicles | 47 (7.2%) | 12 (2.2%) |
| 5 or more Vehicles | 29 (4.4%) | 13 (2.4%) |
| Total | 656 (100.0%) | 542 (100.0%) |
Commute Time in Peapack and Gladstone borough
The most frequently occuring commute durations in Peapack and Gladstone borough are 20 to 24 minutes (137 commuters, 13.6%), less than 5 minutes (125 commuters, 12.4%), and 15 to 19 minutes (122 commuters, 12.1%).
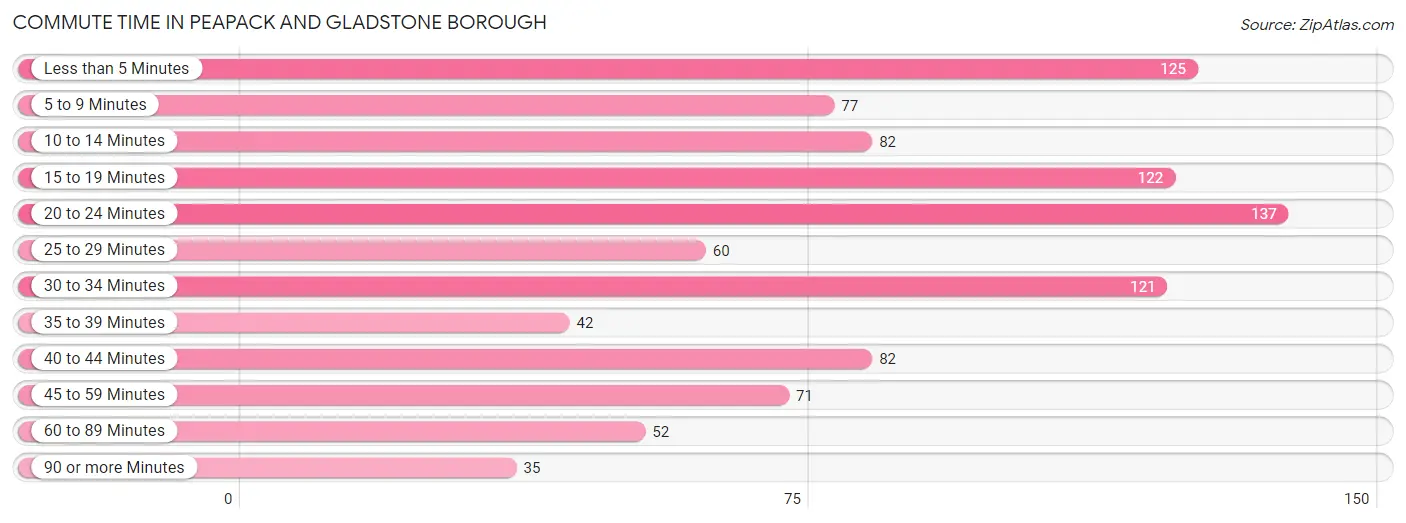
| Commute Time | # Commuters | % Commuters |
| Less than 5 Minutes | 125 | 12.4% |
| 5 to 9 Minutes | 77 | 7.6% |
| 10 to 14 Minutes | 82 | 8.2% |
| 15 to 19 Minutes | 122 | 12.1% |
| 20 to 24 Minutes | 137 | 13.6% |
| 25 to 29 Minutes | 60 | 6.0% |
| 30 to 34 Minutes | 121 | 12.0% |
| 35 to 39 Minutes | 42 | 4.2% |
| 40 to 44 Minutes | 82 | 8.2% |
| 45 to 59 Minutes | 71 | 7.1% |
| 60 to 89 Minutes | 52 | 5.2% |
| 90 or more Minutes | 35 | 3.5% |
Commute Time by Sex in Peapack and Gladstone borough
The most common commute times in Peapack and Gladstone borough are less than 5 minutes (85 commuters, 15.2%) for males and 10 to 14 minutes (82 commuters, 18.3%) for females.
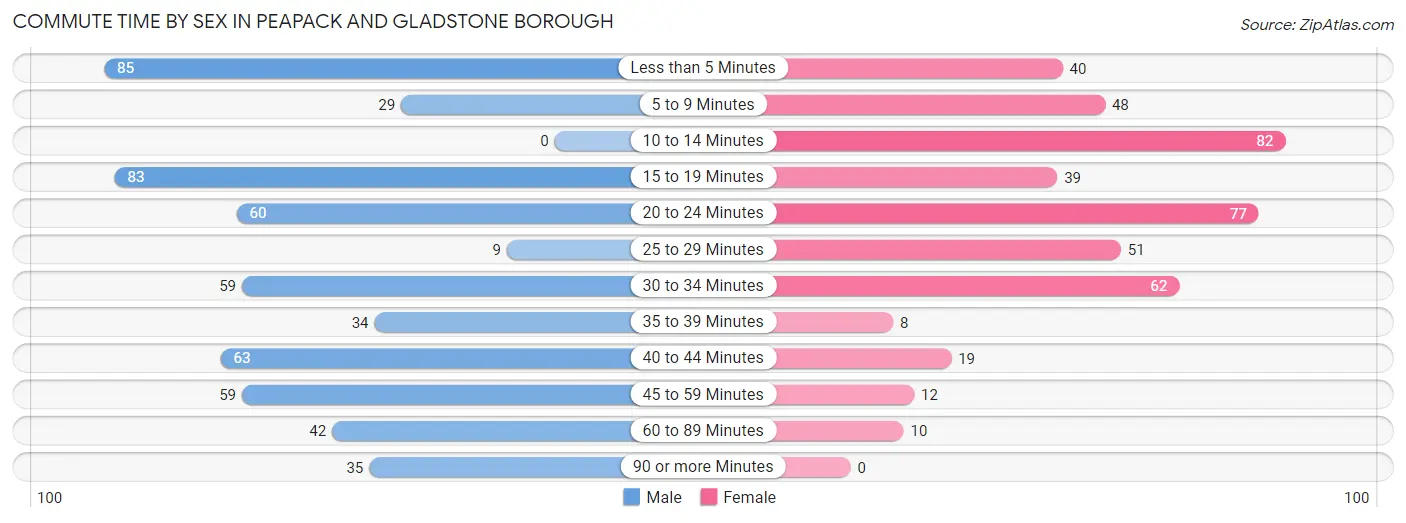
| Commute Time | Male | Female |
| Less than 5 Minutes | 85 (15.2%) | 40 (8.9%) |
| 5 to 9 Minutes | 29 (5.2%) | 48 (10.7%) |
| 10 to 14 Minutes | 0 (0.0%) | 82 (18.3%) |
| 15 to 19 Minutes | 83 (14.9%) | 39 (8.7%) |
| 20 to 24 Minutes | 60 (10.7%) | 77 (17.2%) |
| 25 to 29 Minutes | 9 (1.6%) | 51 (11.4%) |
| 30 to 34 Minutes | 59 (10.6%) | 62 (13.8%) |
| 35 to 39 Minutes | 34 (6.1%) | 8 (1.8%) |
| 40 to 44 Minutes | 63 (11.3%) | 19 (4.2%) |
| 45 to 59 Minutes | 59 (10.6%) | 12 (2.7%) |
| 60 to 89 Minutes | 42 (7.5%) | 10 (2.2%) |
| 90 or more Minutes | 35 (6.3%) | 0 (0.0%) |
Time of Departure to Work by Sex in Peapack and Gladstone borough
The most frequent times of departure to work in Peapack and Gladstone borough are 8:00 AM to 8:29 AM (181, 32.4%) for males and 8:00 AM to 8:29 AM (118, 26.3%) for females.
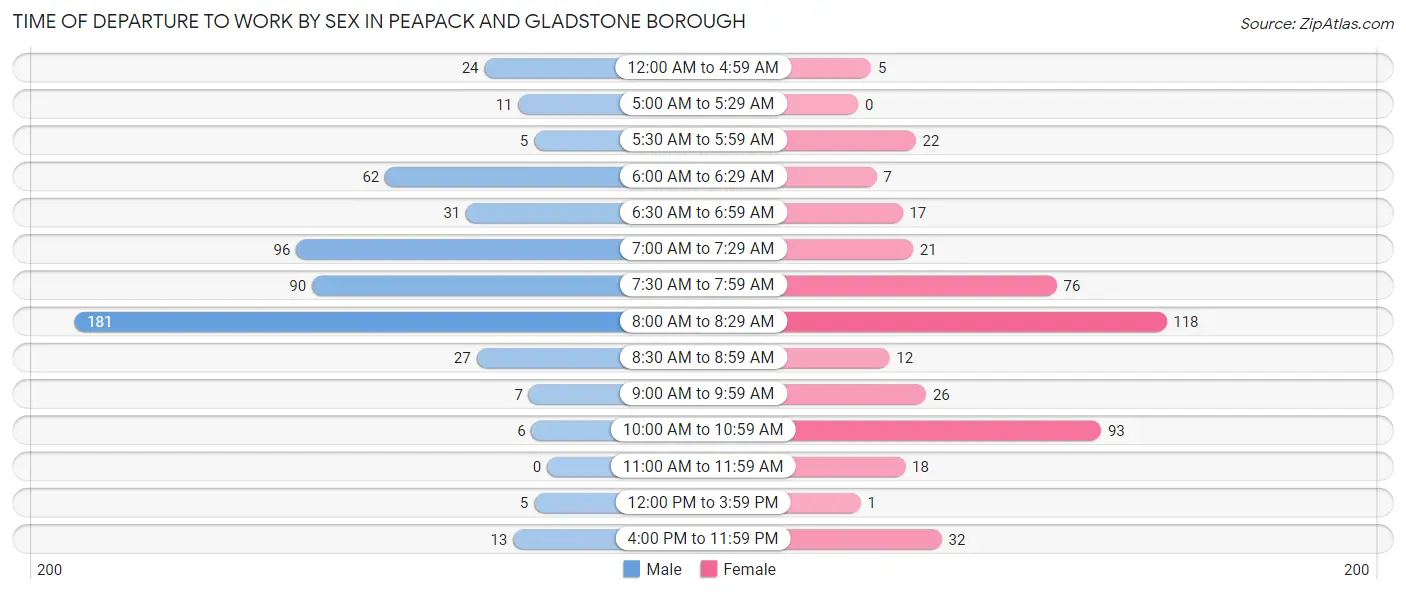
| Time of Departure | Male | Female |
| 12:00 AM to 4:59 AM | 24 (4.3%) | 5 (1.1%) |
| 5:00 AM to 5:29 AM | 11 (2.0%) | 0 (0.0%) |
| 5:30 AM to 5:59 AM | 5 (0.9%) | 22 (4.9%) |
| 6:00 AM to 6:29 AM | 62 (11.1%) | 7 (1.6%) |
| 6:30 AM to 6:59 AM | 31 (5.6%) | 17 (3.8%) |
| 7:00 AM to 7:29 AM | 96 (17.2%) | 21 (4.7%) |
| 7:30 AM to 7:59 AM | 90 (16.1%) | 76 (17.0%) |
| 8:00 AM to 8:29 AM | 181 (32.4%) | 118 (26.3%) |
| 8:30 AM to 8:59 AM | 27 (4.8%) | 12 (2.7%) |
| 9:00 AM to 9:59 AM | 7 (1.3%) | 26 (5.8%) |
| 10:00 AM to 10:59 AM | 6 (1.1%) | 93 (20.8%) |
| 11:00 AM to 11:59 AM | 0 (0.0%) | 18 (4.0%) |
| 12:00 PM to 3:59 PM | 5 (0.9%) | 1 (0.2%) |
| 4:00 PM to 11:59 PM | 13 (2.3%) | 32 (7.1%) |
| Total | 558 (100.0%) | 448 (100.0%) |
Housing Occupancy in Peapack and Gladstone borough
Occupancy by Ownership in Peapack and Gladstone borough
Of the total 940 dwellings in Peapack and Gladstone borough, owner-occupied units account for 704 (74.9%), while renter-occupied units make up 236 (25.1%).
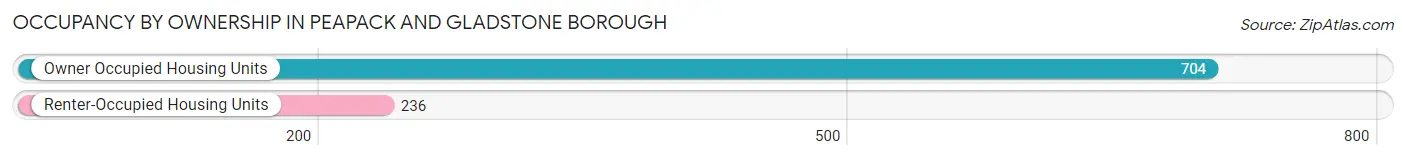
| Occupancy | # Housing Units | % Housing Units |
| Owner Occupied Housing Units | 704 | 74.9% |
| Renter-Occupied Housing Units | 236 | 25.1% |
| Total Occupied Housing Units | 940 | 100.0% |
Occupancy by Household Size in Peapack and Gladstone borough
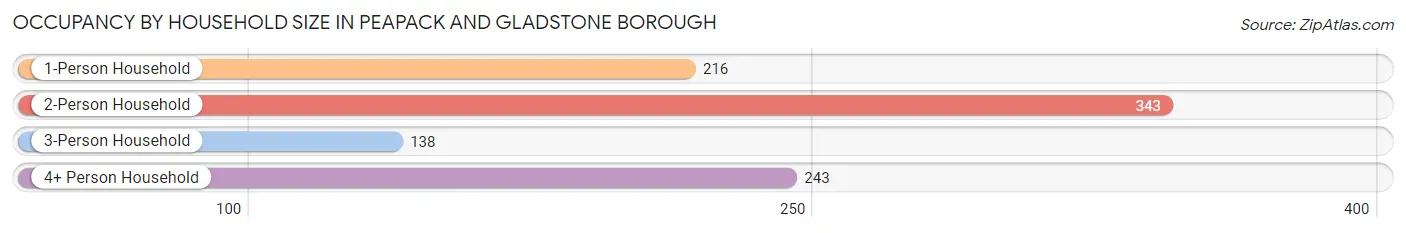
| Household Size | # Housing Units | % Housing Units |
| 1-Person Household | 216 | 23.0% |
| 2-Person Household | 343 | 36.5% |
| 3-Person Household | 138 | 14.7% |
| 4+ Person Household | 243 | 25.9% |
| Total Housing Units | 940 | 100.0% |
Occupancy by Ownership by Household Size in Peapack and Gladstone borough
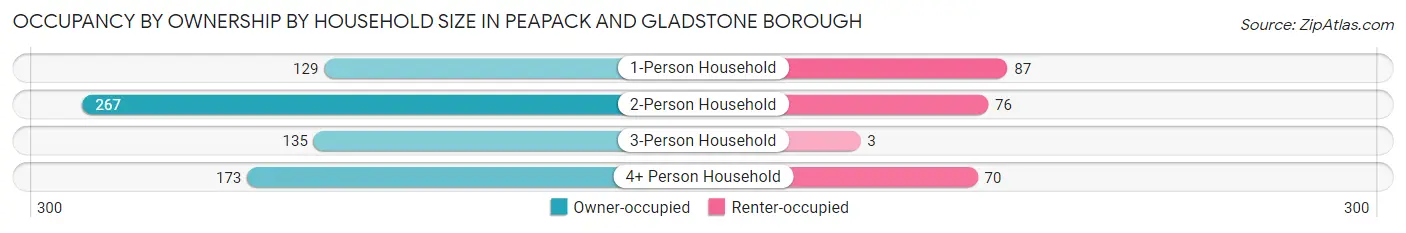
| Household Size | Owner-occupied | Renter-occupied |
| 1-Person Household | 129 (59.7%) | 87 (40.3%) |
| 2-Person Household | 267 (77.8%) | 76 (22.2%) |
| 3-Person Household | 135 (97.8%) | 3 (2.2%) |
| 4+ Person Household | 173 (71.2%) | 70 (28.8%) |
| Total Housing Units | 704 (74.9%) | 236 (25.1%) |
Occupancy by Educational Attainment in Peapack and Gladstone borough
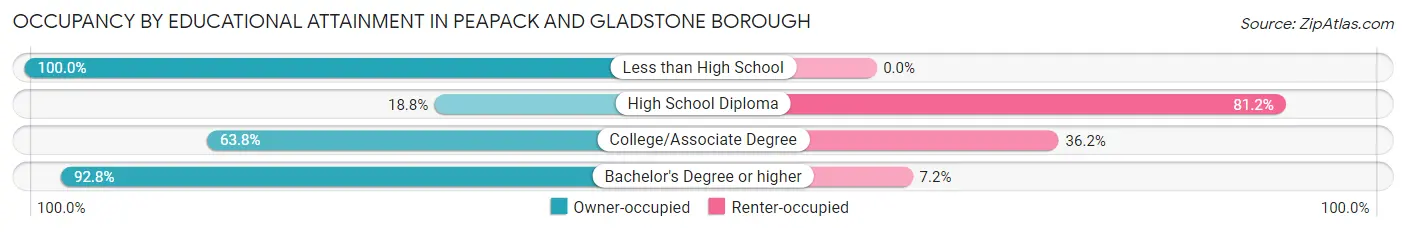
| Household Size | Owner-occupied | Renter-occupied |
| Less than High School | 23 (100.0%) | 0 (0.0%) |
| High School Diploma | 32 (18.8%) | 138 (81.2%) |
| College/Associate Degree | 97 (63.8%) | 55 (36.2%) |
| Bachelor's Degree or higher | 552 (92.8%) | 43 (7.2%) |
Occupancy by Age of Householder in Peapack and Gladstone borough
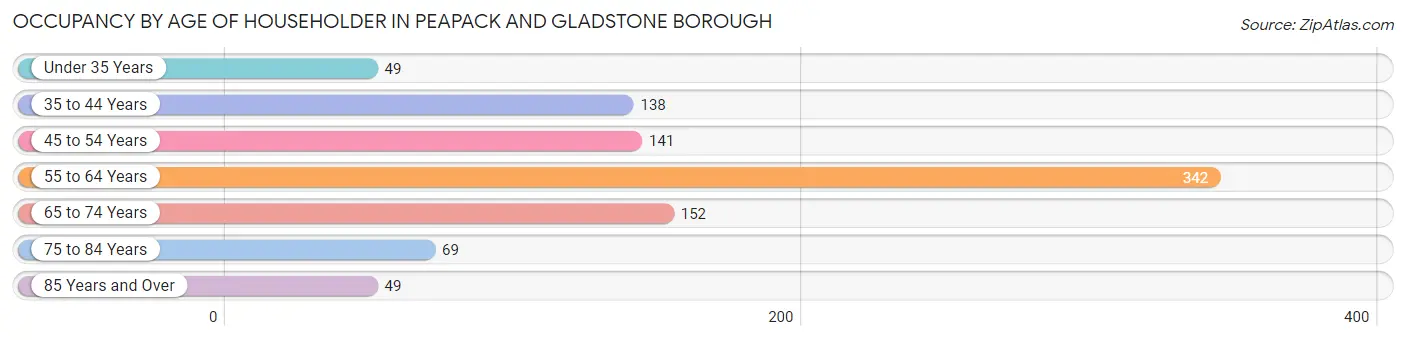
| Age Bracket | # Households | % Households |
| Under 35 Years | 49 | 5.2% |
| 35 to 44 Years | 138 | 14.7% |
| 45 to 54 Years | 141 | 15.0% |
| 55 to 64 Years | 342 | 36.4% |
| 65 to 74 Years | 152 | 16.2% |
| 75 to 84 Years | 69 | 7.3% |
| 85 Years and Over | 49 | 5.2% |
| Total | 940 | 100.0% |
Housing Finances in Peapack and Gladstone borough
Median Income by Occupancy in Peapack and Gladstone borough
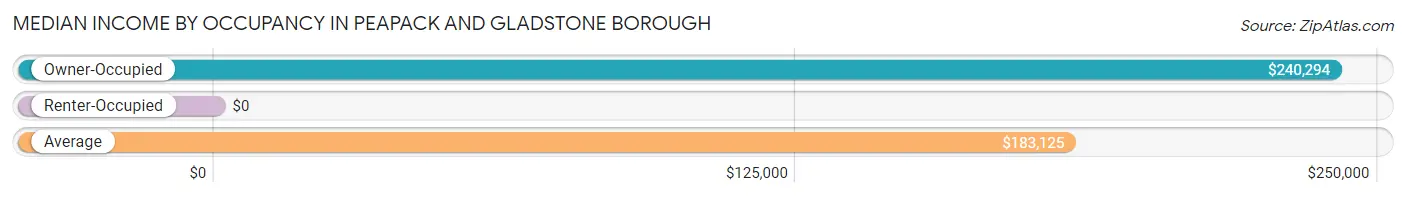
| Occupancy Type | # Households | Median Income |
| Owner-Occupied | 704 (74.9%) | $240,294 |
| Renter-Occupied | 236 (25.1%) | $0 |
| Average | 940 (100.0%) | $183,125 |
Occupancy by Householder Income Bracket in Peapack and Gladstone borough
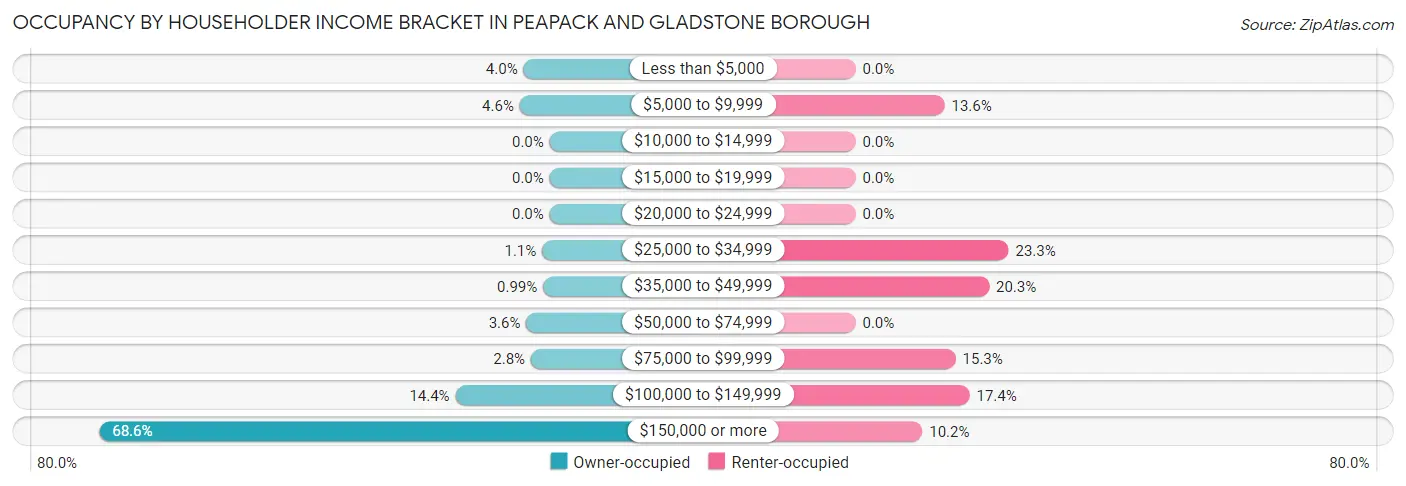
| Income Bracket | Owner-occupied | Renter-occupied |
| Less than $5,000 | 28 (4.0%) | 0 (0.0%) |
| $5,000 to $9,999 | 32 (4.5%) | 32 (13.6%) |
| $10,000 to $14,999 | 0 (0.0%) | 0 (0.0%) |
| $15,000 to $19,999 | 0 (0.0%) | 0 (0.0%) |
| $20,000 to $24,999 | 0 (0.0%) | 0 (0.0%) |
| $25,000 to $34,999 | 8 (1.1%) | 55 (23.3%) |
| $35,000 to $49,999 | 7 (1.0%) | 48 (20.3%) |
| $50,000 to $74,999 | 25 (3.5%) | 0 (0.0%) |
| $75,000 to $99,999 | 20 (2.8%) | 36 (15.2%) |
| $100,000 to $149,999 | 101 (14.3%) | 41 (17.4%) |
| $150,000 or more | 483 (68.6%) | 24 (10.2%) |
| Total | 704 (100.0%) | 236 (100.0%) |
Monthly Housing Cost Tiers in Peapack and Gladstone borough
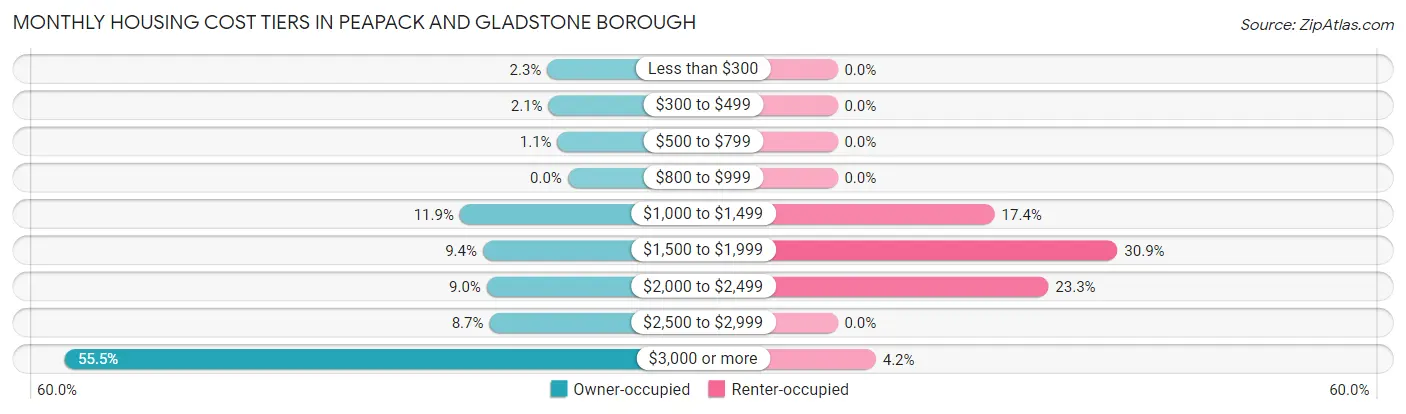
| Monthly Cost | Owner-occupied | Renter-occupied |
| Less than $300 | 16 (2.3%) | 0 (0.0%) |
| $300 to $499 | 15 (2.1%) | 0 (0.0%) |
| $500 to $799 | 8 (1.1%) | 0 (0.0%) |
| $800 to $999 | 0 (0.0%) | 0 (0.0%) |
| $1,000 to $1,499 | 84 (11.9%) | 41 (17.4%) |
| $1,500 to $1,999 | 66 (9.4%) | 73 (30.9%) |
| $2,000 to $2,499 | 63 (8.9%) | 55 (23.3%) |
| $2,500 to $2,999 | 61 (8.7%) | 0 (0.0%) |
| $3,000 or more | 391 (55.5%) | 10 (4.2%) |
| Total | 704 (100.0%) | 236 (100.0%) |
Physical Housing Characteristics in Peapack and Gladstone borough
Housing Structures in Peapack and Gladstone borough
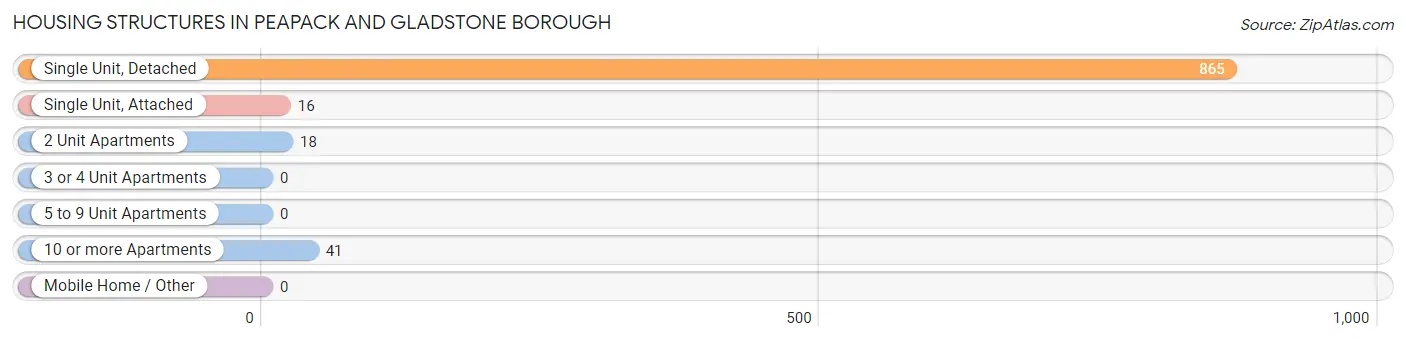
| Structure Type | # Housing Units | % Housing Units |
| Single Unit, Detached | 865 | 92.0% |
| Single Unit, Attached | 16 | 1.7% |
| 2 Unit Apartments | 18 | 1.9% |
| 3 or 4 Unit Apartments | 0 | 0.0% |
| 5 to 9 Unit Apartments | 0 | 0.0% |
| 10 or more Apartments | 41 | 4.4% |
| Mobile Home / Other | 0 | 0.0% |
| Total | 940 | 100.0% |
Housing Structures by Occupancy in Peapack and Gladstone borough
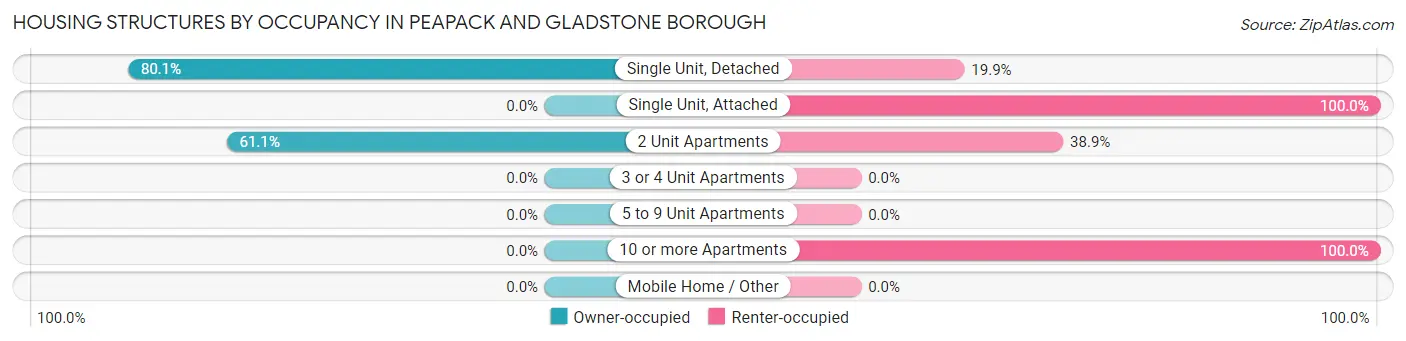
| Structure Type | Owner-occupied | Renter-occupied |
| Single Unit, Detached | 693 (80.1%) | 172 (19.9%) |
| Single Unit, Attached | 0 (0.0%) | 16 (100.0%) |
| 2 Unit Apartments | 11 (61.1%) | 7 (38.9%) |
| 3 or 4 Unit Apartments | 0 (0.0%) | 0 (0.0%) |
| 5 to 9 Unit Apartments | 0 (0.0%) | 0 (0.0%) |
| 10 or more Apartments | 0 (0.0%) | 41 (100.0%) |
| Mobile Home / Other | 0 (0.0%) | 0 (0.0%) |
| Total | 704 (74.9%) | 236 (25.1%) |
Housing Structures by Number of Rooms in Peapack and Gladstone borough
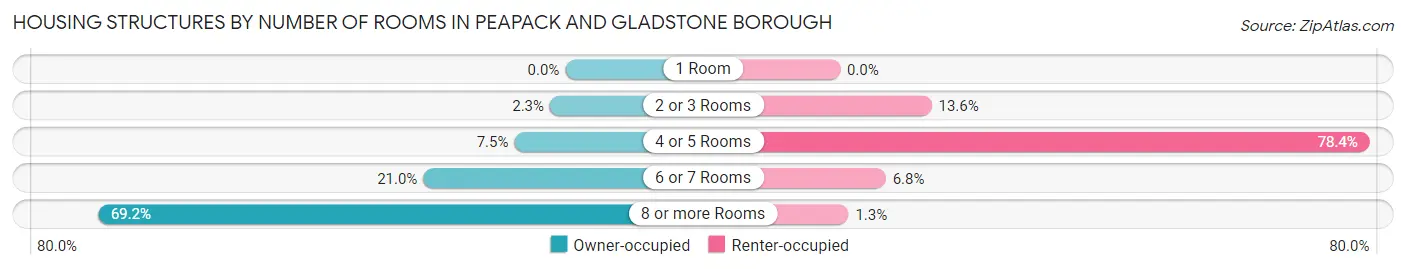
| Number of Rooms | Owner-occupied | Renter-occupied |
| 1 Room | 0 (0.0%) | 0 (0.0%) |
| 2 or 3 Rooms | 16 (2.3%) | 32 (13.6%) |
| 4 or 5 Rooms | 53 (7.5%) | 185 (78.4%) |
| 6 or 7 Rooms | 148 (21.0%) | 16 (6.8%) |
| 8 or more Rooms | 487 (69.2%) | 3 (1.3%) |
| Total | 704 (100.0%) | 236 (100.0%) |
Housing Structure by Heating Type in Peapack and Gladstone borough
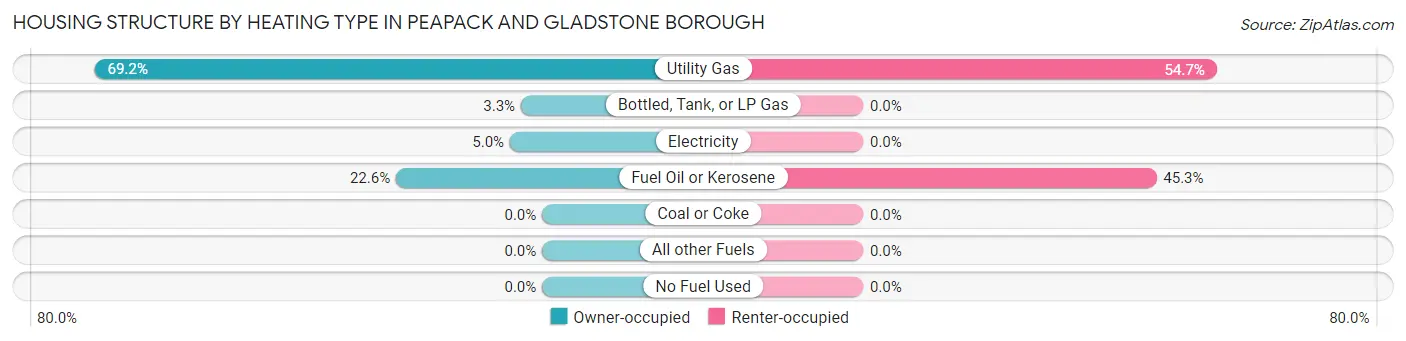
| Heating Type | Owner-occupied | Renter-occupied |
| Utility Gas | 487 (69.2%) | 129 (54.7%) |
| Bottled, Tank, or LP Gas | 23 (3.3%) | 0 (0.0%) |
| Electricity | 35 (5.0%) | 0 (0.0%) |
| Fuel Oil or Kerosene | 159 (22.6%) | 107 (45.3%) |
| Coal or Coke | 0 (0.0%) | 0 (0.0%) |
| All other Fuels | 0 (0.0%) | 0 (0.0%) |
| No Fuel Used | 0 (0.0%) | 0 (0.0%) |
| Total | 704 (100.0%) | 236 (100.0%) |
Household Vehicle Usage in Peapack and Gladstone borough
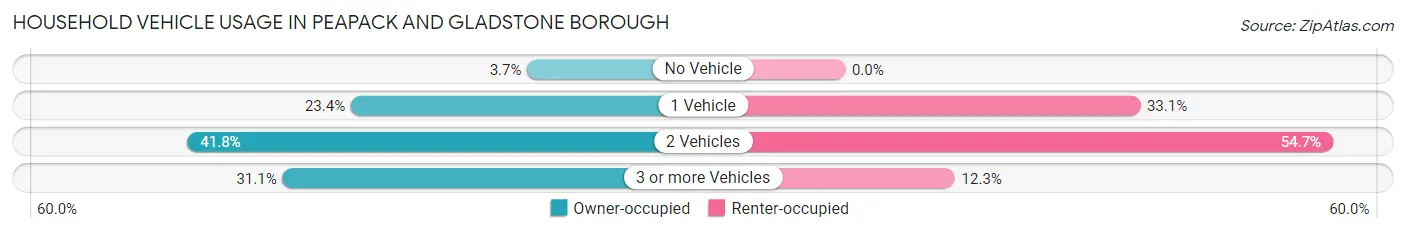
| Vehicles per Household | Owner-occupied | Renter-occupied |
| No Vehicle | 26 (3.7%) | 0 (0.0%) |
| 1 Vehicle | 165 (23.4%) | 78 (33.1%) |
| 2 Vehicles | 294 (41.8%) | 129 (54.7%) |
| 3 or more Vehicles | 219 (31.1%) | 29 (12.3%) |
| Total | 704 (100.0%) | 236 (100.0%) |
Real Estate & Mortgages in Peapack and Gladstone borough
Real Estate and Mortgage Overview in Peapack and Gladstone borough
| Characteristic | Without Mortgage | With Mortgage |
| Housing Units | 243 | 461 |
| Median Property Value | $856,900 | $813,300 |
| Median Household Income | $154,531 | $355 |
| Monthly Housing Costs | $1,501 | $358 |
| Real Estate Taxes | $10,001 | $15 |
Property Value by Mortgage Status in Peapack and Gladstone borough
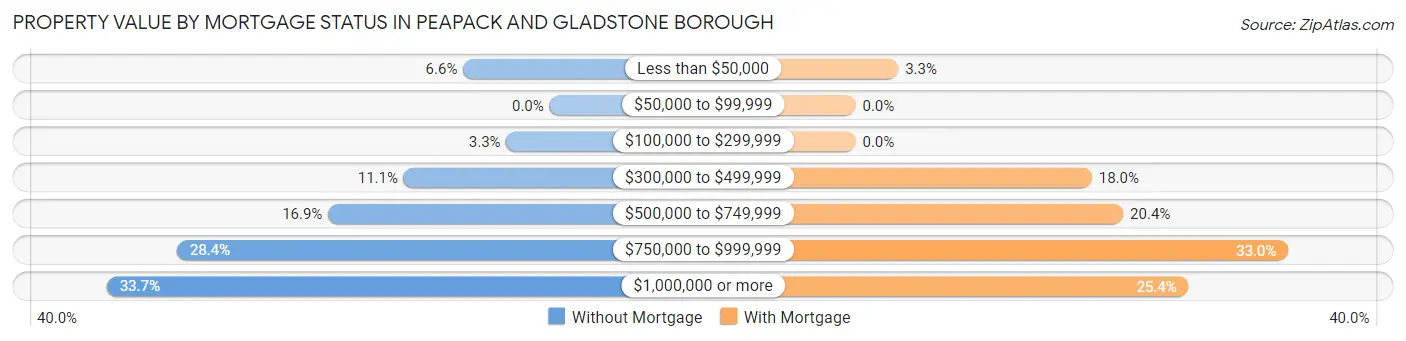
| Property Value | Without Mortgage | With Mortgage |
| Less than $50,000 | 16 (6.6%) | 15 (3.3%) |
| $50,000 to $99,999 | 0 (0.0%) | 0 (0.0%) |
| $100,000 to $299,999 | 8 (3.3%) | 0 (0.0%) |
| $300,000 to $499,999 | 27 (11.1%) | 83 (18.0%) |
| $500,000 to $749,999 | 41 (16.9%) | 94 (20.4%) |
| $750,000 to $999,999 | 69 (28.4%) | 152 (33.0%) |
| $1,000,000 or more | 82 (33.7%) | 117 (25.4%) |
| Total | 243 (100.0%) | 461 (100.0%) |
Household Income by Mortgage Status in Peapack and Gladstone borough
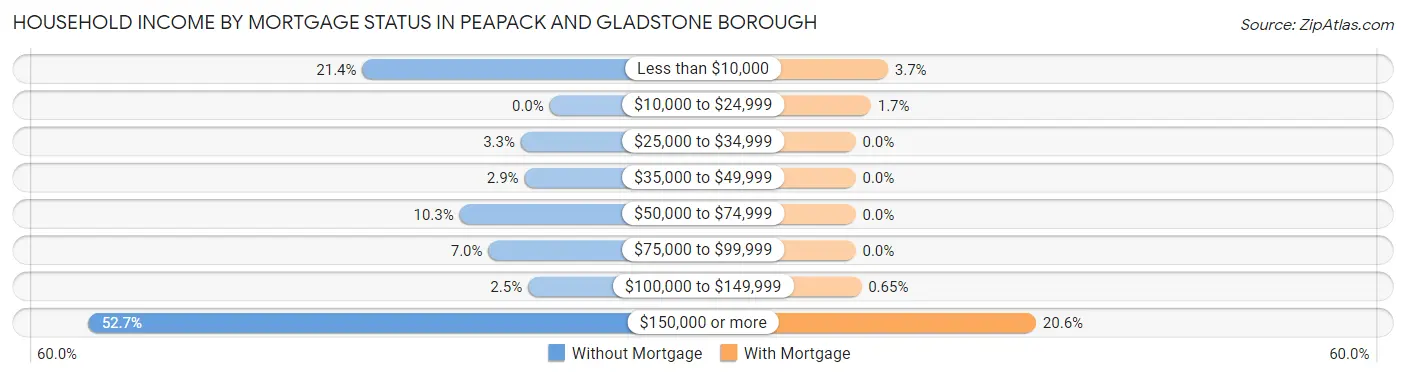
| Household Income | Without Mortgage | With Mortgage |
| Less than $10,000 | 52 (21.4%) | 17 (3.7%) |
| $10,000 to $24,999 | 0 (0.0%) | 8 (1.7%) |
| $25,000 to $34,999 | 8 (3.3%) | 0 (0.0%) |
| $35,000 to $49,999 | 7 (2.9%) | 0 (0.0%) |
| $50,000 to $74,999 | 25 (10.3%) | 0 (0.0%) |
| $75,000 to $99,999 | 17 (7.0%) | 0 (0.0%) |
| $100,000 to $149,999 | 6 (2.5%) | 3 (0.6%) |
| $150,000 or more | 128 (52.7%) | 95 (20.6%) |
| Total | 243 (100.0%) | 461 (100.0%) |
Property Value to Household Income Ratio in Peapack and Gladstone borough
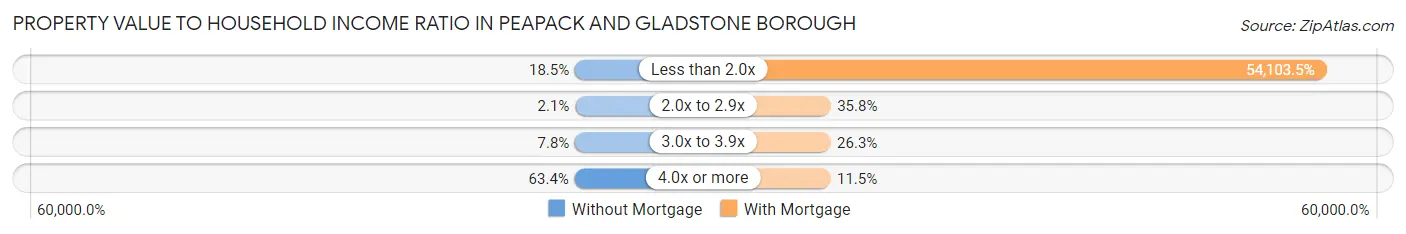
| Value-to-Income Ratio | Without Mortgage | With Mortgage |
| Less than 2.0x | 45 (18.5%) | 249,417 (54,103.5%) |
| 2.0x to 2.9x | 5 (2.1%) | 165 (35.8%) |
| 3.0x to 3.9x | 19 (7.8%) | 121 (26.3%) |
| 4.0x or more | 154 (63.4%) | 53 (11.5%) |
| Total | 243 (100.0%) | 461 (100.0%) |
Real Estate Taxes by Mortgage Status in Peapack and Gladstone borough
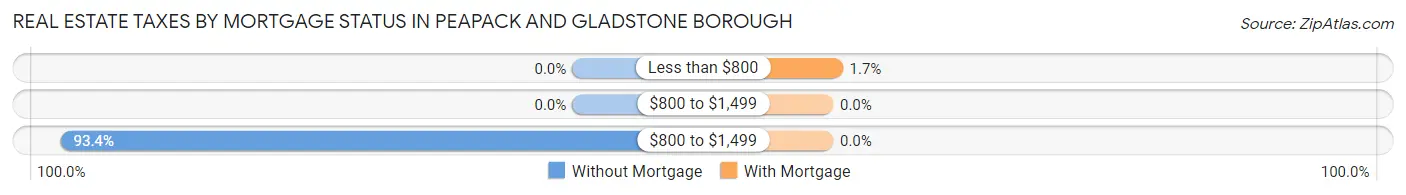
| Property Taxes | Without Mortgage | With Mortgage |
| Less than $800 | 0 (0.0%) | 8 (1.7%) |
| $800 to $1,499 | 0 (0.0%) | 0 (0.0%) |
| $800 to $1,499 | 227 (93.4%) | 0 (0.0%) |
| Total | 243 (100.0%) | 461 (100.0%) |
Health & Disability in Peapack and Gladstone borough
Health Insurance Coverage by Age in Peapack and Gladstone borough
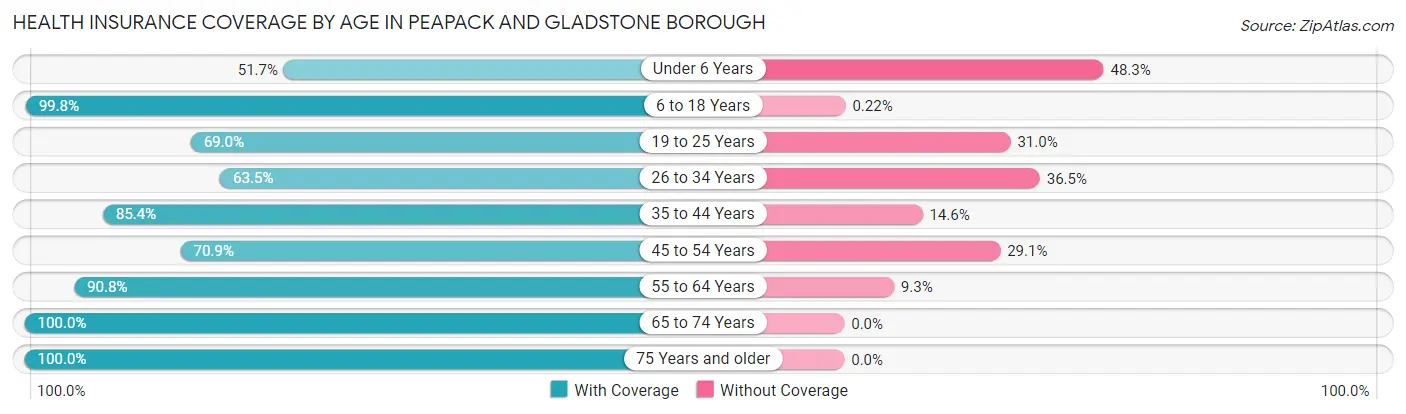
| Age Bracket | With Coverage | Without Coverage |
| Under 6 Years | 78 (51.7%) | 73 (48.3%) |
| 6 to 18 Years | 449 (99.8%) | 1 (0.2%) |
| 19 to 25 Years | 98 (69.0%) | 44 (31.0%) |
| 26 to 34 Years | 61 (63.5%) | 35 (36.5%) |
| 35 to 44 Years | 252 (85.4%) | 43 (14.6%) |
| 45 to 54 Years | 200 (70.9%) | 82 (29.1%) |
| 55 to 64 Years | 461 (90.7%) | 47 (9.2%) |
| 65 to 74 Years | 290 (100.0%) | 0 (0.0%) |
| 75 Years and older | 196 (100.0%) | 0 (0.0%) |
| Total | 2,085 (86.5%) | 325 (13.5%) |
Health Insurance Coverage by Citizenship Status in Peapack and Gladstone borough
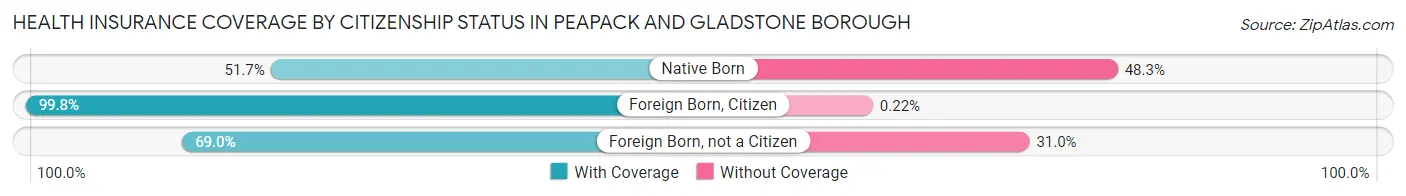
| Citizenship Status | With Coverage | Without Coverage |
| Native Born | 78 (51.7%) | 73 (48.3%) |
| Foreign Born, Citizen | 449 (99.8%) | 1 (0.2%) |
| Foreign Born, not a Citizen | 98 (69.0%) | 44 (31.0%) |
Health Insurance Coverage by Household Income in Peapack and Gladstone borough
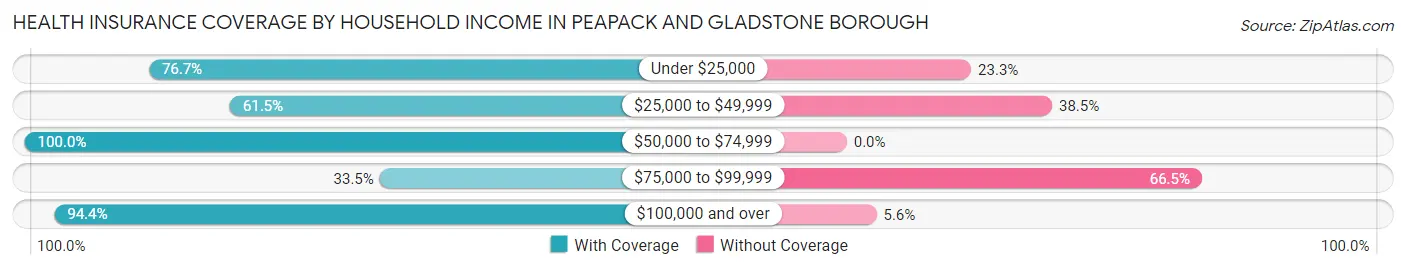
| Household Income | With Coverage | Without Coverage |
| Under $25,000 | 79 (76.7%) | 24 (23.3%) |
| $25,000 to $49,999 | 88 (61.5%) | 55 (38.5%) |
| $50,000 to $74,999 | 48 (100.0%) | 0 (0.0%) |
| $75,000 to $99,999 | 70 (33.5%) | 139 (66.5%) |
| $100,000 and over | 1,796 (94.4%) | 106 (5.6%) |
Public vs Private Health Insurance Coverage by Age in Peapack and Gladstone borough
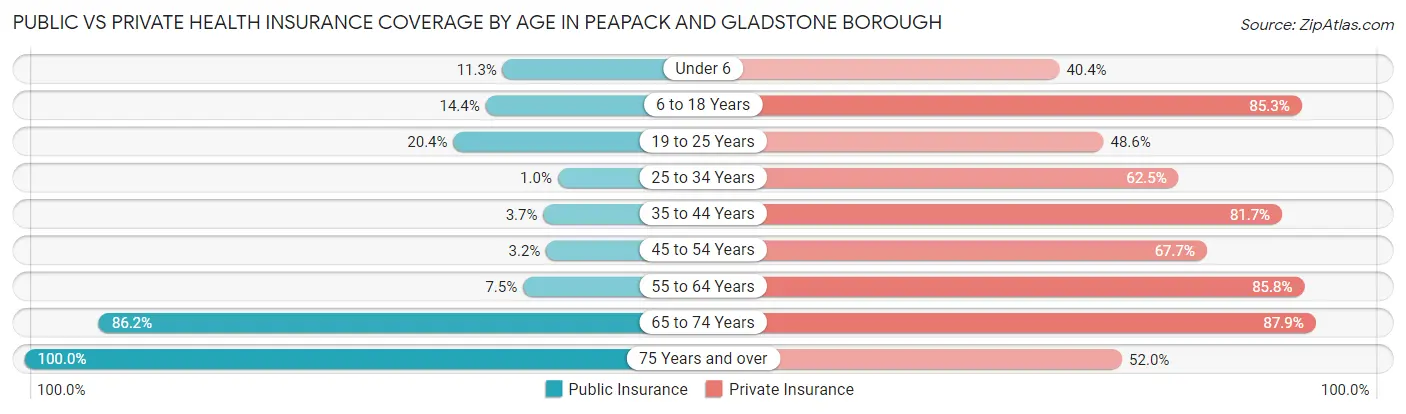
| Age Bracket | Public Insurance | Private Insurance |
| Under 6 | 17 (11.3%) | 61 (40.4%) |
| 6 to 18 Years | 65 (14.4%) | 384 (85.3%) |
| 19 to 25 Years | 29 (20.4%) | 69 (48.6%) |
| 25 to 34 Years | 1 (1.0%) | 60 (62.5%) |
| 35 to 44 Years | 11 (3.7%) | 241 (81.7%) |
| 45 to 54 Years | 9 (3.2%) | 191 (67.7%) |
| 55 to 64 Years | 38 (7.5%) | 436 (85.8%) |
| 65 to 74 Years | 250 (86.2%) | 255 (87.9%) |
| 75 Years and over | 196 (100.0%) | 102 (52.0%) |
| Total | 616 (25.6%) | 1,799 (74.7%) |
Disability Status by Sex by Age in Peapack and Gladstone borough
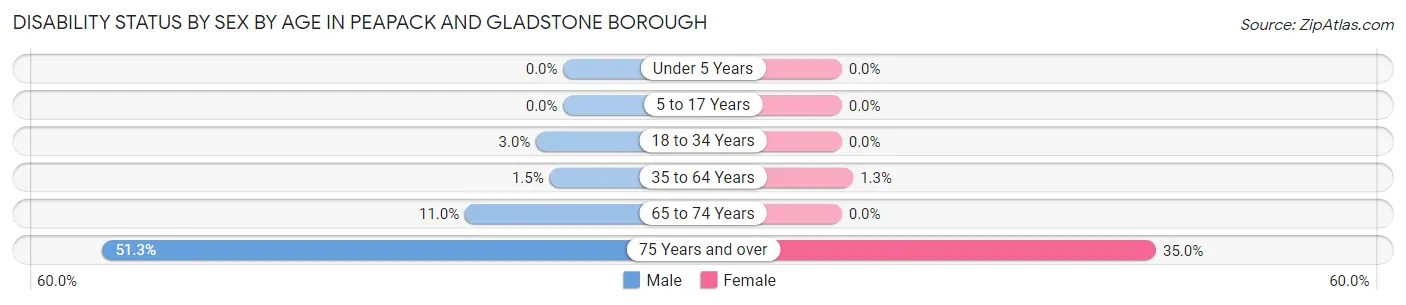
| Age Bracket | Male | Female |
| Under 5 Years | 0 (0.0%) | 0 (0.0%) |
| 5 to 17 Years | 0 (0.0%) | 0 (0.0%) |
| 18 to 34 Years | 5 (3.0%) | 0 (0.0%) |
| 35 to 64 Years | 7 (1.5%) | 8 (1.3%) |
| 65 to 74 Years | 23 (11.0%) | 0 (0.0%) |
| 75 Years and over | 39 (51.3%) | 42 (35.0%) |
Disability Class by Sex by Age in Peapack and Gladstone borough
Disability Class: Hearing Difficulty
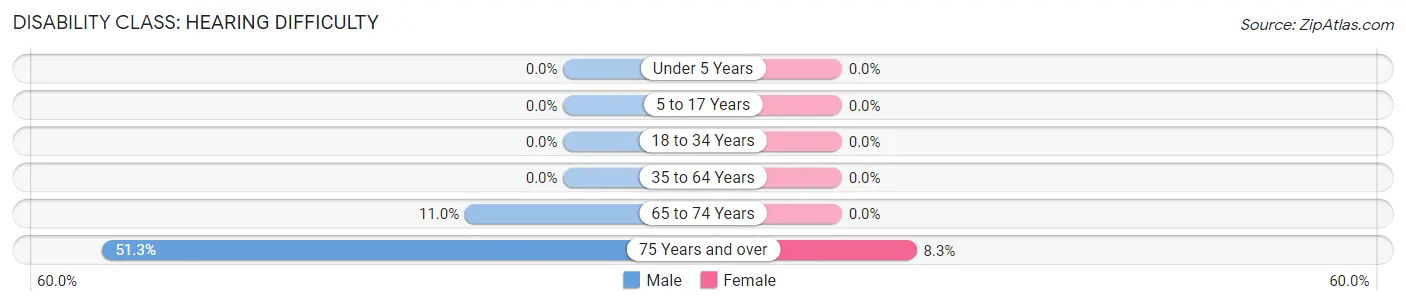
| Age Bracket | Male | Female |
| Under 5 Years | 0 (0.0%) | 0 (0.0%) |
| 5 to 17 Years | 0 (0.0%) | 0 (0.0%) |
| 18 to 34 Years | 0 (0.0%) | 0 (0.0%) |
| 35 to 64 Years | 0 (0.0%) | 0 (0.0%) |
| 65 to 74 Years | 23 (11.0%) | 0 (0.0%) |
| 75 Years and over | 39 (51.3%) | 10 (8.3%) |
Disability Class: Vision Difficulty
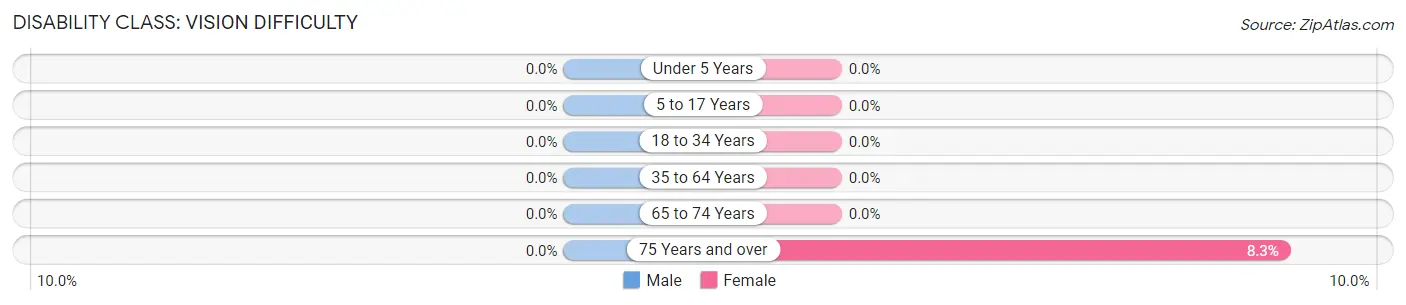
| Age Bracket | Male | Female |
| Under 5 Years | 0 (0.0%) | 0 (0.0%) |
| 5 to 17 Years | 0 (0.0%) | 0 (0.0%) |
| 18 to 34 Years | 0 (0.0%) | 0 (0.0%) |
| 35 to 64 Years | 0 (0.0%) | 0 (0.0%) |
| 65 to 74 Years | 0 (0.0%) | 0 (0.0%) |
| 75 Years and over | 0 (0.0%) | 10 (8.3%) |
Disability Class: Cognitive Difficulty
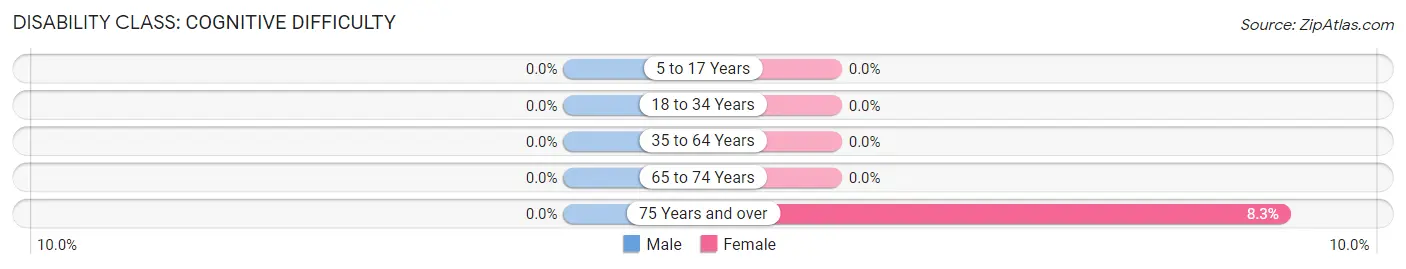
| Age Bracket | Male | Female |
| 5 to 17 Years | 0 (0.0%) | 0 (0.0%) |
| 18 to 34 Years | 0 (0.0%) | 0 (0.0%) |
| 35 to 64 Years | 0 (0.0%) | 0 (0.0%) |
| 65 to 74 Years | 0 (0.0%) | 0 (0.0%) |
| 75 Years and over | 0 (0.0%) | 10 (8.3%) |
Disability Class: Ambulatory Difficulty
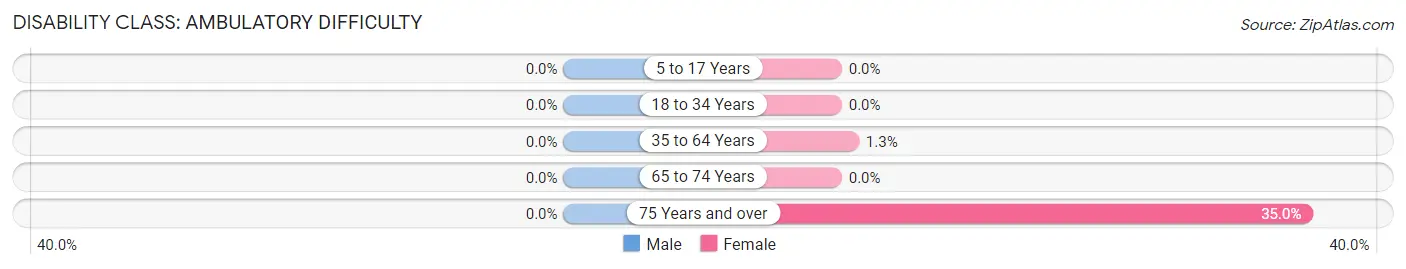
| Age Bracket | Male | Female |
| 5 to 17 Years | 0 (0.0%) | 0 (0.0%) |
| 18 to 34 Years | 0 (0.0%) | 0 (0.0%) |
| 35 to 64 Years | 0 (0.0%) | 8 (1.3%) |
| 65 to 74 Years | 0 (0.0%) | 0 (0.0%) |
| 75 Years and over | 0 (0.0%) | 42 (35.0%) |
Disability Class: Self-Care Difficulty
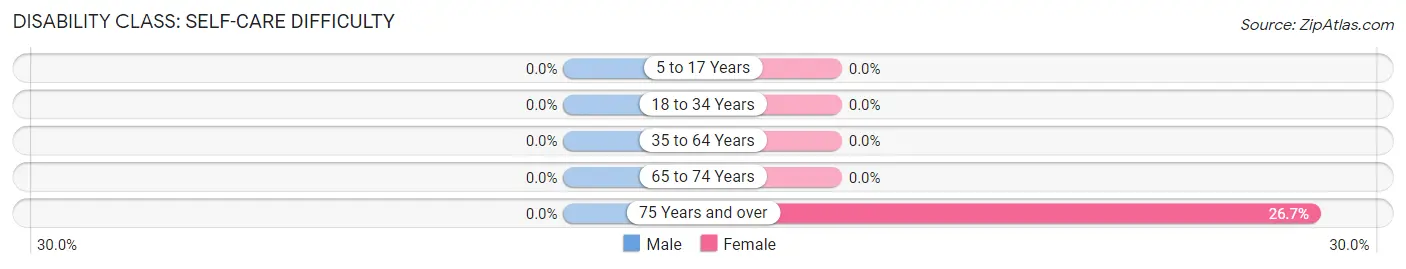
| Age Bracket | Male | Female |
| 5 to 17 Years | 0 (0.0%) | 0 (0.0%) |
| 18 to 34 Years | 0 (0.0%) | 0 (0.0%) |
| 35 to 64 Years | 0 (0.0%) | 0 (0.0%) |
| 65 to 74 Years | 0 (0.0%) | 0 (0.0%) |
| 75 Years and over | 0 (0.0%) | 32 (26.7%) |
Technology Access in Peapack and Gladstone borough
Computing Device Access in Peapack and Gladstone borough
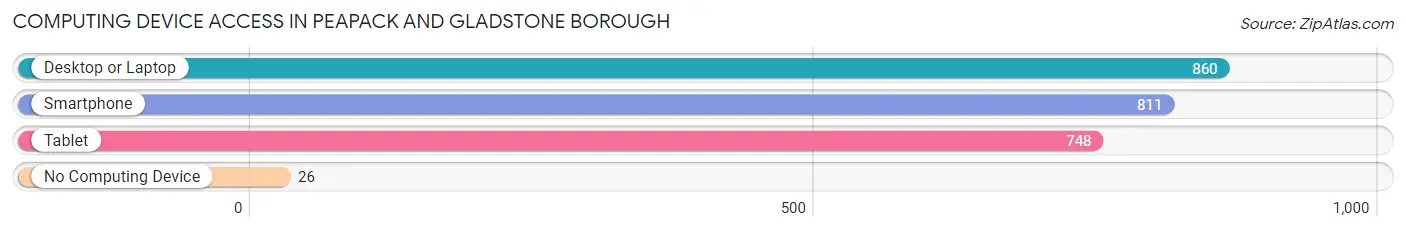
| Device Type | # Households | % Households |
| Desktop or Laptop | 860 | 91.5% |
| Smartphone | 811 | 86.3% |
| Tablet | 748 | 79.6% |
| No Computing Device | 26 | 2.8% |
| Total | 940 | 100.0% |
Internet Access in Peapack and Gladstone borough
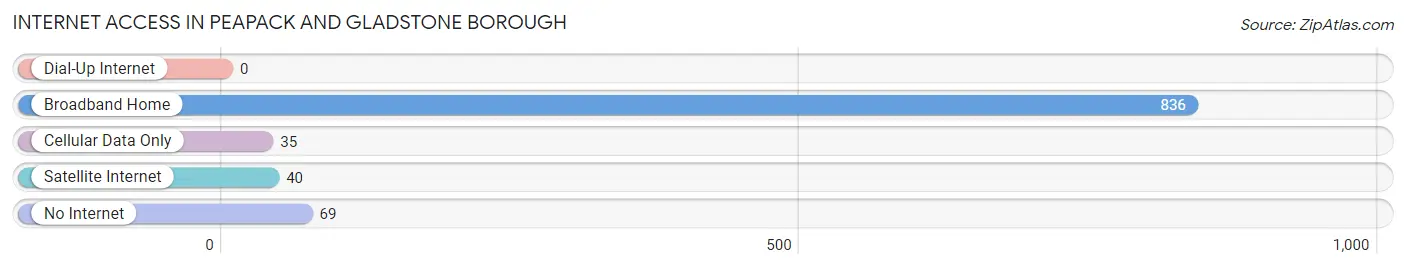
| Internet Type | # Households | % Households |
| Dial-Up Internet | 0 | 0.0% |
| Broadband Home | 836 | 88.9% |
| Cellular Data Only | 35 | 3.7% |
| Satellite Internet | 40 | 4.3% |
| No Internet | 69 | 7.3% |
| Total | 940 | 100.0% |
Peapack and Gladstone borough Summary
Peapack and Gladstone Borough is a small borough located in Somerset County, New Jersey. It is situated in the Raritan Valley region of New Jersey, and is bordered by Bedminster Township to the north, Far Hills Borough to the east, Bernards Township to the south, and the Borough of Somerville to the west. The borough is home to a population of approximately 2,582 people, according to the 2010 United States Census.
History
Peapack and Gladstone Borough was originally part of Bedminster Township, which was established in 1749. In 1912, the Borough of Peapack and Gladstone was created from the northern part of Bedminster Township. The borough was named after the two villages of Peapack and Gladstone, which were both established in the late 1700s. The two villages were named after the Peapack and Gladstone families, who were prominent landowners in the area.
Geography
Peapack and Gladstone Borough is located in the Raritan Valley region of New Jersey. It is situated in the northern part of Somerset County, and is bordered by Bedminster Township to the north, Far Hills Borough to the east, Bernards Township to the south, and the Borough of Somerville to the west. The borough covers an area of 4.2 square miles, and is home to a population of approximately 2,582 people, according to the 2010 United States Census.
The borough is located in a rural area, and is home to several small villages, including Peapack, Gladstone, Pottersville, and Pluckemin. The borough is also home to several parks, including the Peapack-Gladstone Park, which is located in the center of the borough.
Economy
Peapack and Gladstone Borough is home to a variety of businesses, including retail stores, restaurants, and professional services. The borough is also home to several financial institutions, including the Peapack-Gladstone Bank, which is headquartered in the borough.
The borough is also home to several large employers, including the Peapack-Gladstone Bank, which employs over 500 people, and the Somerset Hills School District, which employs over 400 people.
Demographics
According to the 2010 United States Census, Peapack and Gladstone Borough had a population of 2,582 people. The racial makeup of the borough was 94.3% White, 1.2% African American, 0.2% Native American, 2.2% Asian, 0.1% Pacific Islander, 0.7% from other races, and 1.4% from two or more races. Hispanic or Latino of any race were 4.2% of the population.
The median household income in the borough was $117,917, and the median family income was $133,917. The per capita income in the borough was $50,917. About 2.2% of families and 3.2% of the population were below the poverty line, including 3.7% of those under age 18 and 0.0% of those age 65 or over.
Common Questions
What is Per Capita Income in Peapack and Gladstone borough?
Per Capita income in Peapack and Gladstone borough is $103,719.
What is the Median Family Income in Peapack and Gladstone borough?
Median Family Income in Peapack and Gladstone borough is $221,000.
What is the Median Household income in Peapack and Gladstone borough?
Median Household Income in Peapack and Gladstone borough is $183,125.
What is Income or Wage Gap in Peapack and Gladstone borough?
Income or Wage Gap in Peapack and Gladstone borough is 52.4%.
Women in Peapack and Gladstone borough earn 47.6 cents for every dollar earned by a man.
What is Inequality or Gini Index in Peapack and Gladstone borough?
Inequality or Gini Index in Peapack and Gladstone borough is 0.55.
What is the Total Population of Peapack and Gladstone borough?
Total Population of Peapack and Gladstone borough is 2,561.
What is the Total Male Population of Peapack and Gladstone borough?
Total Male Population of Peapack and Gladstone borough is 1,208.
What is the Total Female Population of Peapack and Gladstone borough?
Total Female Population of Peapack and Gladstone borough is 1,353.
What is the Ratio of Males per 100 Females in Peapack and Gladstone borough?
There are 89.28 Males per 100 Females in Peapack and Gladstone borough.
What is the Ratio of Females per 100 Males in Peapack and Gladstone borough?
There are 112.00 Females per 100 Males in Peapack and Gladstone borough.
What is the Median Population Age in Peapack and Gladstone borough?
Median Population Age in Peapack and Gladstone borough is 44.9 Years.
What is the Average Family Size in Peapack and Gladstone borough
Average Family Size in Peapack and Gladstone borough is 3.0 People.
What is the Average Household Size in Peapack and Gladstone borough
Average Household Size in Peapack and Gladstone borough is 2.6 People.
How Large is the Labor Force in Peapack and Gladstone borough?
There are 1,236 People in the Labor Forcein in Peapack and Gladstone borough.
What is the Percentage of People in the Labor Force in Peapack and Gladstone borough?
61.2% of People are in the Labor Force in Peapack and Gladstone borough.
What is the Unemployment Rate in Peapack and Gladstone borough?
Unemployment Rate in Peapack and Gladstone borough is 1.8%.