Hillsdale borough, NJ Map & Demographics
Hillsdale borough Overview
$66,663
PER CAPITA INCOME
$198,176
AVG FAMILY INCOME
$175,802
AVG HOUSEHOLD INCOME
34.9%
WAGE / INCOME GAP [ % ]
65.1¢/ $1
WAGE / INCOME GAP [ $ ]
0.39
INEQUALITY / GINI INDEX
10,125
TOTAL POPULATION
4,651
MALE POPULATION
5,474
FEMALE POPULATION
84.97
MALES / 100 FEMALES
117.70
FEMALES / 100 MALES
42.2
MEDIAN AGE
3.3
AVG FAMILY SIZE
3.0
AVG HOUSEHOLD SIZE
5,993
LABOR FORCE [ PEOPLE ]
71.9%
PERCENT IN LABOR FORCE
2.9%
UNEMPLOYMENT RATE
Income in Hillsdale borough
Income Overview in Hillsdale borough
Per Capita Income in Hillsdale borough is $66,663, while median incomes of families and households are $198,176 and $175,802 respectively.
| Characteristic | Number | Measure |
| Per Capita Income | 10,125 | $66,663 |
| Median Family Income | 2,714 | $198,176 |
| Mean Family Income | 2,714 | $221,100 |
| Median Household Income | 3,416 | $175,802 |
| Mean Household Income | 3,416 | $197,759 |
| Income Deficit | 2,714 | $0 |
| Wage / Income Gap (%) | 10,125 | 34.89% |
| Wage / Income Gap ($) | 10,125 | 65.11¢ per $1 |
| Gini / Inequality Index | 10,125 | 0.39 |
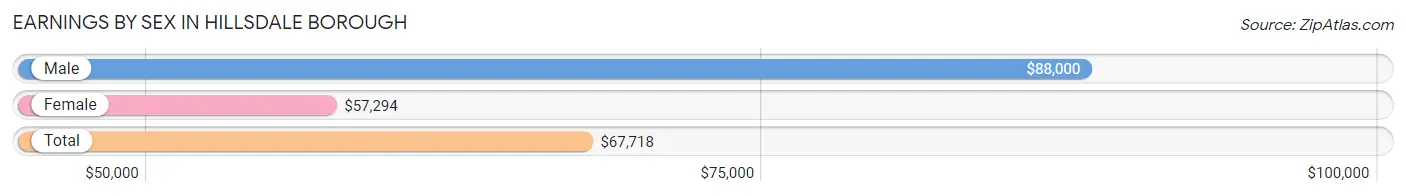
Earnings by Sex in Hillsdale borough
Average Earnings in Hillsdale borough are $67,718, $88,000 for men and $57,294 for women, a difference of 34.9%.
| Sex | Number | Average Earnings |
| Male | 3,112 (48.1%) | $88,000 |
| Female | 3,357 (51.9%) | $57,294 |
| Total | 6,469 (100.0%) | $67,718 |
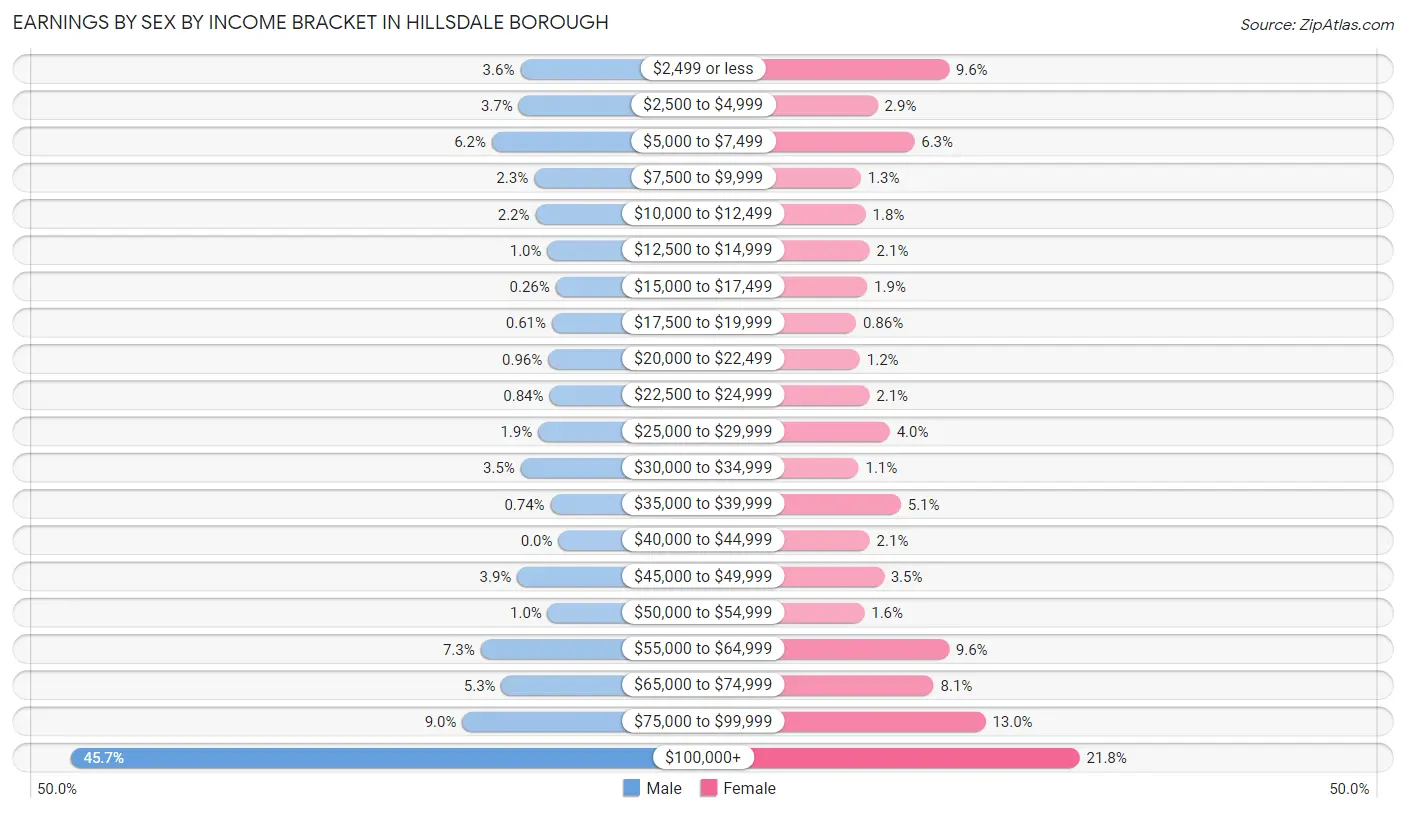
Earnings by Sex by Income Bracket in Hillsdale borough
The most common earnings brackets in Hillsdale borough are $100,000+ for men (1,422 | 45.7%) and $100,000+ for women (732 | 21.8%).
| Income | Male | Female |
| $2,499 or less | 111 (3.6%) | 321 (9.6%) |
| $2,500 to $4,999 | 116 (3.7%) | 97 (2.9%) |
| $5,000 to $7,499 | 194 (6.2%) | 212 (6.3%) |
| $7,500 to $9,999 | 71 (2.3%) | 44 (1.3%) |
| $10,000 to $12,499 | 67 (2.1%) | 59 (1.8%) |
| $12,500 to $14,999 | 32 (1.0%) | 72 (2.1%) |
| $15,000 to $17,499 | 8 (0.3%) | 64 (1.9%) |
| $17,500 to $19,999 | 19 (0.6%) | 29 (0.9%) |
| $20,000 to $22,499 | 30 (1.0%) | 41 (1.2%) |
| $22,500 to $24,999 | 26 (0.8%) | 71 (2.1%) |
| $25,000 to $29,999 | 59 (1.9%) | 135 (4.0%) |
| $30,000 to $34,999 | 110 (3.5%) | 37 (1.1%) |
| $35,000 to $39,999 | 23 (0.7%) | 170 (5.1%) |
| $40,000 to $44,999 | 0 (0.0%) | 72 (2.1%) |
| $45,000 to $49,999 | 120 (3.9%) | 116 (3.5%) |
| $50,000 to $54,999 | 31 (1.0%) | 55 (1.6%) |
| $55,000 to $64,999 | 227 (7.3%) | 321 (9.6%) |
| $65,000 to $74,999 | 166 (5.3%) | 273 (8.1%) |
| $75,000 to $99,999 | 280 (9.0%) | 436 (13.0%) |
| $100,000+ | 1,422 (45.7%) | 732 (21.8%) |
| Total | 3,112 (100.0%) | 3,357 (100.0%) |
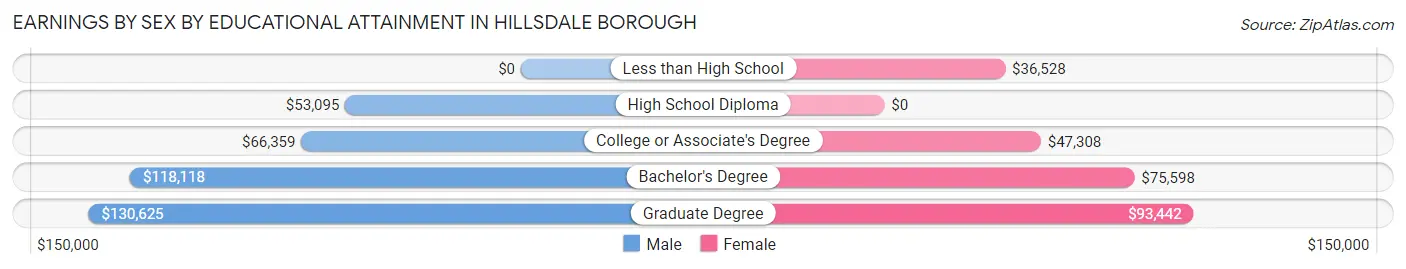
Earnings by Sex by Educational Attainment in Hillsdale borough
Average earnings in Hillsdale borough are $108,925 for men and $68,849 for women, a difference of 36.8%. Men with an educational attainment of graduate degree enjoy the highest average annual earnings of $130,625, while those with high school diploma education earn the least with $53,095. Women with an educational attainment of graduate degree earn the most with the average annual earnings of $93,442, while those with less than high school education have the smallest earnings of $36,528.
| Educational Attainment | Male Income | Female Income |
| Less than High School | - | - |
| High School Diploma | $53,095 | $0 |
| College or Associate's Degree | $66,359 | $47,308 |
| Bachelor's Degree | $118,118 | $75,598 |
| Graduate Degree | $130,625 | $93,442 |
| Total | $108,925 | $68,849 |
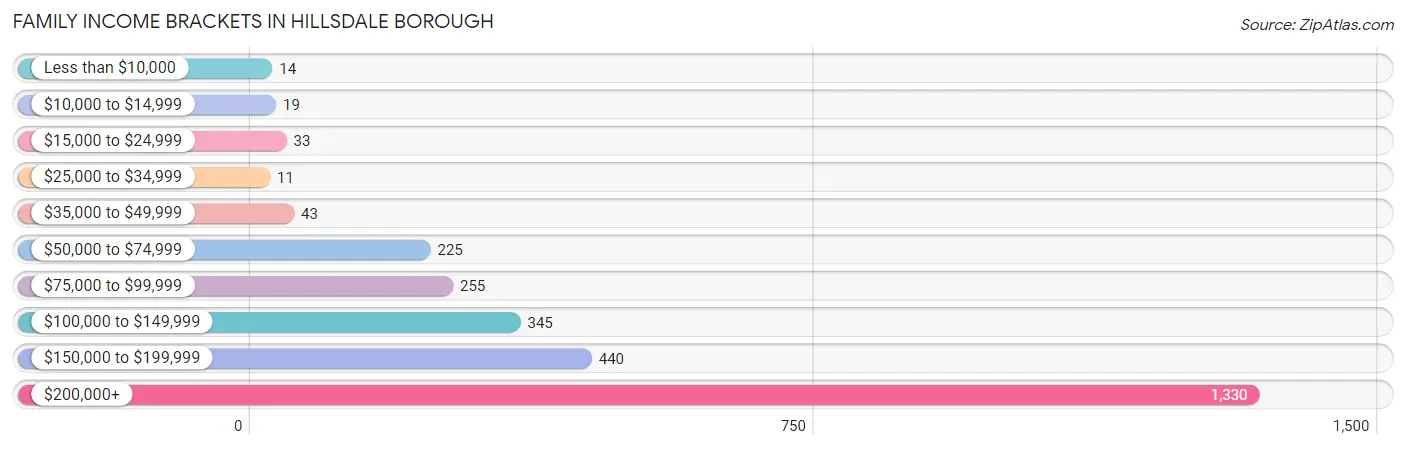
Family Income in Hillsdale borough
Family Income Brackets in Hillsdale borough
According to the Hillsdale borough family income data, there are 1,330 families falling into the $200,000+ income range, which is the most common income bracket and makes up 49.0% of all families. Conversely, the $25,000 to $34,999 income bracket is the least frequent group with only 11 families (0.4%) belonging to this category.
| Income Bracket | # Families | % Families |
| Less than $10,000 | 14 | 0.5% |
| $10,000 to $14,999 | 19 | 0.7% |
| $15,000 to $24,999 | 33 | 1.2% |
| $25,000 to $34,999 | 11 | 0.4% |
| $35,000 to $49,999 | 43 | 1.6% |
| $50,000 to $74,999 | 225 | 8.3% |
| $75,000 to $99,999 | 255 | 9.4% |
| $100,000 to $149,999 | 345 | 12.7% |
| $150,000 to $199,999 | 440 | 16.2% |
| $200,000+ | 1,330 | 49.0% |
Family Income by Famaliy Size in Hillsdale borough
4-person families (849 | 31.3%) account for the highest median family income in Hillsdale borough with $250,001 per family, while 3-person families (579 | 21.3%) have the highest median income of $66,488 per family member.
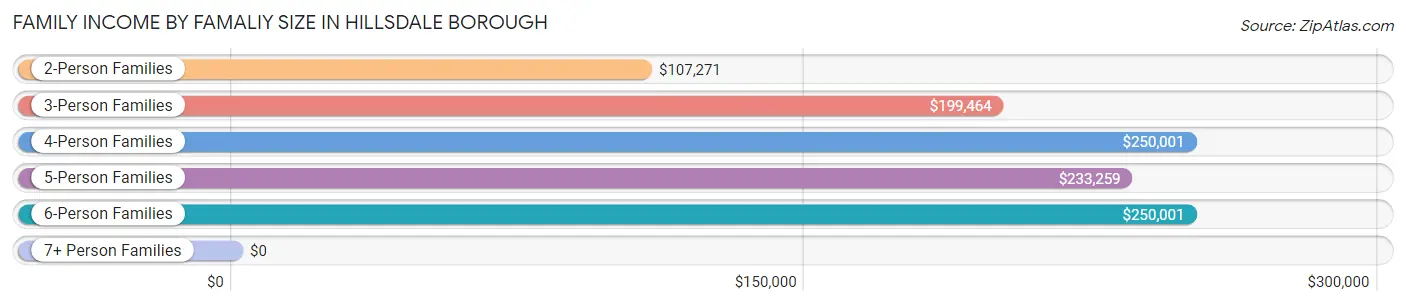
| Income Bracket | # Families | Median Income |
| 2-Person Families | 951 (35.0%) | $107,271 |
| 3-Person Families | 579 (21.3%) | $199,464 |
| 4-Person Families | 849 (31.3%) | $250,001 |
| 5-Person Families | 309 (11.4%) | $233,259 |
| 6-Person Families | 26 (1.0%) | $250,001 |
| 7+ Person Families | 0 (0.0%) | $0 |
| Total | 2,714 (100.0%) | $198,176 |
Family Income by Number of Earners in Hillsdale borough
The median family income in Hillsdale borough is $198,176, with families comprising 3+ earners (660) having the highest median family income of $214,314, while families with no earners (185) have the lowest median family income of $89,583, accounting for 24.3% and 6.8% of families, respectively.
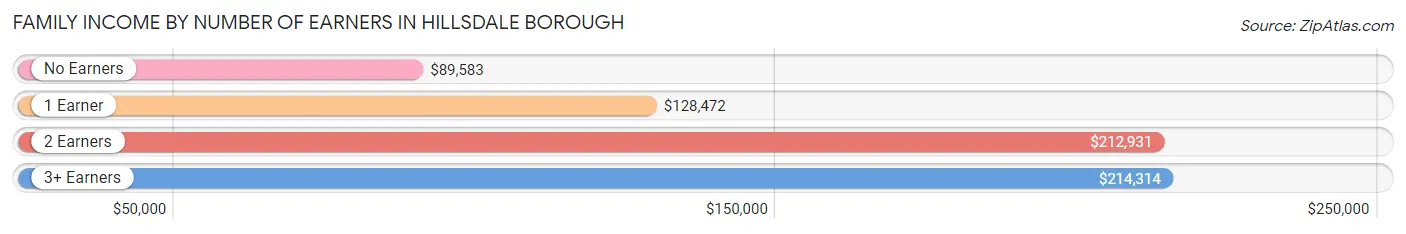
| Number of Earners | # Families | Median Income |
| No Earners | 185 (6.8%) | $89,583 |
| 1 Earner | 393 (14.5%) | $128,472 |
| 2 Earners | 1,476 (54.4%) | $212,931 |
| 3+ Earners | 660 (24.3%) | $214,314 |
| Total | 2,714 (100.0%) | $198,176 |
Household Income in Hillsdale borough
Household Income Brackets in Hillsdale borough
With 1,438 households falling in the category, the $200,000+ income range is the most frequent in Hillsdale borough, accounting for 42.1% of all households. In contrast, only 17 households (0.5%) fall into the $25,000 to $34,999 income bracket, making it the least populous group.
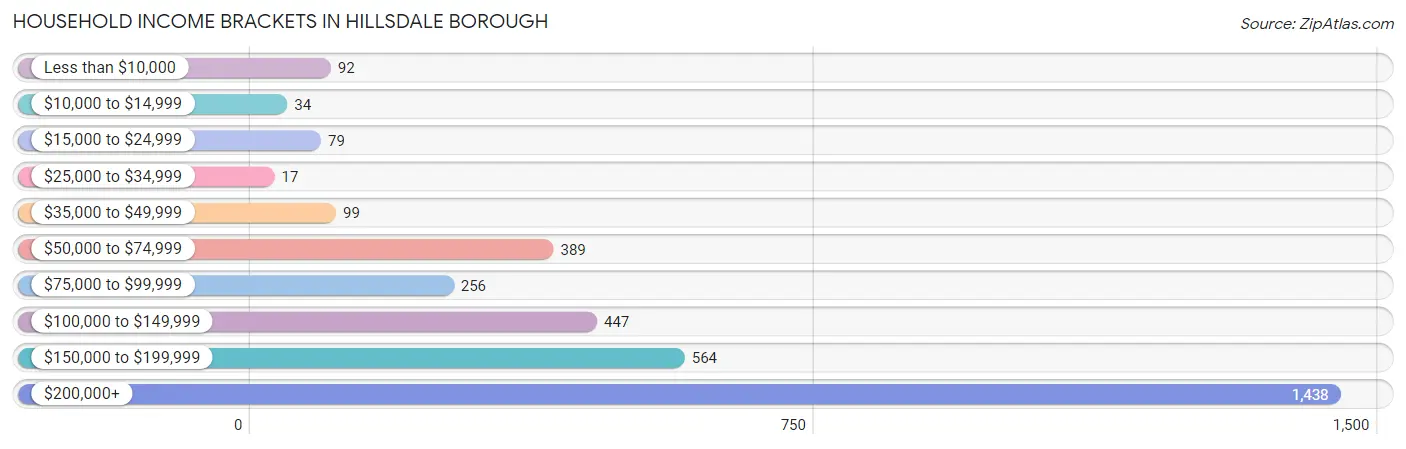
| Income Bracket | # Households | % Households |
| Less than $10,000 | 92 | 2.7% |
| $10,000 to $14,999 | 34 | 1.0% |
| $15,000 to $24,999 | 79 | 2.3% |
| $25,000 to $34,999 | 17 | 0.5% |
| $35,000 to $49,999 | 99 | 2.9% |
| $50,000 to $74,999 | 389 | 11.4% |
| $75,000 to $99,999 | 256 | 7.5% |
| $100,000 to $149,999 | 447 | 13.1% |
| $150,000 to $199,999 | 564 | 16.5% |
| $200,000+ | 1,438 | 42.1% |
Household Income by Householder Age in Hillsdale borough
The median household income in Hillsdale borough is $175,802, with the highest median household income of $214,363 found in the 25 to 44 years age bracket for the primary householder. A total of 920 households (26.9%) fall into this category.
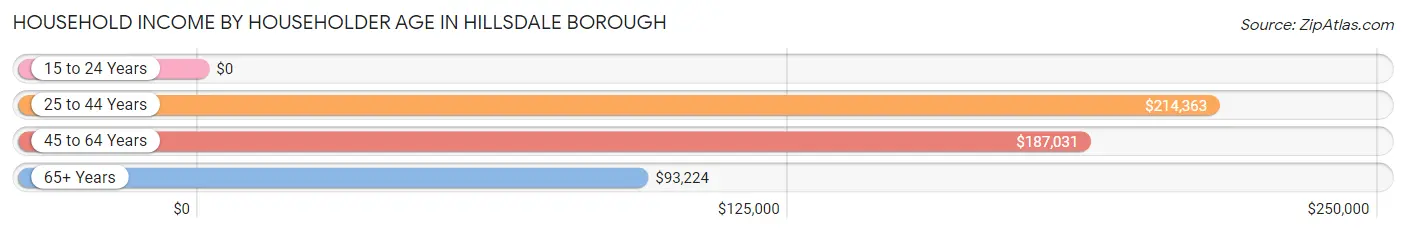
| Income Bracket | # Households | Median Income |
| 15 to 24 Years | 0 (0.0%) | $0 |
| 25 to 44 Years | 920 (26.9%) | $214,363 |
| 45 to 64 Years | 1,689 (49.4%) | $187,031 |
| 65+ Years | 807 (23.6%) | $93,224 |
| Total | 3,416 (100.0%) | $175,802 |
Poverty in Hillsdale borough
Income Below Poverty by Sex and Age in Hillsdale borough
With 3.4% poverty level for males and 2.8% for females among the residents of Hillsdale borough, 15 year old males and 65 to 74 year old females are the most vulnerable to poverty, with 24 males (28.2%) and 53 females (15.3%) in their respective age groups living below the poverty level.
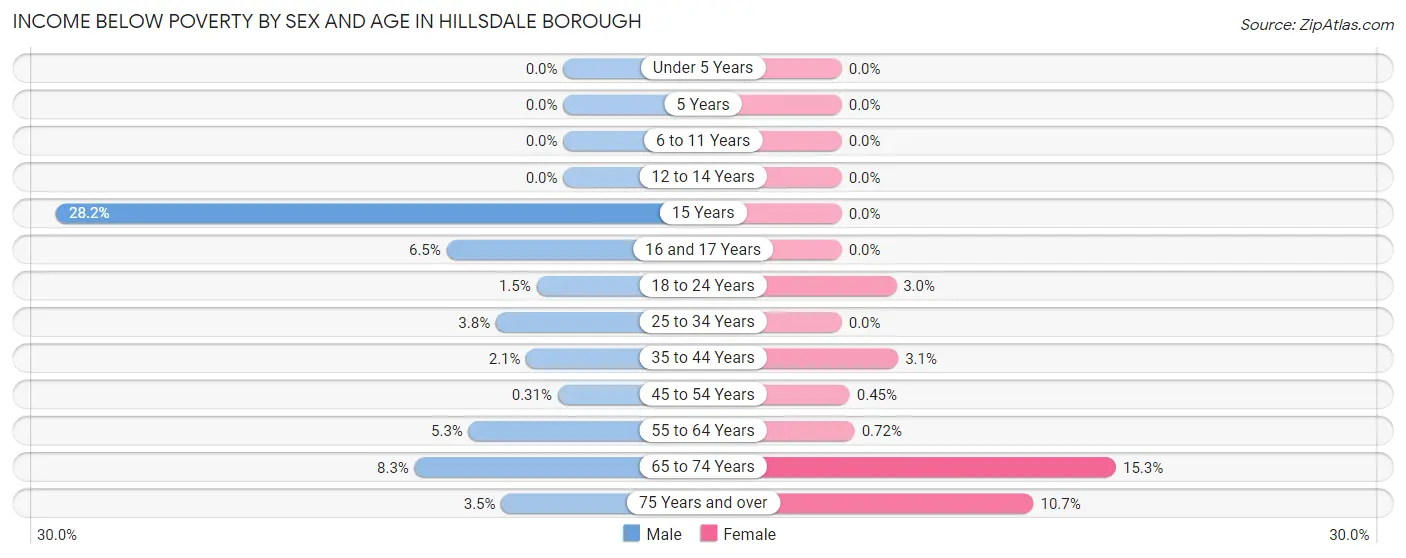
| Age Bracket | Male | Female |
| Under 5 Years | 0 (0.0%) | 0 (0.0%) |
| 5 Years | 0 (0.0%) | 0 (0.0%) |
| 6 to 11 Years | 0 (0.0%) | 0 (0.0%) |
| 12 to 14 Years | 0 (0.0%) | 0 (0.0%) |
| 15 Years | 24 (28.2%) | 0 (0.0%) |
| 16 and 17 Years | 8 (6.5%) | 0 (0.0%) |
| 18 to 24 Years | 7 (1.5%) | 21 (3.0%) |
| 25 to 34 Years | 14 (3.7%) | 0 (0.0%) |
| 35 to 44 Years | 14 (2.1%) | 22 (3.1%) |
| 45 to 54 Years | 2 (0.3%) | 3 (0.4%) |
| 55 to 64 Years | 42 (5.3%) | 7 (0.7%) |
| 65 to 74 Years | 37 (8.3%) | 53 (15.3%) |
| 75 Years and over | 8 (3.5%) | 49 (10.7%) |
| Total | 156 (3.4%) | 155 (2.8%) |
Income Above Poverty by Sex and Age in Hillsdale borough
According to the poverty statistics in Hillsdale borough, males aged under 5 years and females aged under 5 years are the age groups that are most secure financially, with 100.0% of males and 100.0% of females in these age groups living above the poverty line.
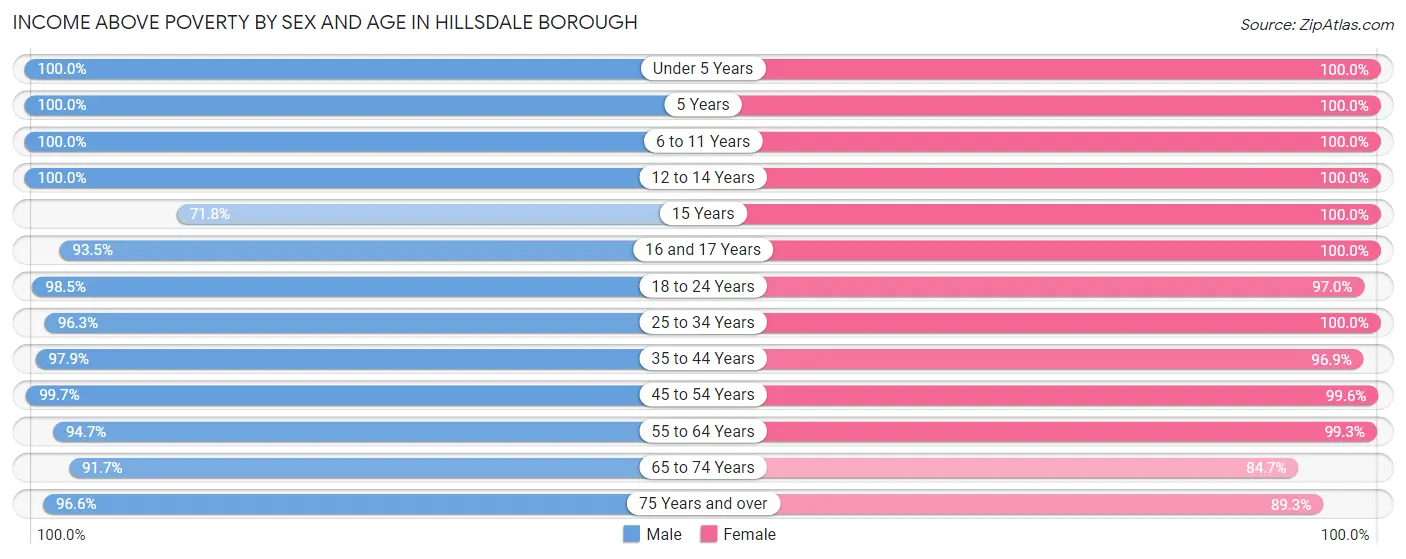
| Age Bracket | Male | Female |
| Under 5 Years | 225 (100.0%) | 293 (100.0%) |
| 5 Years | 51 (100.0%) | 82 (100.0%) |
| 6 to 11 Years | 308 (100.0%) | 332 (100.0%) |
| 12 to 14 Years | 196 (100.0%) | 142 (100.0%) |
| 15 Years | 61 (71.8%) | 32 (100.0%) |
| 16 and 17 Years | 115 (93.5%) | 197 (100.0%) |
| 18 to 24 Years | 463 (98.5%) | 672 (97.0%) |
| 25 to 34 Years | 359 (96.3%) | 535 (100.0%) |
| 35 to 44 Years | 665 (97.9%) | 679 (96.9%) |
| 45 to 54 Years | 640 (99.7%) | 666 (99.6%) |
| 55 to 64 Years | 755 (94.7%) | 964 (99.3%) |
| 65 to 74 Years | 410 (91.7%) | 294 (84.7%) |
| 75 Years and over | 224 (96.6%) | 410 (89.3%) |
| Total | 4,472 (96.6%) | 5,298 (97.2%) |
Income Below Poverty Among Married-Couple Families in Hillsdale borough
The poverty statistics for married-couple families in Hillsdale borough show that 1.7% or 40 of the total 2,303 families live below the poverty line. Families with no children have the highest poverty rate of 3.1%, comprising of 40 families. On the other hand, families with 1 or 2 children have the lowest poverty rate of 0.0%, which includes 0 families.
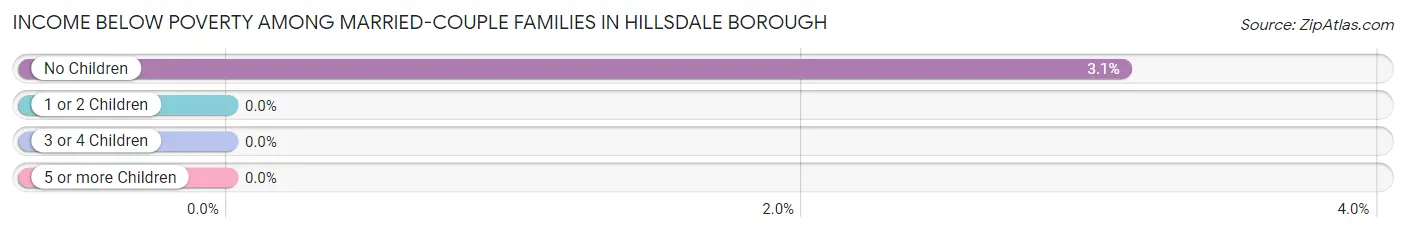
| Children | Above Poverty | Below Poverty |
| No Children | 1,245 (96.9%) | 40 (3.1%) |
| 1 or 2 Children | 865 (100.0%) | 0 (0.0%) |
| 3 or 4 Children | 153 (100.0%) | 0 (0.0%) |
| 5 or more Children | 0 (0.0%) | 0 (0.0%) |
| Total | 2,263 (98.3%) | 40 (1.7%) |
Income Below Poverty Among Single-Parent Households in Hillsdale borough
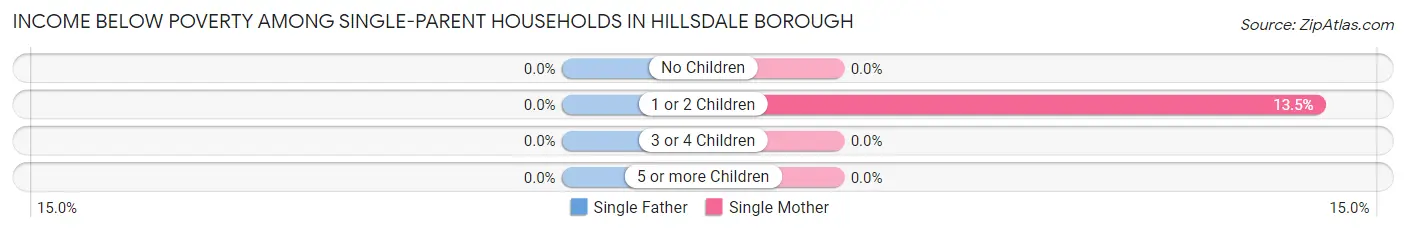
| Children | Single Father | Single Mother |
| No Children | 0 (0.0%) | 0 (0.0%) |
| 1 or 2 Children | 0 (0.0%) | 7 (13.5%) |
| 3 or 4 Children | 0 (0.0%) | 0 (0.0%) |
| 5 or more Children | 0 (0.0%) | 0 (0.0%) |
| Total | 0 (0.0%) | 7 (2.7%) |
Income Below Poverty Among Married-Couple vs Single-Parent Households in Hillsdale borough
The poverty data for Hillsdale borough shows that 40 of the married-couple family households (1.7%) and 7 of the single-parent households (1.7%) are living below the poverty level. Within the married-couple family households, those with no children have the highest poverty rate, with 40 households (3.1%) falling below the poverty line. Among the single-parent households, those with 1 or 2 children have the highest poverty rate, with 7 household (6.1%) living below poverty.
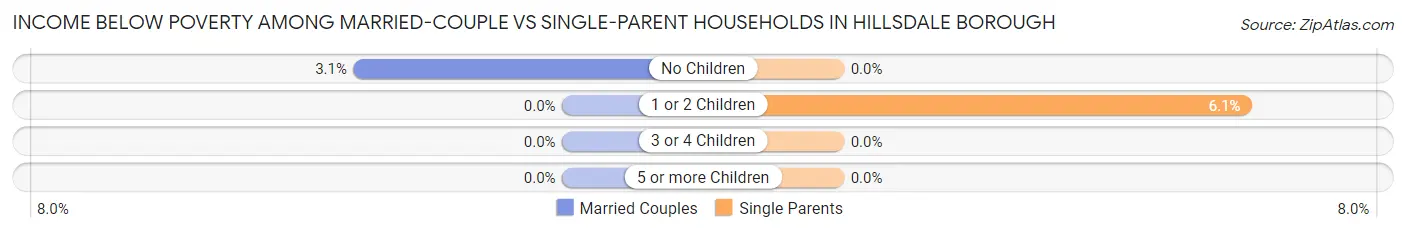
| Children | Married-Couple Families | Single-Parent Households |
| No Children | 40 (3.1%) | 0 (0.0%) |
| 1 or 2 Children | 0 (0.0%) | 7 (6.1%) |
| 3 or 4 Children | 0 (0.0%) | 0 (0.0%) |
| 5 or more Children | 0 (0.0%) | 0 (0.0%) |
| Total | 40 (1.7%) | 7 (1.7%) |
Race in Hillsdale borough
The most populous races in Hillsdale borough are White / Caucasian (8,204 | 81.0%), Hispanic or Latino (881 | 8.7%), and Two or more Races (746 | 7.4%).
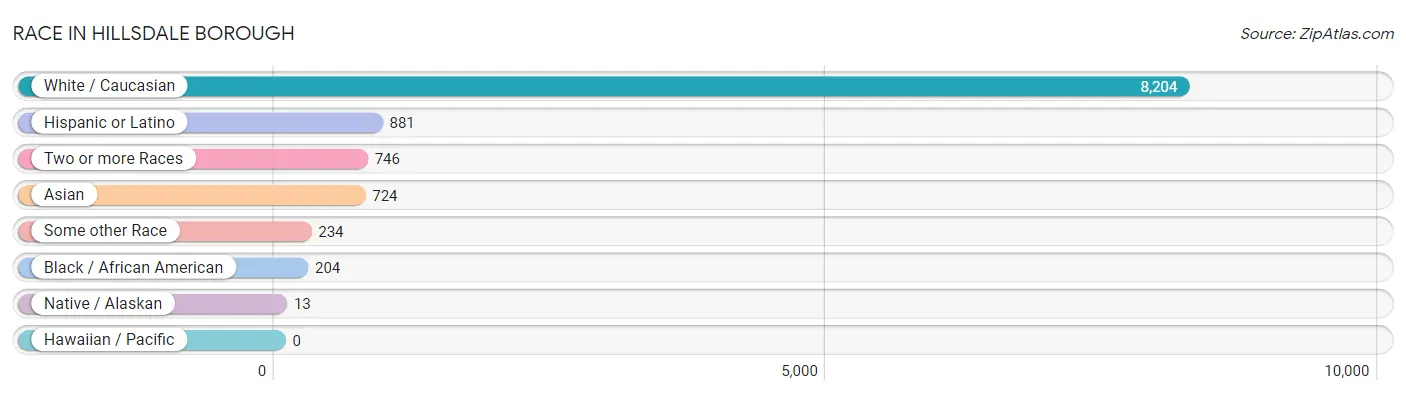
| Race | # Population | % Population |
| Asian | 724 | 7.1% |
| Black / African American | 204 | 2.0% |
| Hawaiian / Pacific | 0 | 0.0% |
| Hispanic or Latino | 881 | 8.7% |
| Native / Alaskan | 13 | 0.1% |
| White / Caucasian | 8,204 | 81.0% |
| Two or more Races | 746 | 7.4% |
| Some other Race | 234 | 2.3% |
| Total | 10,125 | 100.0% |
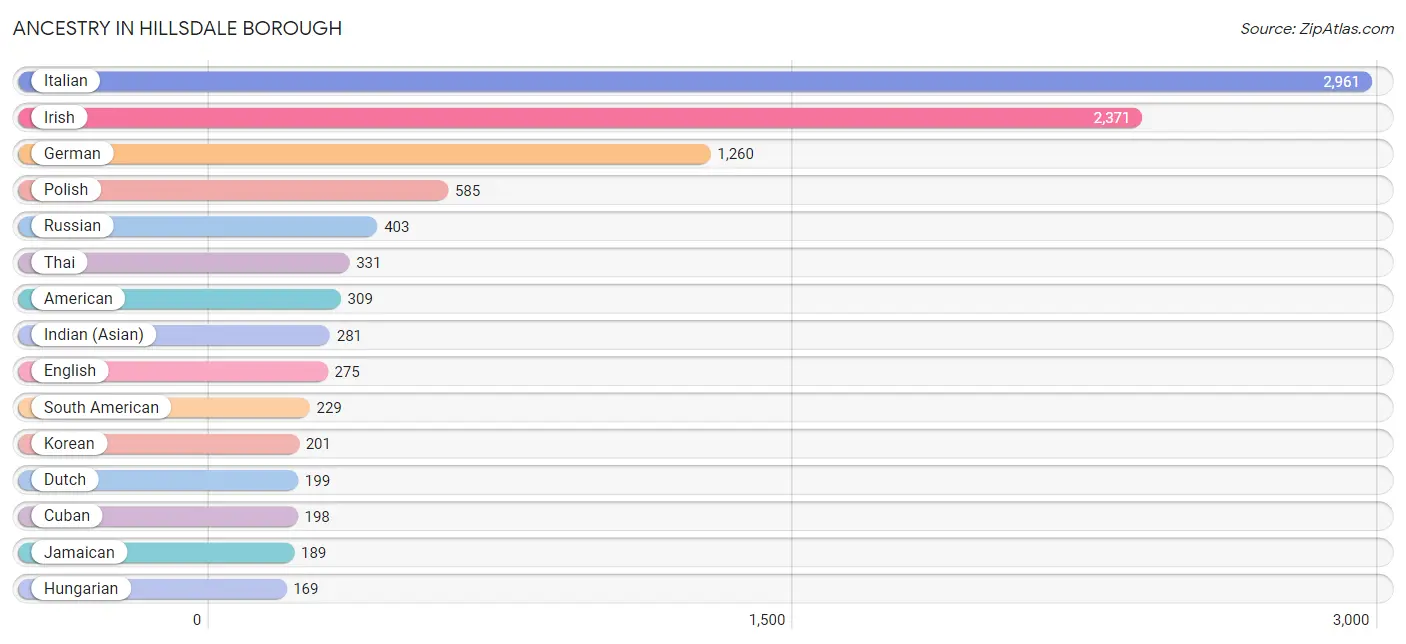
Ancestry in Hillsdale borough
The most populous ancestries reported in Hillsdale borough are Italian (2,961 | 29.2%), Irish (2,371 | 23.4%), German (1,260 | 12.4%), Polish (585 | 5.8%), and Russian (403 | 4.0%), together accounting for 74.9% of all Hillsdale borough residents.
| Ancestry | # Population | % Population |
| African | 8 | 0.1% |
| American | 309 | 3.0% |
| Arab | 65 | 0.6% |
| Argentinean | 16 | 0.2% |
| Armenian | 117 | 1.2% |
| Austrian | 117 | 1.2% |
| Bhutanese | 47 | 0.5% |
| Brazilian | 78 | 0.8% |
| British | 93 | 0.9% |
| Burmese | 78 | 0.8% |
| Canadian | 28 | 0.3% |
| Central American | 97 | 1.0% |
| Chilean | 37 | 0.4% |
| Croatian | 46 | 0.4% |
| Cuban | 198 | 2.0% |
| Czech | 55 | 0.5% |
| Czechoslovakian | 7 | 0.1% |
| Danish | 10 | 0.1% |
| Dominican | 81 | 0.8% |
| Dutch | 199 | 2.0% |
| Eastern European | 115 | 1.1% |
| Ecuadorian | 12 | 0.1% |
| English | 275 | 2.7% |
| European | 166 | 1.6% |
| French | 149 | 1.5% |
| French Canadian | 7 | 0.1% |
| German | 1,260 | 12.4% |
| Greek | 126 | 1.2% |
| Guatemalan | 97 | 1.0% |
| Haitian | 110 | 1.1% |
| Hungarian | 169 | 1.7% |
| Indian (Asian) | 281 | 2.8% |
| Iranian | 13 | 0.1% |
| Iraqi | 15 | 0.2% |
| Irish | 2,371 | 23.4% |
| Italian | 2,961 | 29.2% |
| Jamaican | 189 | 1.9% |
| Korean | 201 | 2.0% |
| Laotian | 10 | 0.1% |
| Lebanese | 10 | 0.1% |
| Lithuanian | 112 | 1.1% |
| Macedonian | 18 | 0.2% |
| Mexican | 64 | 0.6% |
| Norwegian | 23 | 0.2% |
| Peruvian | 164 | 1.6% |
| Polish | 585 | 5.8% |
| Portuguese | 24 | 0.2% |
| Puerto Rican | 113 | 1.1% |
| Romanian | 22 | 0.2% |
| Russian | 403 | 4.0% |
| Scandinavian | 84 | 0.8% |
| Scotch-Irish | 14 | 0.1% |
| Scottish | 104 | 1.0% |
| Serbian | 168 | 1.7% |
| Slovak | 37 | 0.4% |
| South American | 229 | 2.3% |
| Spaniard | 5 | 0.1% |
| Spanish | 82 | 0.8% |
| Sri Lankan | 14 | 0.1% |
| Subsaharan African | 8 | 0.1% |
| Swedish | 90 | 0.9% |
| Swiss | 22 | 0.2% |
| Syrian | 30 | 0.3% |
| Thai | 331 | 3.3% |
| Ukrainian | 102 | 1.0% |
| Welsh | 66 | 0.6% | View All 66 Rows |
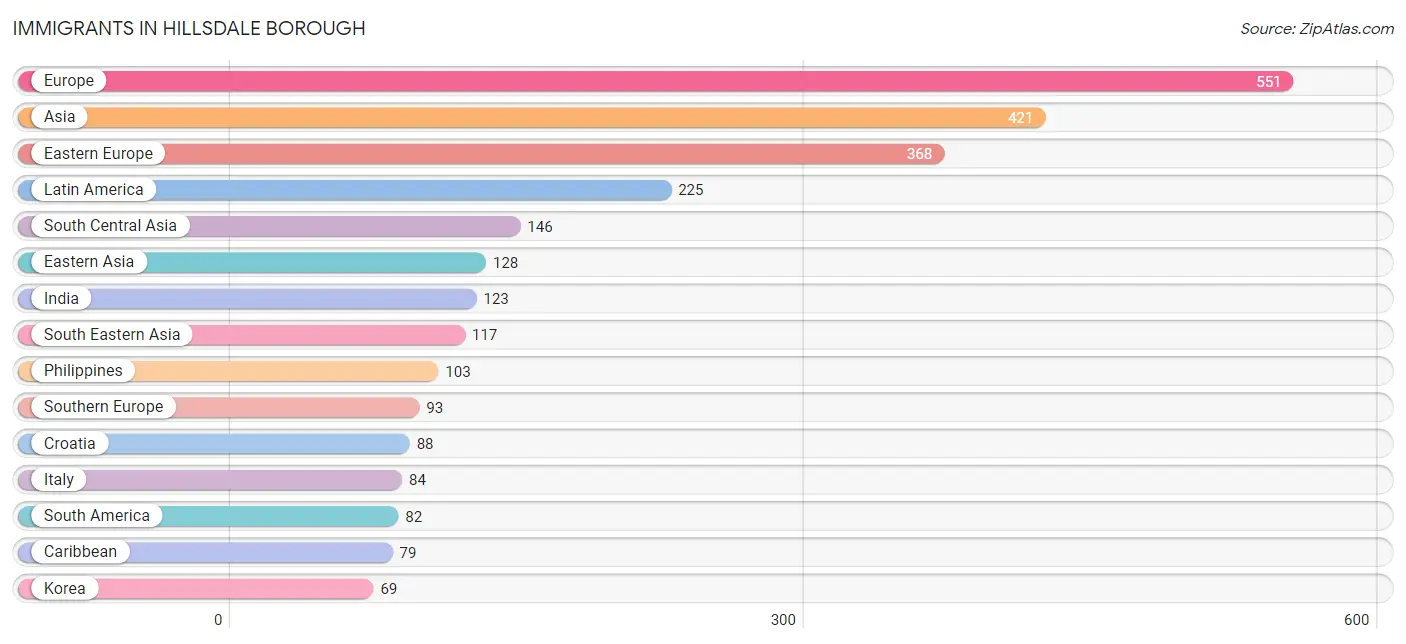
Immigrants in Hillsdale borough
The most numerous immigrant groups reported in Hillsdale borough came from Europe (551 | 5.4%), Asia (421 | 4.2%), Eastern Europe (368 | 3.6%), Latin America (225 | 2.2%), and South Central Asia (146 | 1.4%), together accounting for 16.9% of all Hillsdale borough residents.
| Immigration Origin | # Population | % Population |
| Africa | 68 | 0.7% |
| Albania | 9 | 0.1% |
| Argentina | 7 | 0.1% |
| Asia | 421 | 4.2% |
| Belarus | 39 | 0.4% |
| Brazil | 37 | 0.4% |
| Caribbean | 79 | 0.8% |
| Central America | 64 | 0.6% |
| Chile | 13 | 0.1% |
| China | 48 | 0.5% |
| Croatia | 88 | 0.9% |
| Cuba | 34 | 0.3% |
| Czechoslovakia | 7 | 0.1% |
| Eastern Africa | 24 | 0.2% |
| Eastern Asia | 128 | 1.3% |
| Eastern Europe | 368 | 3.6% |
| Ecuador | 15 | 0.2% |
| Egypt | 44 | 0.4% |
| England | 24 | 0.2% |
| Europe | 551 | 5.4% |
| France | 20 | 0.2% |
| Germany | 7 | 0.1% |
| Hong Kong | 23 | 0.2% |
| Hungary | 42 | 0.4% |
| India | 123 | 1.2% |
| Ireland | 7 | 0.1% |
| Italy | 84 | 0.8% |
| Jamaica | 45 | 0.4% |
| Japan | 11 | 0.1% |
| Kenya | 18 | 0.2% |
| Korea | 69 | 0.7% |
| Latin America | 225 | 2.2% |
| Lebanon | 30 | 0.3% |
| Lithuania | 10 | 0.1% |
| Mexico | 64 | 0.6% |
| Moldova | 9 | 0.1% |
| North Macedonia | 8 | 0.1% |
| Northern Africa | 44 | 0.4% |
| Northern Europe | 63 | 0.6% |
| Pakistan | 23 | 0.2% |
| Peru | 10 | 0.1% |
| Philippines | 103 | 1.0% |
| Poland | 7 | 0.1% |
| Portugal | 9 | 0.1% |
| Romania | 15 | 0.2% |
| Russia | 52 | 0.5% |
| Serbia | 51 | 0.5% |
| South America | 82 | 0.8% |
| South Central Asia | 146 | 1.4% |
| South Eastern Asia | 117 | 1.2% |
| Southern Europe | 93 | 0.9% |
| Ukraine | 22 | 0.2% |
| Vietnam | 14 | 0.1% |
| Western Asia | 30 | 0.3% |
| Western Europe | 27 | 0.3% | View All 55 Rows |
Sex and Age in Hillsdale borough
Sex and Age in Hillsdale borough
The most populous age groups in Hillsdale borough are 55 to 59 Years (450 | 9.7%) for men and 55 to 59 Years (601 | 11.0%) for women.
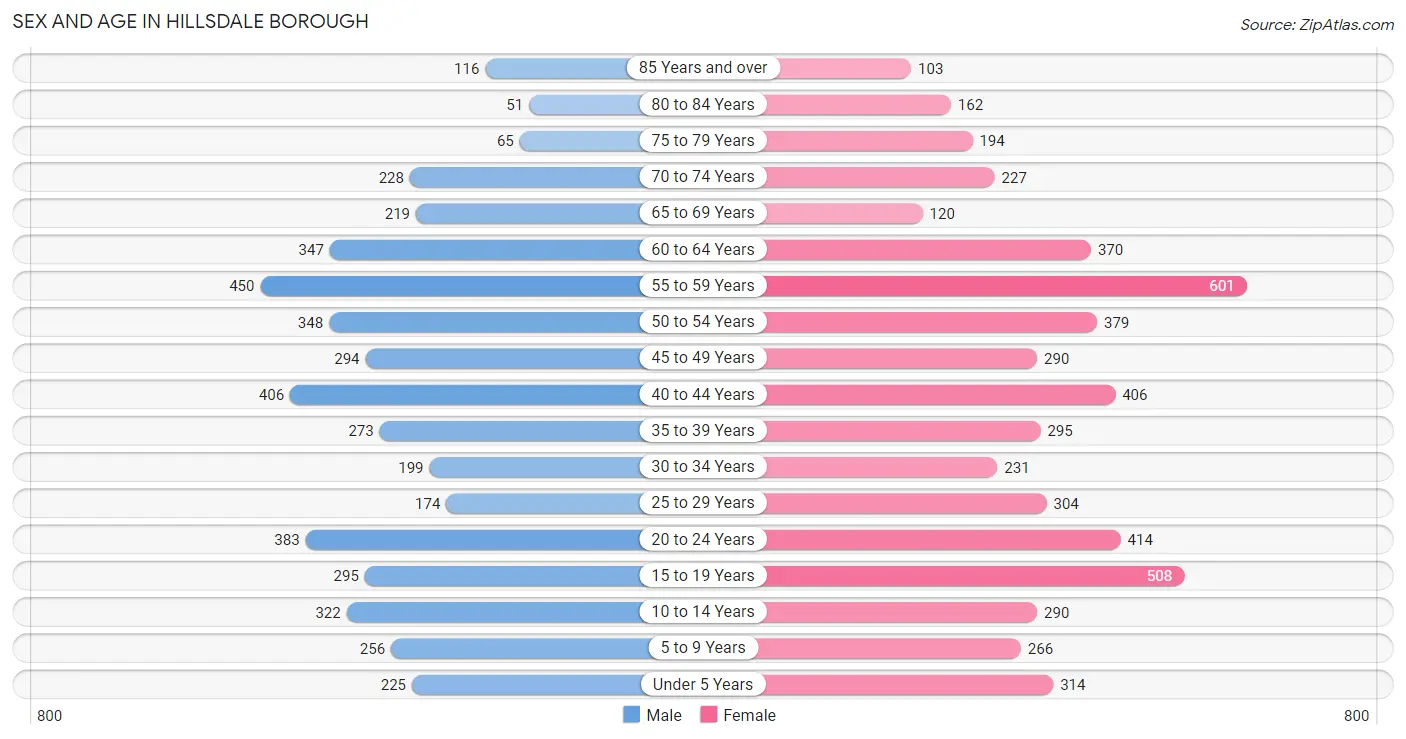
| Age Bracket | Male | Female |
| Under 5 Years | 225 (4.8%) | 314 (5.7%) |
| 5 to 9 Years | 256 (5.5%) | 266 (4.9%) |
| 10 to 14 Years | 322 (6.9%) | 290 (5.3%) |
| 15 to 19 Years | 295 (6.3%) | 508 (9.3%) |
| 20 to 24 Years | 383 (8.2%) | 414 (7.6%) |
| 25 to 29 Years | 174 (3.7%) | 304 (5.6%) |
| 30 to 34 Years | 199 (4.3%) | 231 (4.2%) |
| 35 to 39 Years | 273 (5.9%) | 295 (5.4%) |
| 40 to 44 Years | 406 (8.7%) | 406 (7.4%) |
| 45 to 49 Years | 294 (6.3%) | 290 (5.3%) |
| 50 to 54 Years | 348 (7.5%) | 379 (6.9%) |
| 55 to 59 Years | 450 (9.7%) | 601 (11.0%) |
| 60 to 64 Years | 347 (7.5%) | 370 (6.8%) |
| 65 to 69 Years | 219 (4.7%) | 120 (2.2%) |
| 70 to 74 Years | 228 (4.9%) | 227 (4.2%) |
| 75 to 79 Years | 65 (1.4%) | 194 (3.5%) |
| 80 to 84 Years | 51 (1.1%) | 162 (3.0%) |
| 85 Years and over | 116 (2.5%) | 103 (1.9%) |
| Total | 4,651 (100.0%) | 5,474 (100.0%) |
Families and Households in Hillsdale borough
Median Family Size in Hillsdale borough
The median family size in Hillsdale borough is 3.31 persons per family, with married-couple families (2,303 | 84.9%) accounting for the largest median family size of 3.41 persons per family. On the other hand, single male/father families (153 | 5.6%) represent the smallest median family size with 2.30 persons per family.
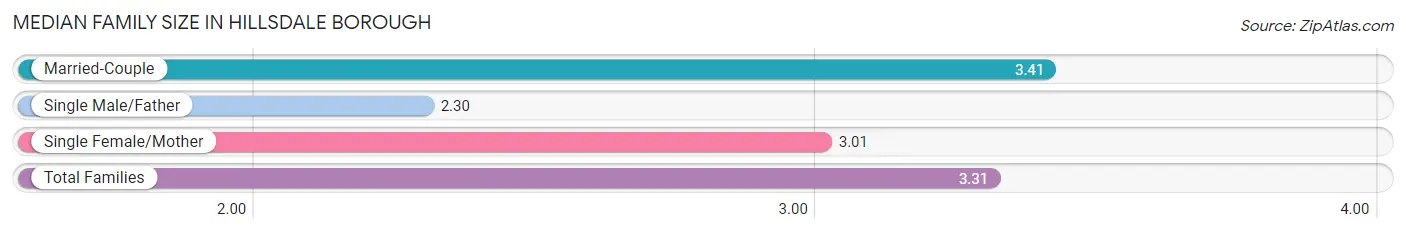
| Family Type | # Families | Family Size |
| Married-Couple | 2,303 (84.9%) | 3.41 |
| Single Male/Father | 153 (5.6%) | 2.30 |
| Single Female/Mother | 258 (9.5%) | 3.01 |
| Total Families | 2,714 (100.0%) | 3.31 |
Median Household Size in Hillsdale borough
The median household size in Hillsdale borough is 2.95 persons per household, with married-couple households (2,303 | 67.4%) accounting for the largest median household size of 3.43 persons per household. non-family households (702 | 20.5%) represent the smallest median household size with 1.35 persons per household.
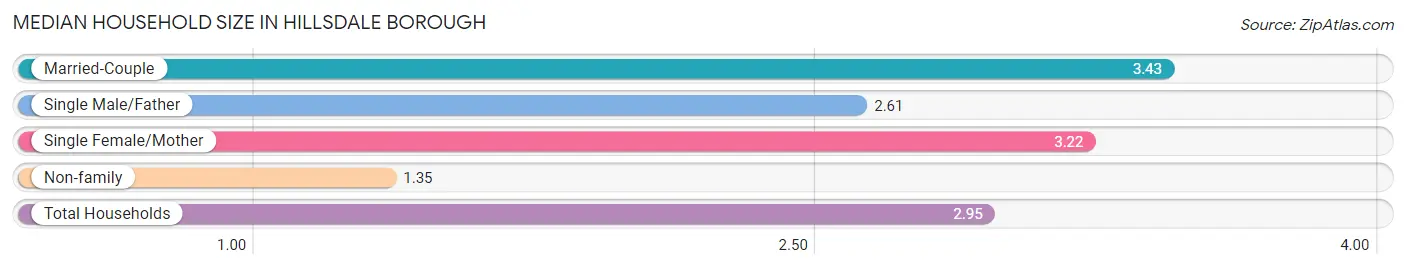
| Household Type | # Households | Household Size |
| Married-Couple | 2,303 (67.4%) | 3.43 |
| Single Male/Father | 153 (4.5%) | 2.61 |
| Single Female/Mother | 258 (7.5%) | 3.22 |
| Non-family | 702 (20.5%) | 1.35 |
| Total Households | 3,416 (100.0%) | 2.95 |
Household Size by Marriage Status in Hillsdale borough
Out of a total of 3,416 households in Hillsdale borough, 2,714 (79.4%) are family households, while 702 (20.5%) are nonfamily households. The most numerous type of family households are 2-person households, comprising 868, and the most common type of nonfamily households are 1-person households, comprising 527.
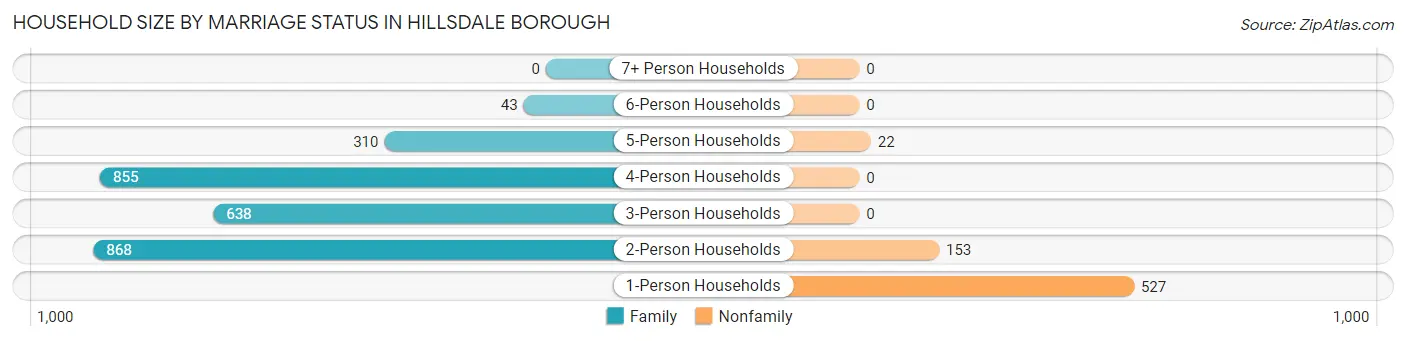
| Household Size | Family Households | Nonfamily Households |
| 1-Person Households | - | 527 (15.4%) |
| 2-Person Households | 868 (25.4%) | 153 (4.5%) |
| 3-Person Households | 638 (18.7%) | 0 (0.0%) |
| 4-Person Households | 855 (25.0%) | 0 (0.0%) |
| 5-Person Households | 310 (9.1%) | 22 (0.6%) |
| 6-Person Households | 43 (1.3%) | 0 (0.0%) |
| 7+ Person Households | 0 (0.0%) | 0 (0.0%) |
| Total | 2,714 (79.4%) | 702 (20.5%) |
Female Fertility in Hillsdale borough
Fertility by Age in Hillsdale borough
Average fertility rate in Hillsdale borough is 38.0 births per 1,000 women. Women in the age bracket of 35 to 50 years have the highest fertility rate with 58.0 births per 1,000 women. Women in the age bracket of 35 to 50 years acount for 65.6% of all women with births.
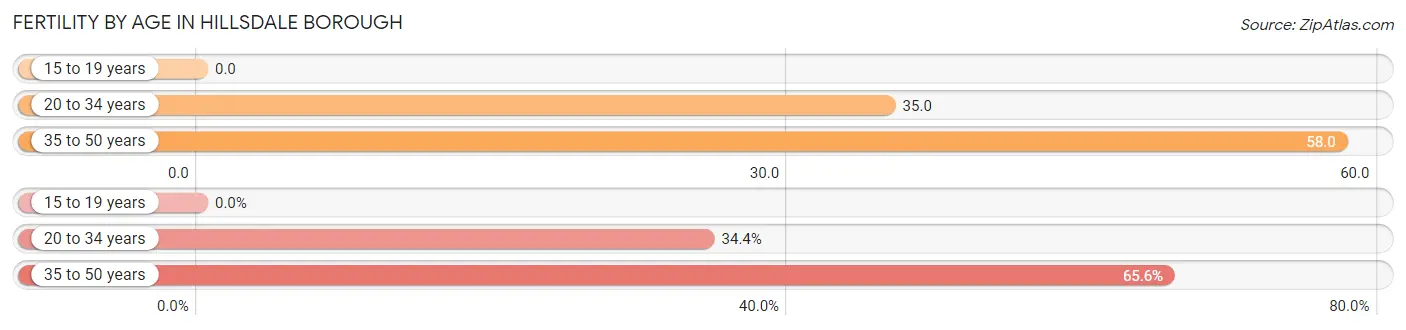
| Age Bracket | Women with Births | Births / 1,000 Women |
| 15 to 19 years | 0 (0.0%) | 0.0 |
| 20 to 34 years | 33 (34.4%) | 35.0 |
| 35 to 50 years | 63 (65.6%) | 58.0 |
| Total | 96 (100.0%) | 38.0 |
Fertility by Age by Marriage Status in Hillsdale borough
88.5% of women with births (96) in Hillsdale borough are married. The highest percentage of unmarried women with births falls into 35 to 50 years age bracket with 17.5% of them unmarried at the time of birth, while the lowest percentage of unmarried women with births belong to 20 to 34 years age bracket with 0.0% of them unmarried.
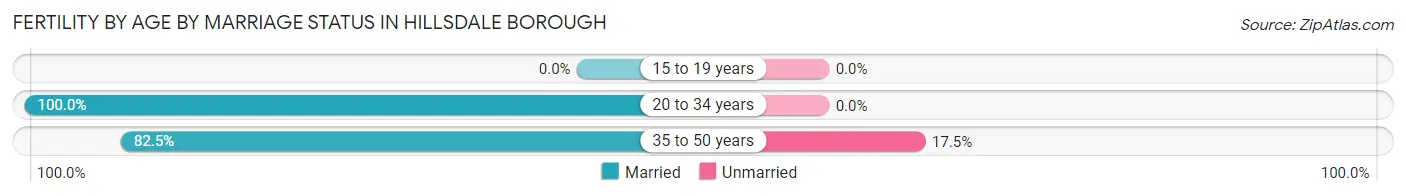
| Age Bracket | Married | Unmarried |
| 15 to 19 years | 0 (0.0%) | 0 (0.0%) |
| 20 to 34 years | 33 (100.0%) | 0 (0.0%) |
| 35 to 50 years | 52 (82.5%) | 11 (17.5%) |
| Total | 85 (88.5%) | 11 (11.5%) |
Fertility by Education in Hillsdale borough
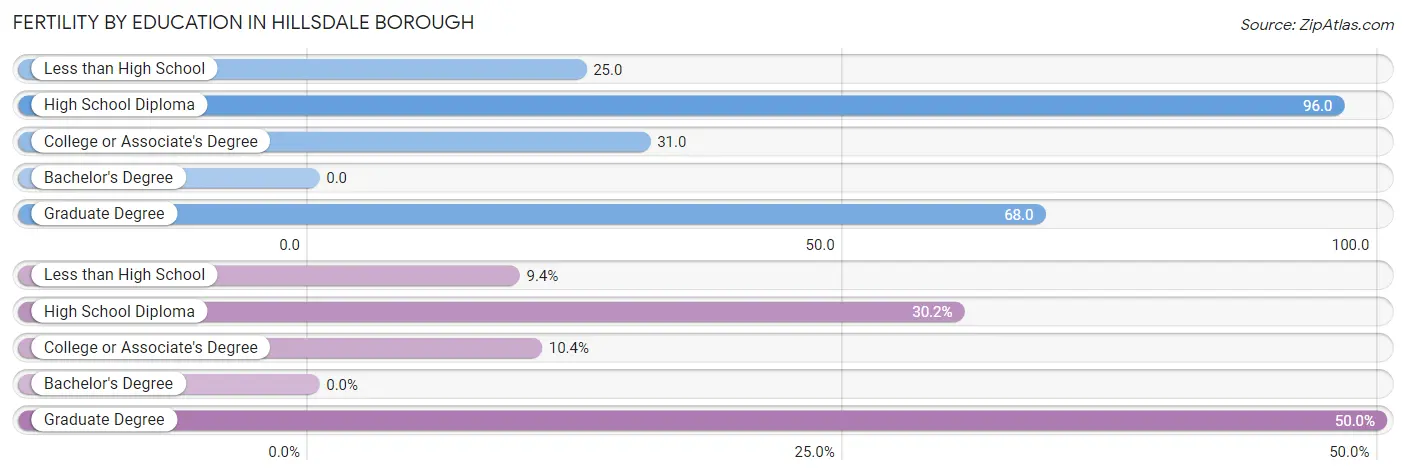
| Educational Attainment | Women with Births | Births / 1,000 Women |
| Less than High School | 9 (9.4%) | 25.0 |
| High School Diploma | 29 (30.2%) | 96.0 |
| College or Associate's Degree | 10 (10.4%) | 31.0 |
| Bachelor's Degree | 0 (0.0%) | 0.0 |
| Graduate Degree | 48 (50.0%) | 68.0 |
| Total | 96 (100.0%) | 38.0 |
Fertility by Education by Marriage Status in Hillsdale borough
11.5% of women with births in Hillsdale borough are unmarried. Women with the educational attainment of less than high school are most likely to be married with 100.0% of them married at childbirth, while women with the educational attainment of high school diploma are least likely to be married with 37.9% of them unmarried at childbirth.
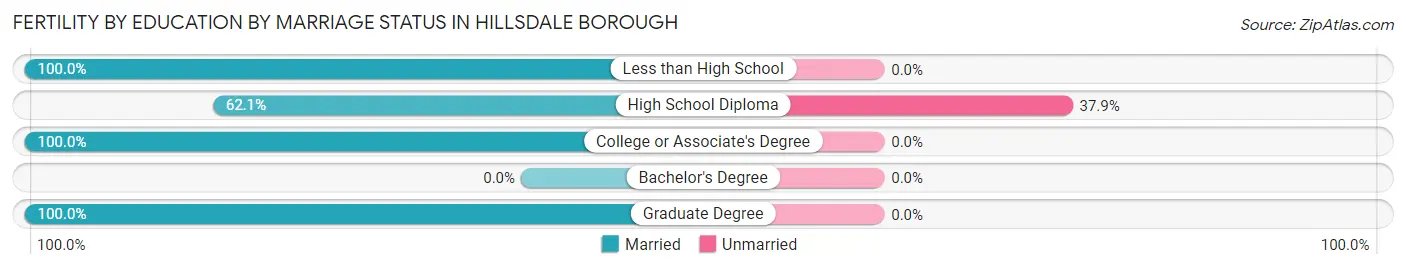
| Educational Attainment | Married | Unmarried |
| Less than High School | 9 (100.0%) | 0 (0.0%) |
| High School Diploma | 18 (62.1%) | 11 (37.9%) |
| College or Associate's Degree | 10 (100.0%) | 0 (0.0%) |
| Bachelor's Degree | 0 (0.0%) | 0 (0.0%) |
| Graduate Degree | 48 (100.0%) | 0 (0.0%) |
| Total | 85 (88.5%) | 11 (11.5%) |
Employment Characteristics in Hillsdale borough
Employment by Class of Employer in Hillsdale borough
Among the 5,627 employed individuals in Hillsdale borough, private company employees (3,801 | 67.5%), local government employees (748 | 13.3%), and not-for-profit organizations (410 | 7.3%) make up the most common classes of employment.
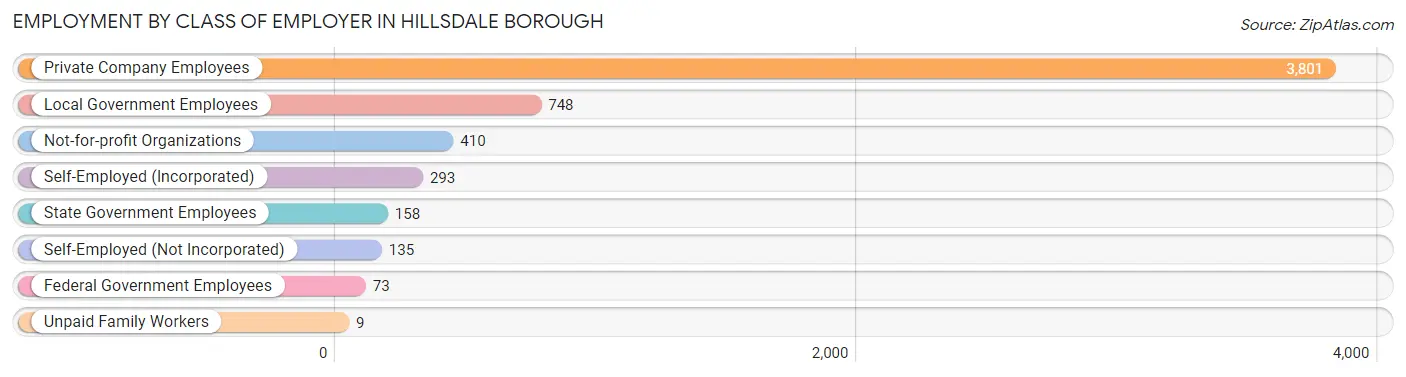
| Employer Class | # Employees | % Employees |
| Private Company Employees | 3,801 | 67.5% |
| Self-Employed (Incorporated) | 293 | 5.2% |
| Self-Employed (Not Incorporated) | 135 | 2.4% |
| Not-for-profit Organizations | 410 | 7.3% |
| Local Government Employees | 748 | 13.3% |
| State Government Employees | 158 | 2.8% |
| Federal Government Employees | 73 | 1.3% |
| Unpaid Family Workers | 9 | 0.2% |
| Total | 5,627 | 100.0% |
Employment Status by Age in Hillsdale borough
According to the labor force statistics for Hillsdale borough, out of the total population over 16 years of age (8,335), 71.9% or 5,993 individuals are in the labor force, with 2.9% or 174 of them unemployed. The age group with the highest labor force participation rate is 30 to 34 years, with 94.9% or 408 individuals in the labor force. Within the labor force, the 20 to 24 years age range has the highest percentage of unemployed individuals, with 9.4% or 55 of them being unemployed.
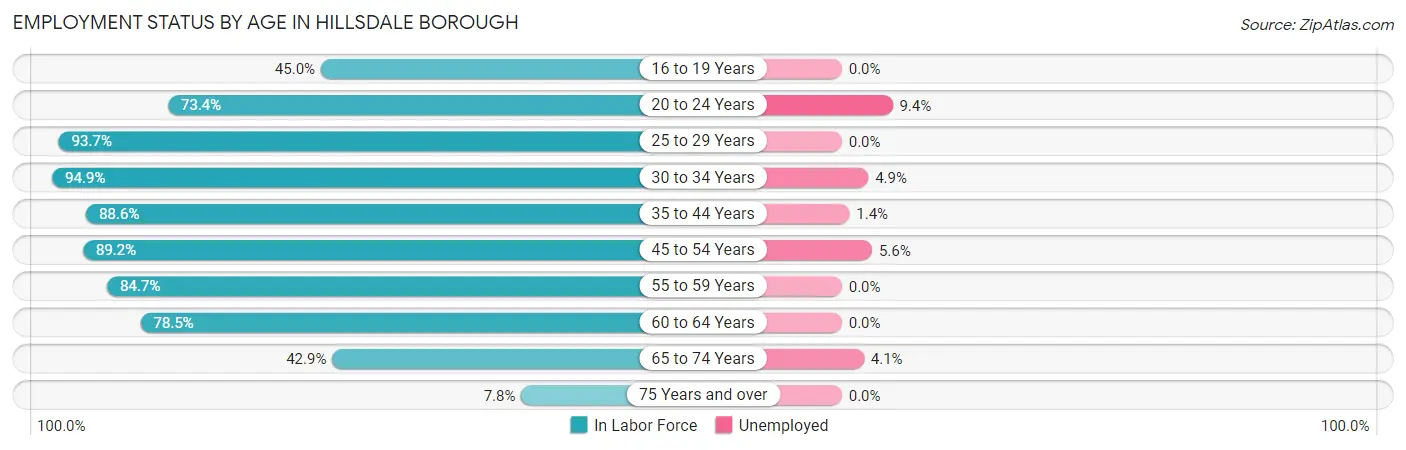
| Age Bracket | In Labor Force | Unemployed |
| 16 to 19 Years | 309 (45.0%) | 0 (0.0%) |
| 20 to 24 Years | 585 (73.4%) | 55 (9.4%) |
| 25 to 29 Years | 448 (93.7%) | 0 (0.0%) |
| 30 to 34 Years | 408 (94.9%) | 20 (4.9%) |
| 35 to 44 Years | 1,223 (88.6%) | 17 (1.4%) |
| 45 to 54 Years | 1,169 (89.2%) | 65 (5.6%) |
| 55 to 59 Years | 890 (84.7%) | 0 (0.0%) |
| 60 to 64 Years | 563 (78.5%) | 0 (0.0%) |
| 65 to 74 Years | 341 (42.9%) | 14 (4.1%) |
| 75 Years and over | 54 (7.8%) | 0 (0.0%) |
| Total | 5,993 (71.9%) | 174 (2.9%) |
Employment Status by Educational Attainment in Hillsdale borough
According to labor force statistics for Hillsdale borough, 87.6% of individuals (4,701) out of the total population between 25 and 64 years of age (5,367) are in the labor force, with 2.2% or 103 of them being unemployed. The group with the highest labor force participation rate are those with the educational attainment of bachelor's degree or higher, with 88.8% or 3,281 individuals in the labor force. Within the labor force, individuals with high school diploma education have the highest percentage of unemployment, with 8.5% or 42 of them being unemployed.
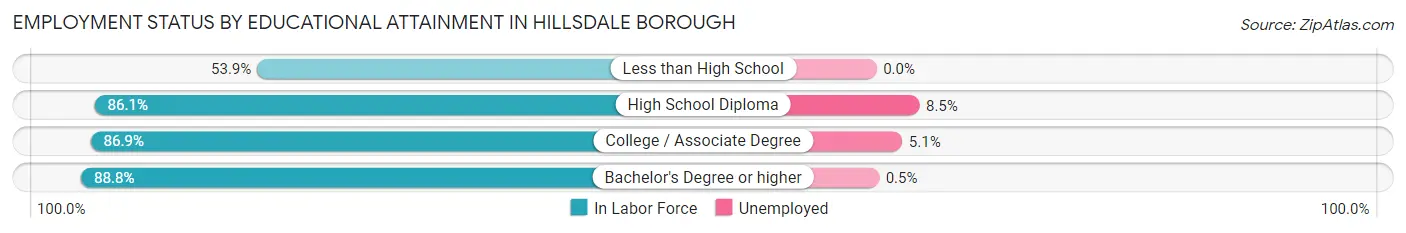
| Educational Attainment | In Labor Force | Unemployed |
| Less than High School | 48 (53.9%) | 0 (0.0%) |
| High School Diploma | 494 (86.1%) | 49 (8.5%) |
| College / Associate Degree | 877 (86.9%) | 51 (5.1%) |
| Bachelor's Degree or higher | 3,281 (88.8%) | 18 (0.5%) |
| Total | 4,701 (87.6%) | 118 (2.2%) |
Employment Occupations by Sex in Hillsdale borough
Management, Business, Science and Arts Occupations
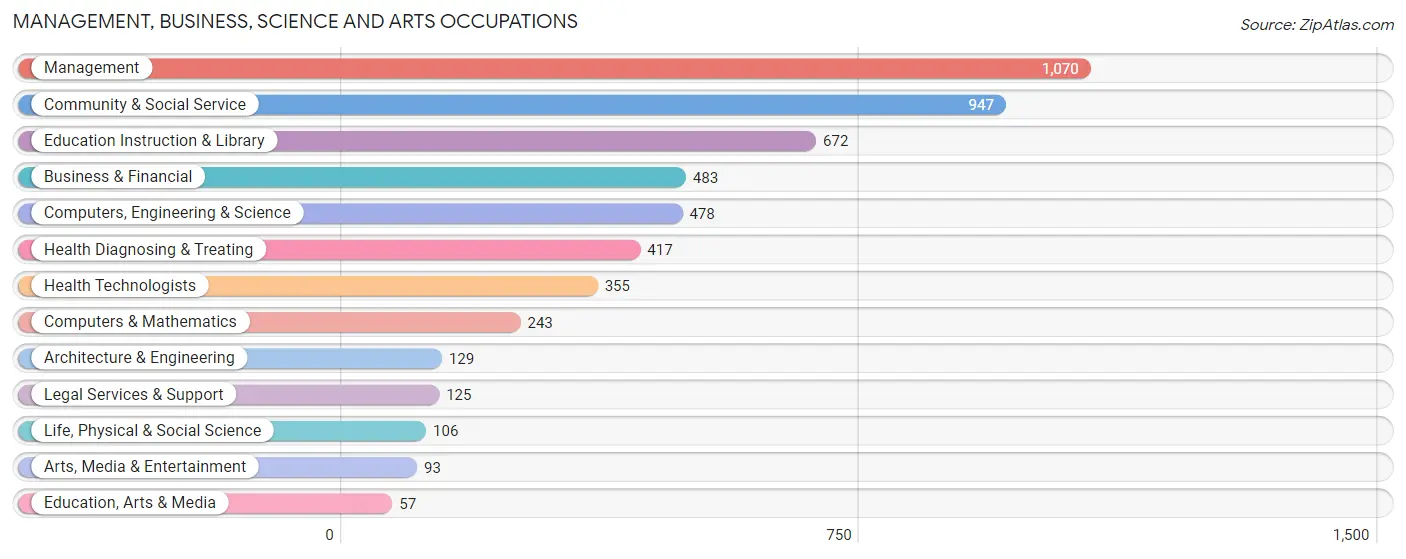
The most common Management, Business, Science and Arts occupations in Hillsdale borough are Management (1,070 | 18.4%), Community & Social Service (947 | 16.3%), Education Instruction & Library (672 | 11.6%), Business & Financial (483 | 8.3%), and Computers, Engineering & Science (478 | 8.2%).
Management, Business, Science and Arts Occupations by Sex
Within the Management, Business, Science and Arts occupations in Hillsdale borough, the most male-oriented occupations are Architecture & Engineering (100.0%), Computers & Mathematics (61.7%), and Computers, Engineering & Science (60.5%), while the most female-oriented occupations are Education, Arts & Media (100.0%), Life, Physical & Social Science (90.6%), and Arts, Media & Entertainment (81.7%).
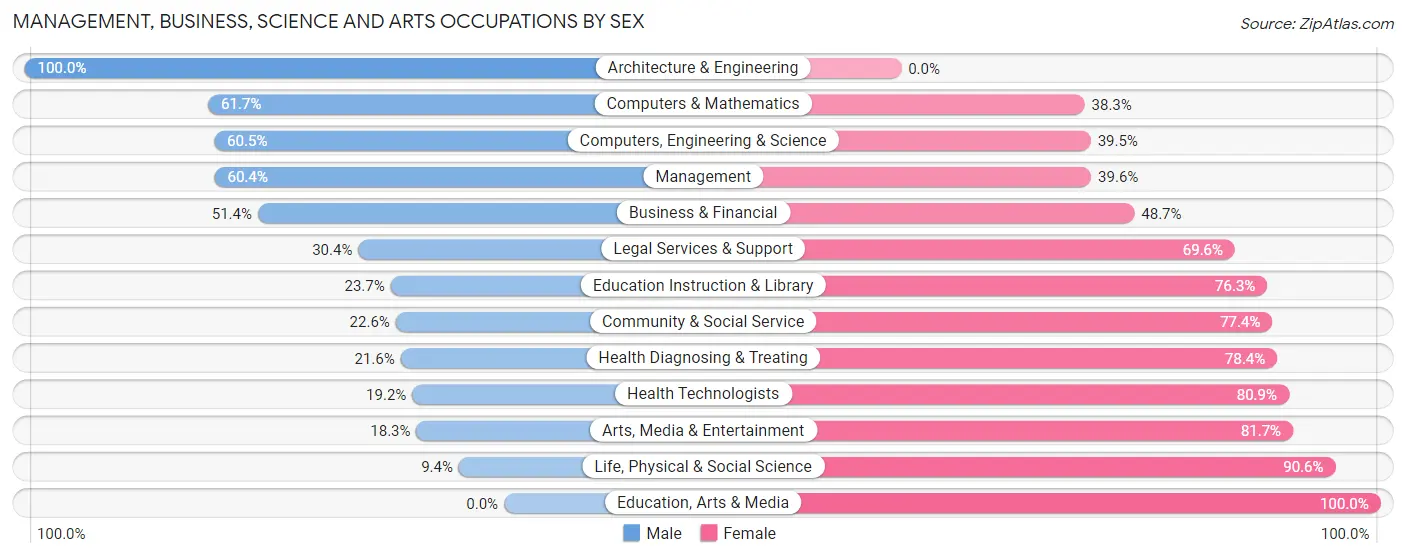
| Occupation | Male | Female |
| Management | 646 (60.4%) | 424 (39.6%) |
| Business & Financial | 248 (51.3%) | 235 (48.6%) |
| Computers, Engineering & Science | 289 (60.5%) | 189 (39.5%) |
| Computers & Mathematics | 150 (61.7%) | 93 (38.3%) |
| Architecture & Engineering | 129 (100.0%) | 0 (0.0%) |
| Life, Physical & Social Science | 10 (9.4%) | 96 (90.6%) |
| Community & Social Service | 214 (22.6%) | 733 (77.4%) |
| Education, Arts & Media | 0 (0.0%) | 57 (100.0%) |
| Legal Services & Support | 38 (30.4%) | 87 (69.6%) |
| Education Instruction & Library | 159 (23.7%) | 513 (76.3%) |
| Arts, Media & Entertainment | 17 (18.3%) | 76 (81.7%) |
| Health Diagnosing & Treating | 90 (21.6%) | 327 (78.4%) |
| Health Technologists | 68 (19.2%) | 287 (80.8%) |
| Total (Category) | 1,487 (43.8%) | 1,908 (56.2%) |
| Total (Overall) | 2,775 (47.7%) | 3,044 (52.3%) |
Services Occupations
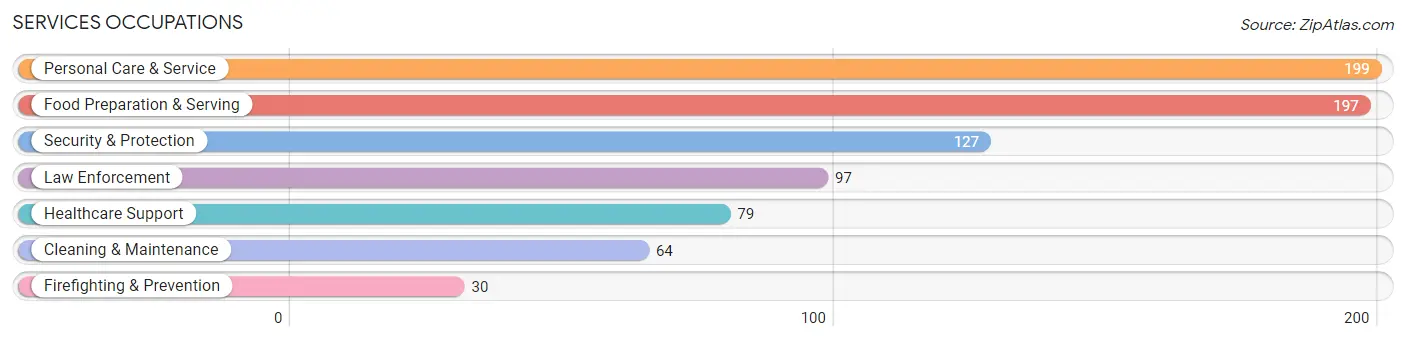
The most common Services occupations in Hillsdale borough are Personal Care & Service (199 | 3.4%), Food Preparation & Serving (197 | 3.4%), Security & Protection (127 | 2.2%), Law Enforcement (97 | 1.7%), and Healthcare Support (79 | 1.4%).
Services Occupations by Sex
Within the Services occupations in Hillsdale borough, the most male-oriented occupations are Law Enforcement (100.0%), Security & Protection (89.0%), and Cleaning & Maintenance (85.9%), while the most female-oriented occupations are Personal Care & Service (79.4%), Food Preparation & Serving (61.4%), and Firefighting & Prevention (46.7%).
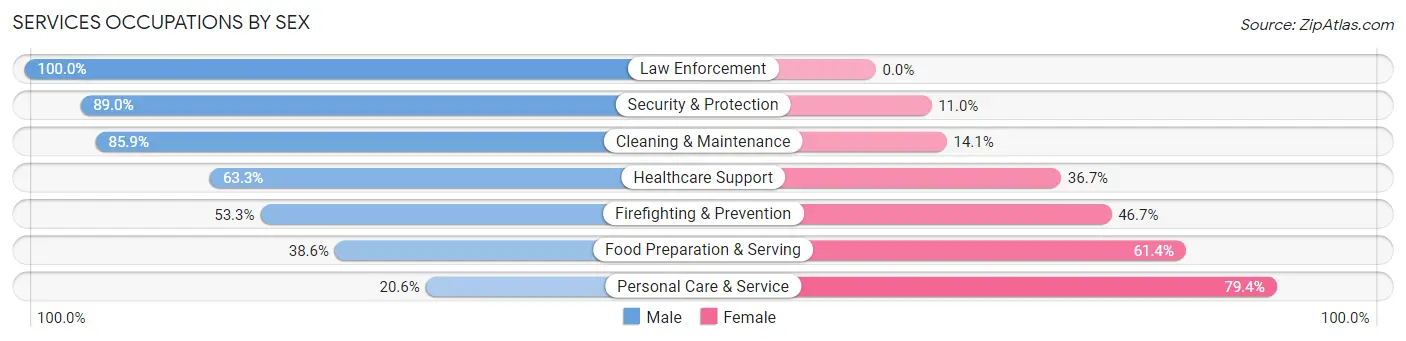
| Occupation | Male | Female |
| Healthcare Support | 50 (63.3%) | 29 (36.7%) |
| Security & Protection | 113 (89.0%) | 14 (11.0%) |
| Firefighting & Prevention | 16 (53.3%) | 14 (46.7%) |
| Law Enforcement | 97 (100.0%) | 0 (0.0%) |
| Food Preparation & Serving | 76 (38.6%) | 121 (61.4%) |
| Cleaning & Maintenance | 55 (85.9%) | 9 (14.1%) |
| Personal Care & Service | 41 (20.6%) | 158 (79.4%) |
| Total (Category) | 335 (50.3%) | 331 (49.7%) |
| Total (Overall) | 2,775 (47.7%) | 3,044 (52.3%) |
Sales and Office Occupations
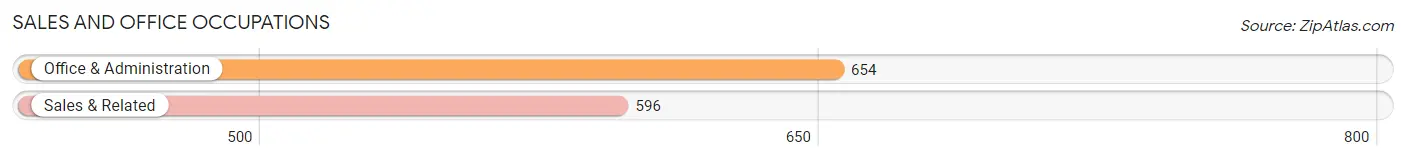
The most common Sales and Office occupations in Hillsdale borough are Office & Administration (654 | 11.2%), and Sales & Related (596 | 10.2%).
Sales and Office Occupations by Sex
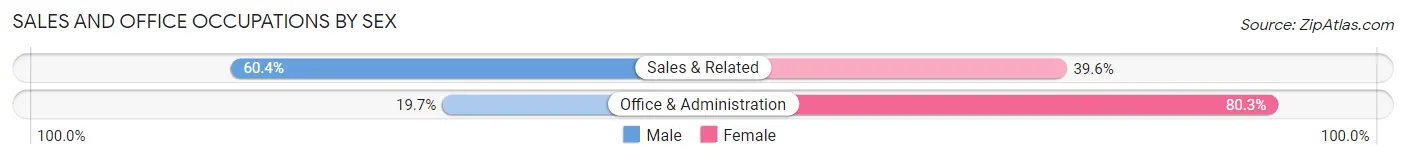
| Occupation | Male | Female |
| Sales & Related | 360 (60.4%) | 236 (39.6%) |
| Office & Administration | 129 (19.7%) | 525 (80.3%) |
| Total (Category) | 489 (39.1%) | 761 (60.9%) |
| Total (Overall) | 2,775 (47.7%) | 3,044 (52.3%) |
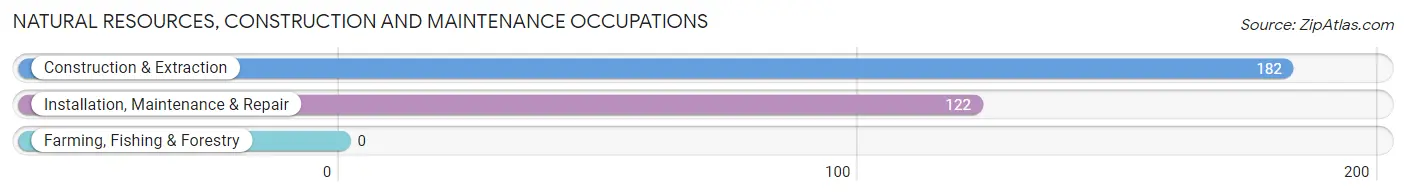
Natural Resources, Construction and Maintenance Occupations
The most common Natural Resources, Construction and Maintenance occupations in Hillsdale borough are Construction & Extraction (182 | 3.1%), and Installation, Maintenance & Repair (122 | 2.1%).
Natural Resources, Construction and Maintenance Occupations by Sex
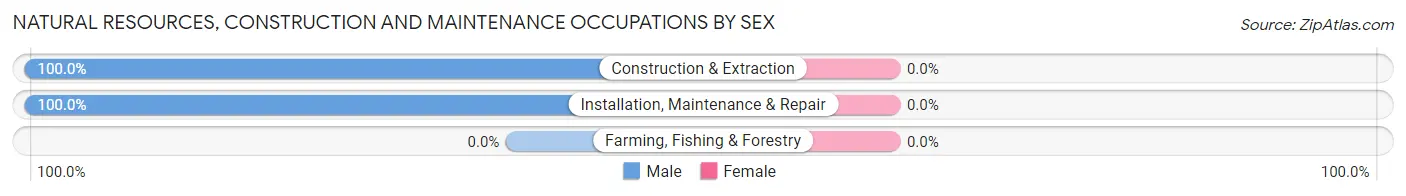
| Occupation | Male | Female |
| Farming, Fishing & Forestry | 0 (0.0%) | 0 (0.0%) |
| Construction & Extraction | 182 (100.0%) | 0 (0.0%) |
| Installation, Maintenance & Repair | 122 (100.0%) | 0 (0.0%) |
| Total (Category) | 304 (100.0%) | 0 (0.0%) |
| Total (Overall) | 2,775 (47.7%) | 3,044 (52.3%) |
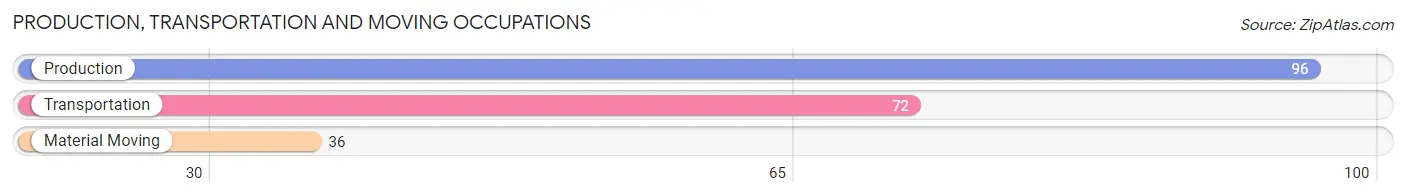
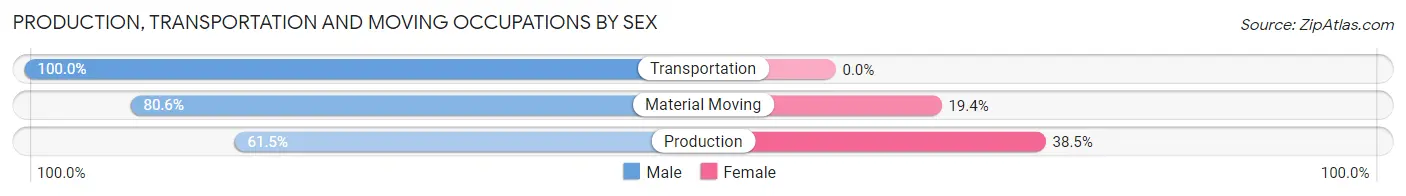
Production, Transportation and Moving Occupations
The most common Production, Transportation and Moving occupations in Hillsdale borough are Production (96 | 1.7%), Transportation (72 | 1.2%), and Material Moving (36 | 0.6%).
Production, Transportation and Moving Occupations by Sex
| Occupation | Male | Female |
| Production | 59 (61.5%) | 37 (38.5%) |
| Transportation | 72 (100.0%) | 0 (0.0%) |
| Material Moving | 29 (80.6%) | 7 (19.4%) |
| Total (Category) | 160 (78.4%) | 44 (21.6%) |
| Total (Overall) | 2,775 (47.7%) | 3,044 (52.3%) |
Employment Industries by Sex in Hillsdale borough
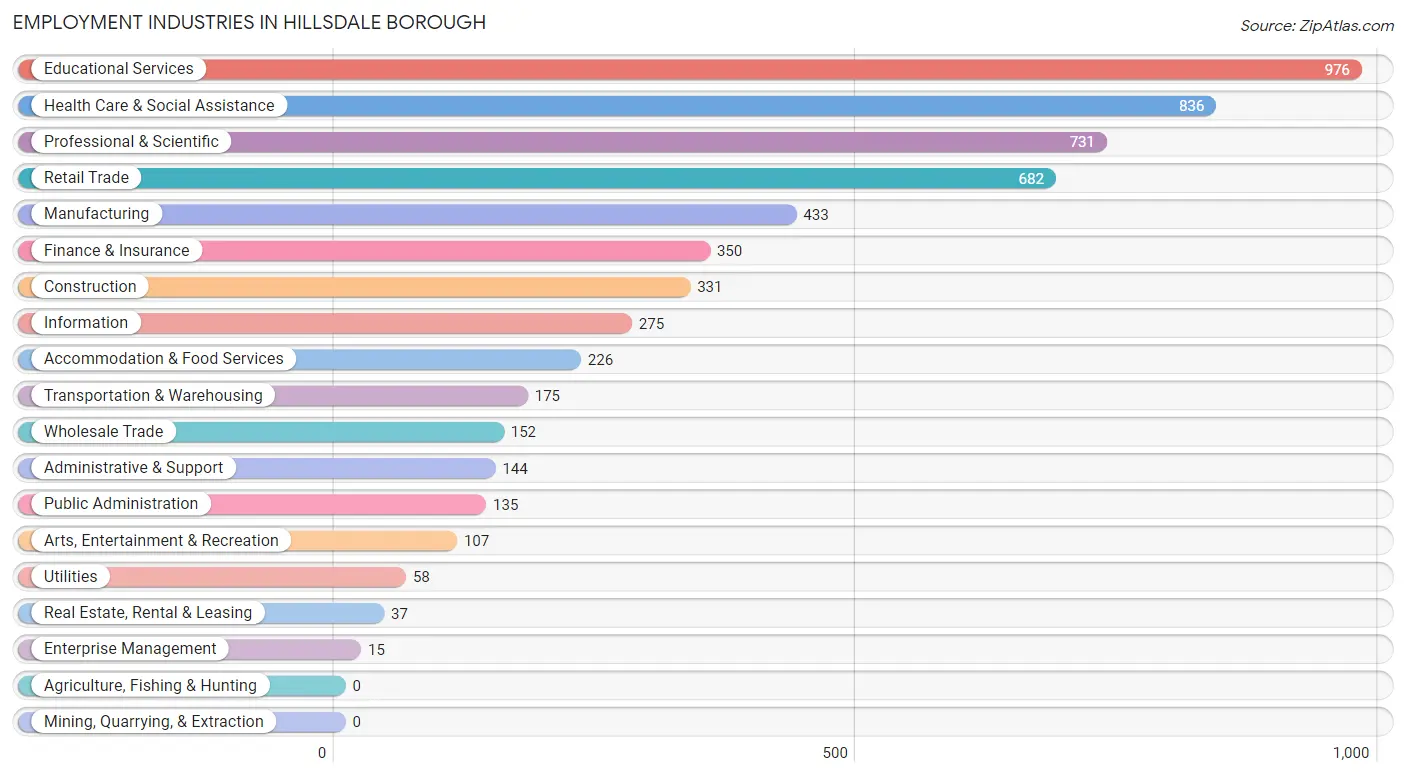
Employment Industries in Hillsdale borough
The major employment industries in Hillsdale borough include Educational Services (976 | 16.8%), Health Care & Social Assistance (836 | 14.4%), Professional & Scientific (731 | 12.6%), Retail Trade (682 | 11.7%), and Manufacturing (433 | 7.4%).
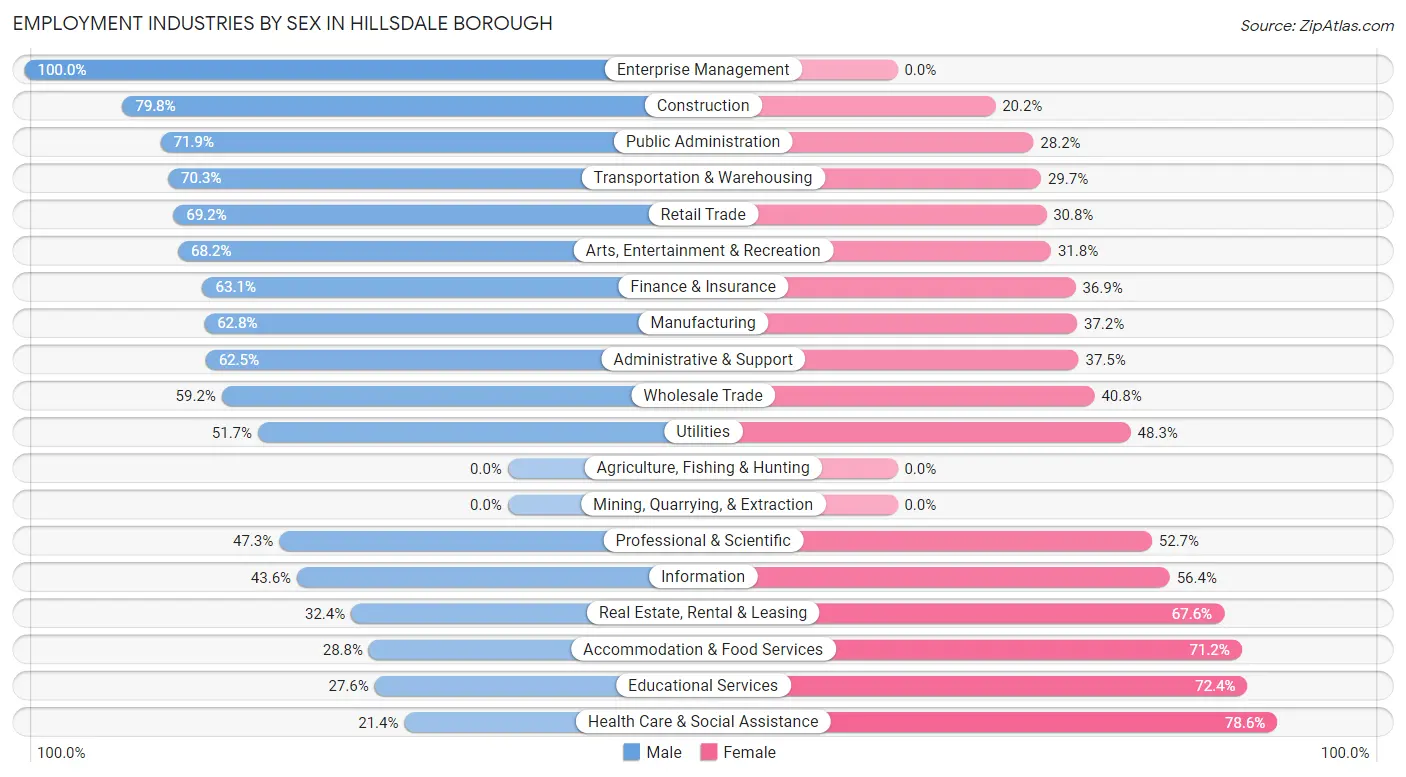
Employment Industries by Sex in Hillsdale borough
The Hillsdale borough industries that see more men than women are Enterprise Management (100.0%), Construction (79.8%), and Public Administration (71.9%), whereas the industries that tend to have a higher number of women are Health Care & Social Assistance (78.6%), Educational Services (72.4%), and Accommodation & Food Services (71.2%).
| Industry | Male | Female |
| Agriculture, Fishing & Hunting | 0 (0.0%) | 0 (0.0%) |
| Mining, Quarrying, & Extraction | 0 (0.0%) | 0 (0.0%) |
| Construction | 264 (79.8%) | 67 (20.2%) |
| Manufacturing | 272 (62.8%) | 161 (37.2%) |
| Wholesale Trade | 90 (59.2%) | 62 (40.8%) |
| Retail Trade | 472 (69.2%) | 210 (30.8%) |
| Transportation & Warehousing | 123 (70.3%) | 52 (29.7%) |
| Utilities | 30 (51.7%) | 28 (48.3%) |
| Information | 120 (43.6%) | 155 (56.4%) |
| Finance & Insurance | 221 (63.1%) | 129 (36.9%) |
| Real Estate, Rental & Leasing | 12 (32.4%) | 25 (67.6%) |
| Professional & Scientific | 346 (47.3%) | 385 (52.7%) |
| Enterprise Management | 15 (100.0%) | 0 (0.0%) |
| Administrative & Support | 90 (62.5%) | 54 (37.5%) |
| Educational Services | 269 (27.6%) | 707 (72.4%) |
| Health Care & Social Assistance | 179 (21.4%) | 657 (78.6%) |
| Arts, Entertainment & Recreation | 73 (68.2%) | 34 (31.8%) |
| Accommodation & Food Services | 65 (28.8%) | 161 (71.2%) |
| Public Administration | 97 (71.9%) | 38 (28.1%) |
| Total | 2,775 (47.7%) | 3,044 (52.3%) |
Education in Hillsdale borough
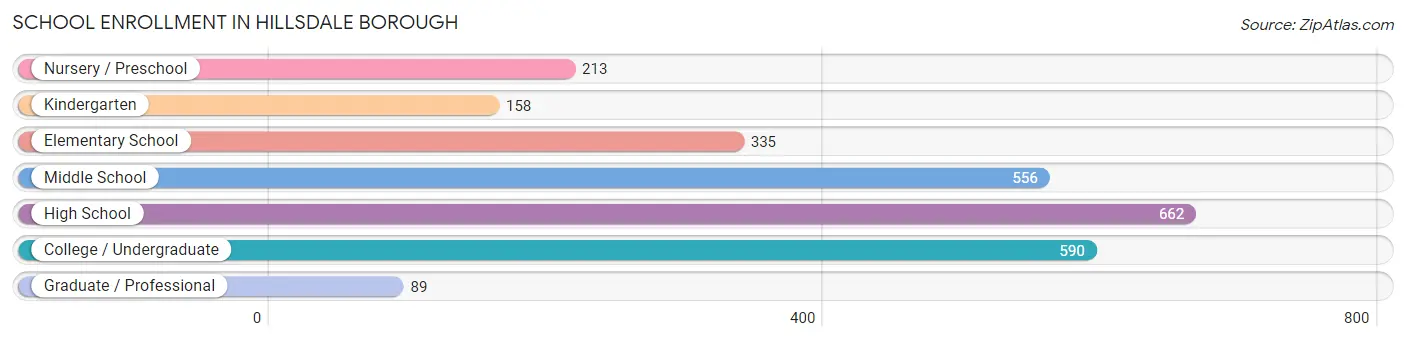
School Enrollment in Hillsdale borough
The most common levels of schooling among the 2,603 students in Hillsdale borough are high school (662 | 25.4%), college / undergraduate (590 | 22.7%), and middle school (556 | 21.4%).
| School Level | # Students | % Students |
| Nursery / Preschool | 213 | 8.2% |
| Kindergarten | 158 | 6.1% |
| Elementary School | 335 | 12.9% |
| Middle School | 556 | 21.4% |
| High School | 662 | 25.4% |
| College / Undergraduate | 590 | 22.7% |
| Graduate / Professional | 89 | 3.4% |
| Total | 2,603 | 100.0% |
School Enrollment by Age by Funding Source in Hillsdale borough
Out of a total of 2,603 students who are enrolled in schools in Hillsdale borough, 487 (18.7%) attend a private institution, while the remaining 2,116 (81.3%) are enrolled in public schools. The age group of 3 to 4 year olds has the highest likelihood of being enrolled in private schools, with 116 (65.9% in the age bracket) enrolled. Conversely, the age group of 15 to 17 year olds has the lowest likelihood of being enrolled in a private school, with 407 (93.1% in the age bracket) attending a public institution.
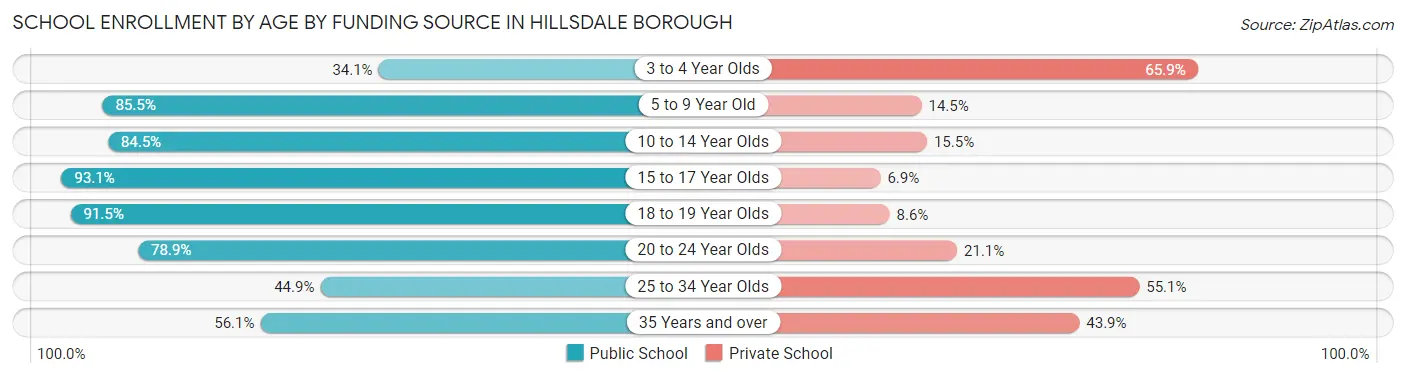
| Age Bracket | Public School | Private School |
| 3 to 4 Year Olds | 60 (34.1%) | 116 (65.9%) |
| 5 to 9 Year Old | 436 (85.5%) | 74 (14.5%) |
| 10 to 14 Year Olds | 517 (84.5%) | 95 (15.5%) |
| 15 to 17 Year Olds | 407 (93.1%) | 30 (6.9%) |
| 18 to 19 Year Olds | 321 (91.4%) | 30 (8.6%) |
| 20 to 24 Year Olds | 321 (78.9%) | 86 (21.1%) |
| 25 to 34 Year Olds | 31 (44.9%) | 38 (55.1%) |
| 35 Years and over | 23 (56.1%) | 18 (43.9%) |
| Total | 2,116 (81.3%) | 487 (18.7%) |
Educational Attainment by Field of Study in Hillsdale borough
Business (1,168 | 25.5%), education (503 | 11.0%), engineering (428 | 9.3%), communications (376 | 8.2%), and science & technology (366 | 8.0%) are the most common fields of study among 4,582 individuals in Hillsdale borough who have obtained a bachelor's degree or higher.
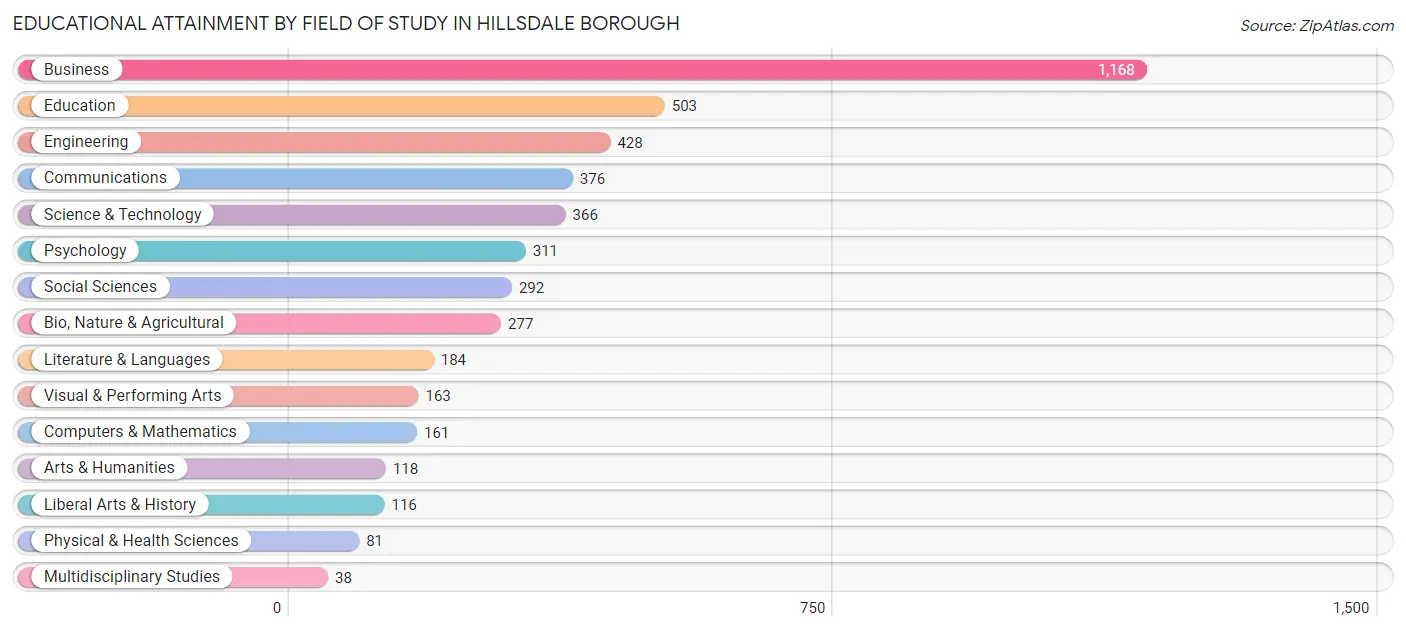
| Field of Study | # Graduates | % Graduates |
| Computers & Mathematics | 161 | 3.5% |
| Bio, Nature & Agricultural | 277 | 6.0% |
| Physical & Health Sciences | 81 | 1.8% |
| Psychology | 311 | 6.8% |
| Social Sciences | 292 | 6.4% |
| Engineering | 428 | 9.3% |
| Multidisciplinary Studies | 38 | 0.8% |
| Science & Technology | 366 | 8.0% |
| Business | 1,168 | 25.5% |
| Education | 503 | 11.0% |
| Literature & Languages | 184 | 4.0% |
| Liberal Arts & History | 116 | 2.5% |
| Visual & Performing Arts | 163 | 3.6% |
| Communications | 376 | 8.2% |
| Arts & Humanities | 118 | 2.6% |
| Total | 4,582 | 100.0% |
Transportation & Commute in Hillsdale borough
Vehicle Availability by Sex in Hillsdale borough
The most prevalent vehicle ownership categories in Hillsdale borough are males with 2 vehicles (1,238, accounting for 45.7%) and females with 2 vehicles (1,344, making up 42.4%).
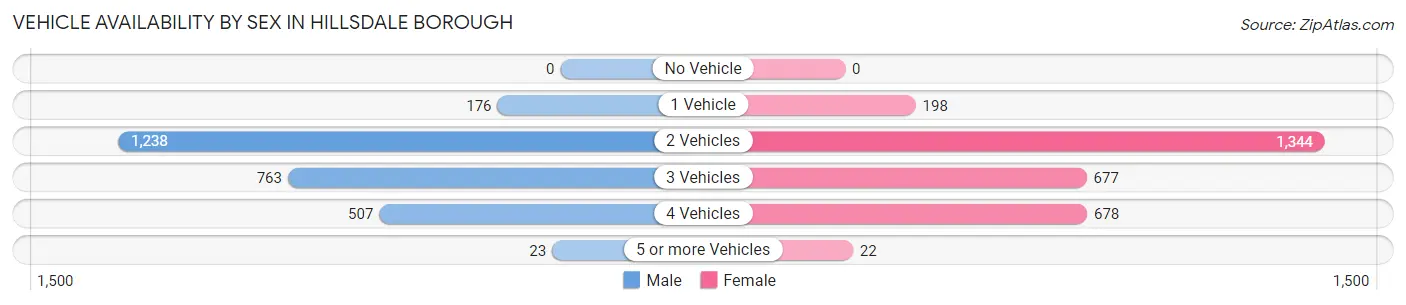
| Vehicles Available | Male | Female |
| No Vehicle | 0 (0.0%) | 0 (0.0%) |
| 1 Vehicle | 176 (6.5%) | 198 (6.8%) |
| 2 Vehicles | 1,238 (45.7%) | 1,344 (46.0%) |
| 3 Vehicles | 763 (28.2%) | 677 (23.2%) |
| 4 Vehicles | 507 (18.7%) | 678 (23.2%) |
| 5 or more Vehicles | 23 (0.9%) | 22 (0.7%) |
| Total | 2,707 (100.0%) | 2,919 (100.0%) |
Commute Time in Hillsdale borough
The most frequently occuring commute durations in Hillsdale borough are 15 to 19 minutes (809 commuters, 17.9%), 10 to 14 minutes (807 commuters, 17.9%), and 20 to 24 minutes (544 commuters, 12.0%).
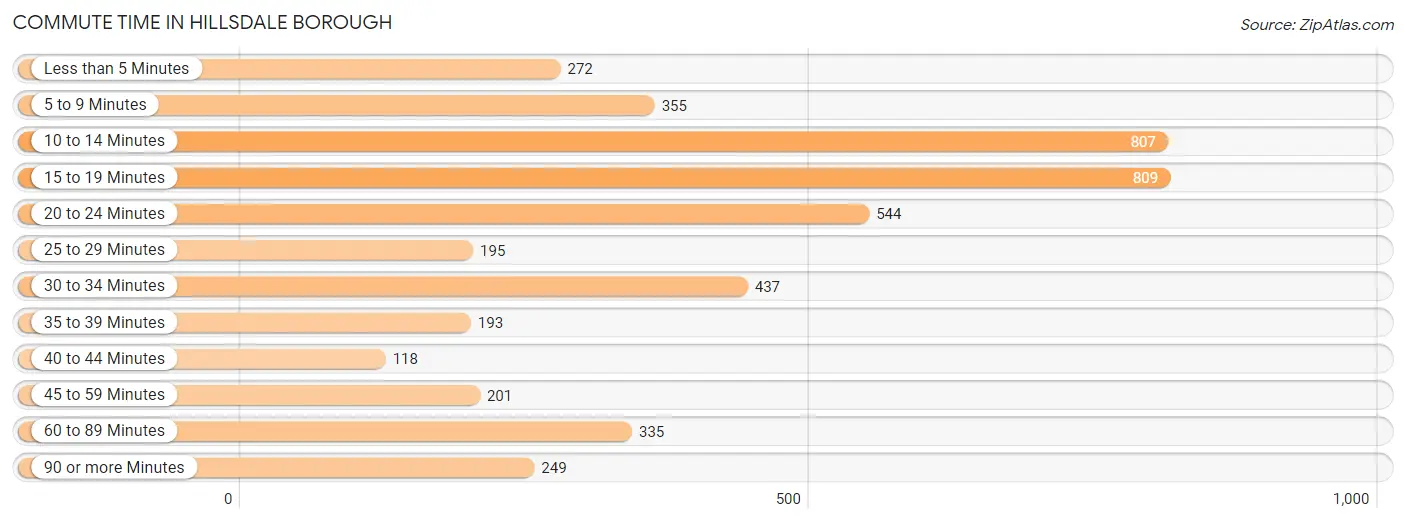
| Commute Time | # Commuters | % Commuters |
| Less than 5 Minutes | 272 | 6.0% |
| 5 to 9 Minutes | 355 | 7.9% |
| 10 to 14 Minutes | 807 | 17.9% |
| 15 to 19 Minutes | 809 | 17.9% |
| 20 to 24 Minutes | 544 | 12.0% |
| 25 to 29 Minutes | 195 | 4.3% |
| 30 to 34 Minutes | 437 | 9.7% |
| 35 to 39 Minutes | 193 | 4.3% |
| 40 to 44 Minutes | 118 | 2.6% |
| 45 to 59 Minutes | 201 | 4.4% |
| 60 to 89 Minutes | 335 | 7.4% |
| 90 or more Minutes | 249 | 5.5% |
Commute Time by Sex in Hillsdale borough
The most common commute times in Hillsdale borough are 15 to 19 minutes (337 commuters, 15.6%) for males and 10 to 14 minutes (497 commuters, 21.1%) for females.
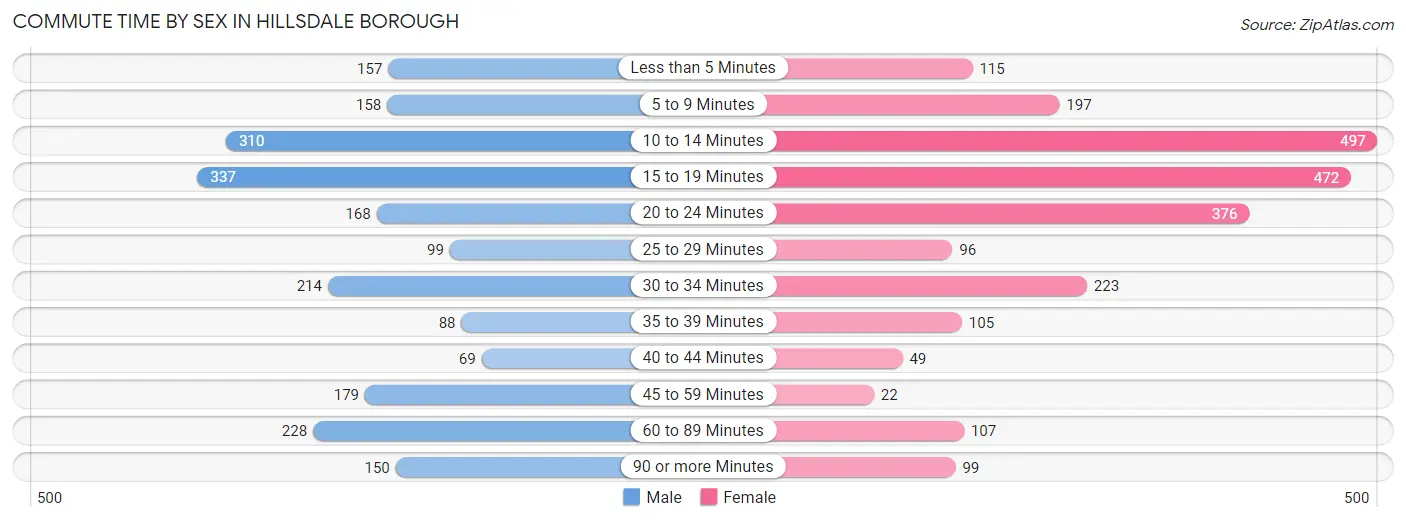
| Commute Time | Male | Female |
| Less than 5 Minutes | 157 (7.3%) | 115 (4.9%) |
| 5 to 9 Minutes | 158 (7.3%) | 197 (8.4%) |
| 10 to 14 Minutes | 310 (14.4%) | 497 (21.1%) |
| 15 to 19 Minutes | 337 (15.6%) | 472 (20.0%) |
| 20 to 24 Minutes | 168 (7.8%) | 376 (16.0%) |
| 25 to 29 Minutes | 99 (4.6%) | 96 (4.1%) |
| 30 to 34 Minutes | 214 (9.9%) | 223 (9.5%) |
| 35 to 39 Minutes | 88 (4.1%) | 105 (4.4%) |
| 40 to 44 Minutes | 69 (3.2%) | 49 (2.1%) |
| 45 to 59 Minutes | 179 (8.3%) | 22 (0.9%) |
| 60 to 89 Minutes | 228 (10.6%) | 107 (4.5%) |
| 90 or more Minutes | 150 (7.0%) | 99 (4.2%) |
Time of Departure to Work by Sex in Hillsdale borough
The most frequent times of departure to work in Hillsdale borough are 8:00 AM to 8:29 AM (355, 16.5%) for males and 7:30 AM to 7:59 AM (389, 16.5%) for females.
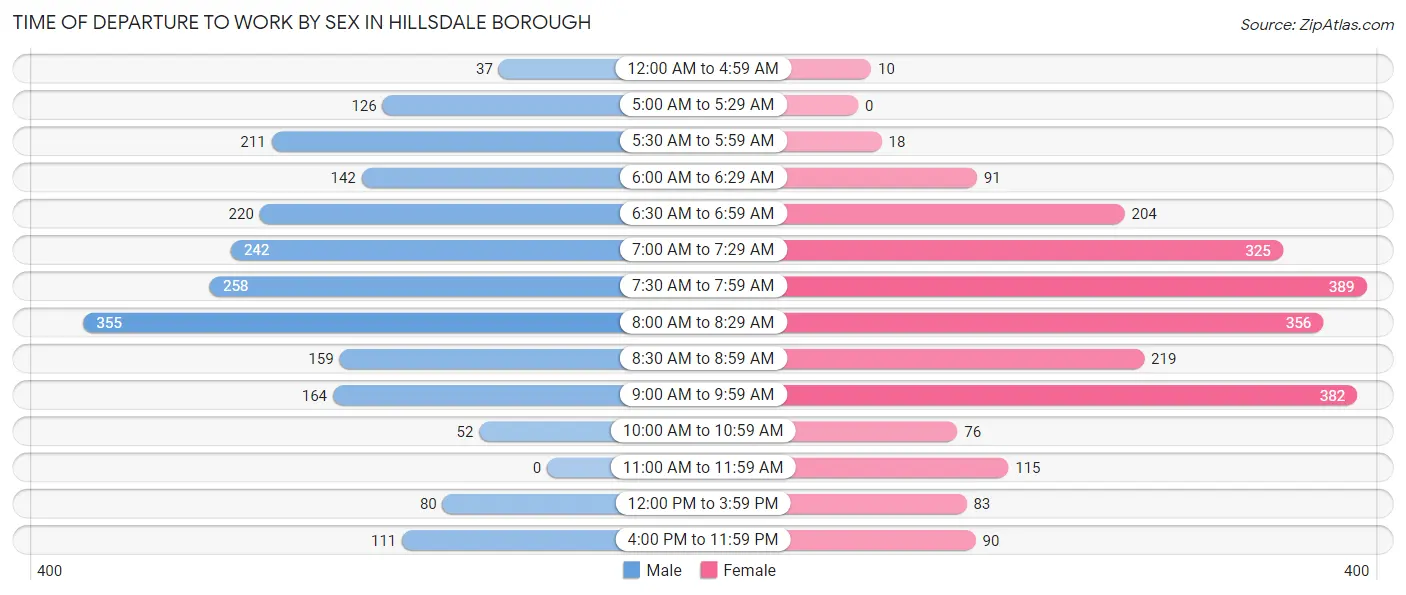
| Time of Departure | Male | Female |
| 12:00 AM to 4:59 AM | 37 (1.7%) | 10 (0.4%) |
| 5:00 AM to 5:29 AM | 126 (5.8%) | 0 (0.0%) |
| 5:30 AM to 5:59 AM | 211 (9.8%) | 18 (0.8%) |
| 6:00 AM to 6:29 AM | 142 (6.6%) | 91 (3.9%) |
| 6:30 AM to 6:59 AM | 220 (10.2%) | 204 (8.6%) |
| 7:00 AM to 7:29 AM | 242 (11.2%) | 325 (13.8%) |
| 7:30 AM to 7:59 AM | 258 (12.0%) | 389 (16.5%) |
| 8:00 AM to 8:29 AM | 355 (16.5%) | 356 (15.1%) |
| 8:30 AM to 8:59 AM | 159 (7.4%) | 219 (9.3%) |
| 9:00 AM to 9:59 AM | 164 (7.6%) | 382 (16.2%) |
| 10:00 AM to 10:59 AM | 52 (2.4%) | 76 (3.2%) |
| 11:00 AM to 11:59 AM | 0 (0.0%) | 115 (4.9%) |
| 12:00 PM to 3:59 PM | 80 (3.7%) | 83 (3.5%) |
| 4:00 PM to 11:59 PM | 111 (5.1%) | 90 (3.8%) |
| Total | 2,157 (100.0%) | 2,358 (100.0%) |
Housing Occupancy in Hillsdale borough
Occupancy by Ownership in Hillsdale borough
Of the total 3,416 dwellings in Hillsdale borough, owner-occupied units account for 3,102 (90.8%), while renter-occupied units make up 314 (9.2%).
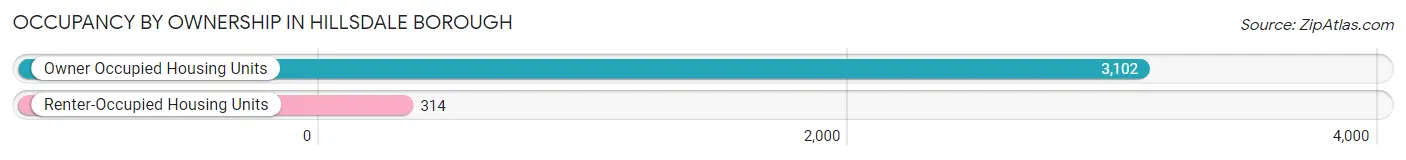
| Occupancy | # Housing Units | % Housing Units |
| Owner Occupied Housing Units | 3,102 | 90.8% |
| Renter-Occupied Housing Units | 314 | 9.2% |
| Total Occupied Housing Units | 3,416 | 100.0% |
Occupancy by Household Size in Hillsdale borough
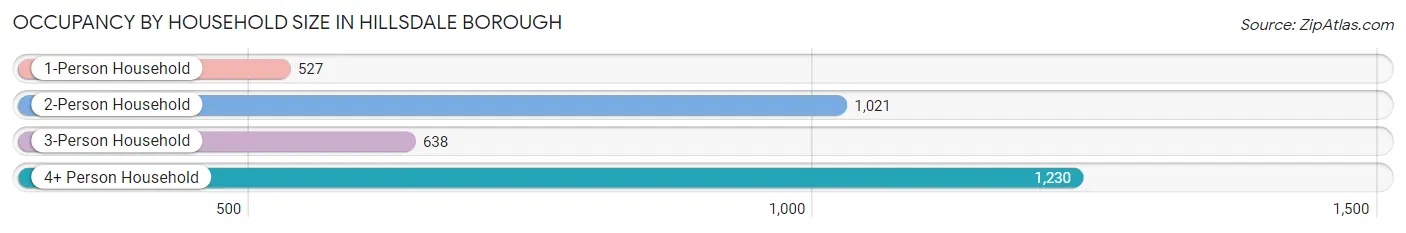
| Household Size | # Housing Units | % Housing Units |
| 1-Person Household | 527 | 15.4% |
| 2-Person Household | 1,021 | 29.9% |
| 3-Person Household | 638 | 18.7% |
| 4+ Person Household | 1,230 | 36.0% |
| Total Housing Units | 3,416 | 100.0% |
Occupancy by Ownership by Household Size in Hillsdale borough
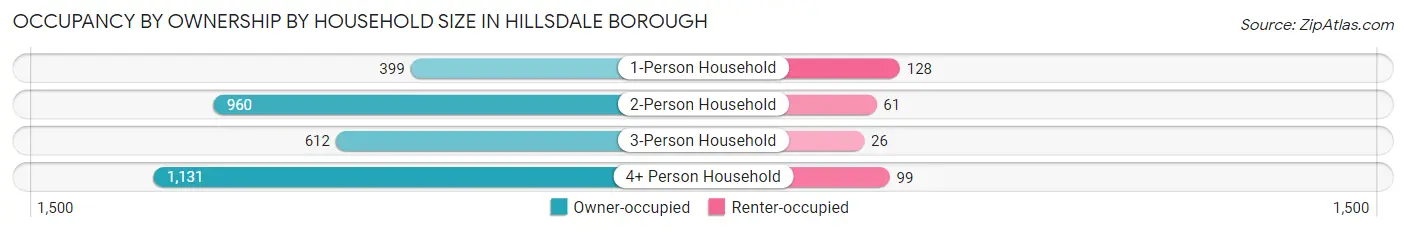
| Household Size | Owner-occupied | Renter-occupied |
| 1-Person Household | 399 (75.7%) | 128 (24.3%) |
| 2-Person Household | 960 (94.0%) | 61 (6.0%) |
| 3-Person Household | 612 (95.9%) | 26 (4.1%) |
| 4+ Person Household | 1,131 (91.9%) | 99 (8.1%) |
| Total Housing Units | 3,102 (90.8%) | 314 (9.2%) |
Occupancy by Educational Attainment in Hillsdale borough
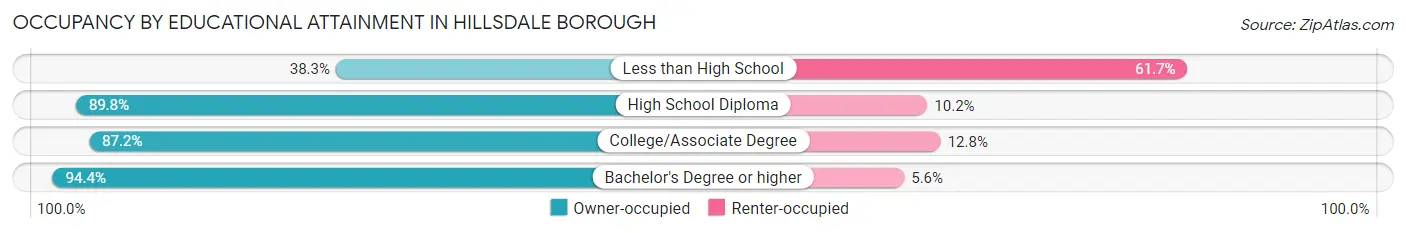
| Household Size | Owner-occupied | Renter-occupied |
| Less than High School | 36 (38.3%) | 58 (61.7%) |
| High School Diploma | 327 (89.8%) | 37 (10.2%) |
| College/Associate Degree | 654 (87.2%) | 96 (12.8%) |
| Bachelor's Degree or higher | 2,085 (94.4%) | 123 (5.6%) |
Occupancy by Age of Householder in Hillsdale borough
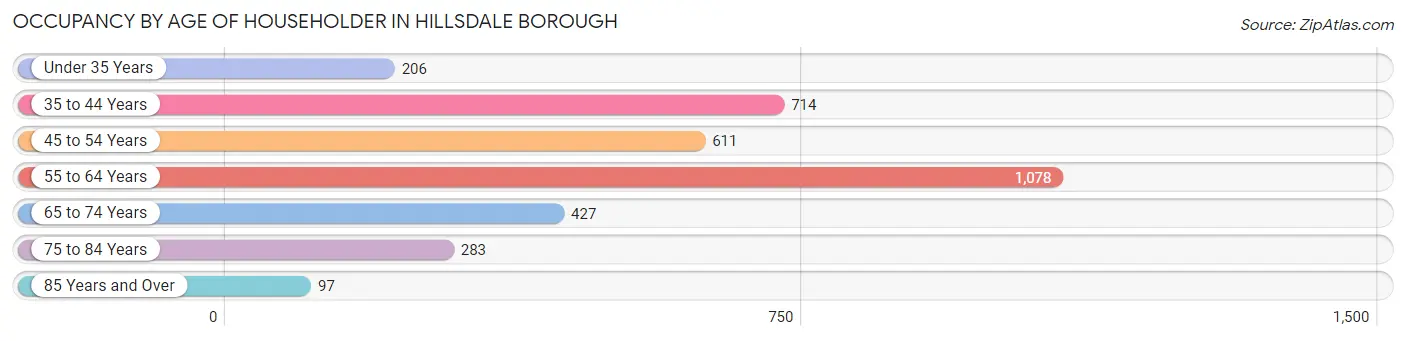
| Age Bracket | # Households | % Households |
| Under 35 Years | 206 | 6.0% |
| 35 to 44 Years | 714 | 20.9% |
| 45 to 54 Years | 611 | 17.9% |
| 55 to 64 Years | 1,078 | 31.6% |
| 65 to 74 Years | 427 | 12.5% |
| 75 to 84 Years | 283 | 8.3% |
| 85 Years and Over | 97 | 2.8% |
| Total | 3,416 | 100.0% |
Housing Finances in Hillsdale borough
Median Income by Occupancy in Hillsdale borough
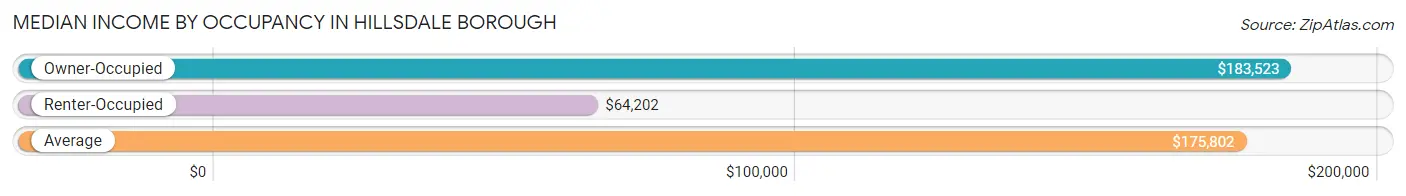
| Occupancy Type | # Households | Median Income |
| Owner-Occupied | 3,102 (90.8%) | $183,523 |
| Renter-Occupied | 314 (9.2%) | $64,202 |
| Average | 3,416 (100.0%) | $175,802 |
Occupancy by Householder Income Bracket in Hillsdale borough
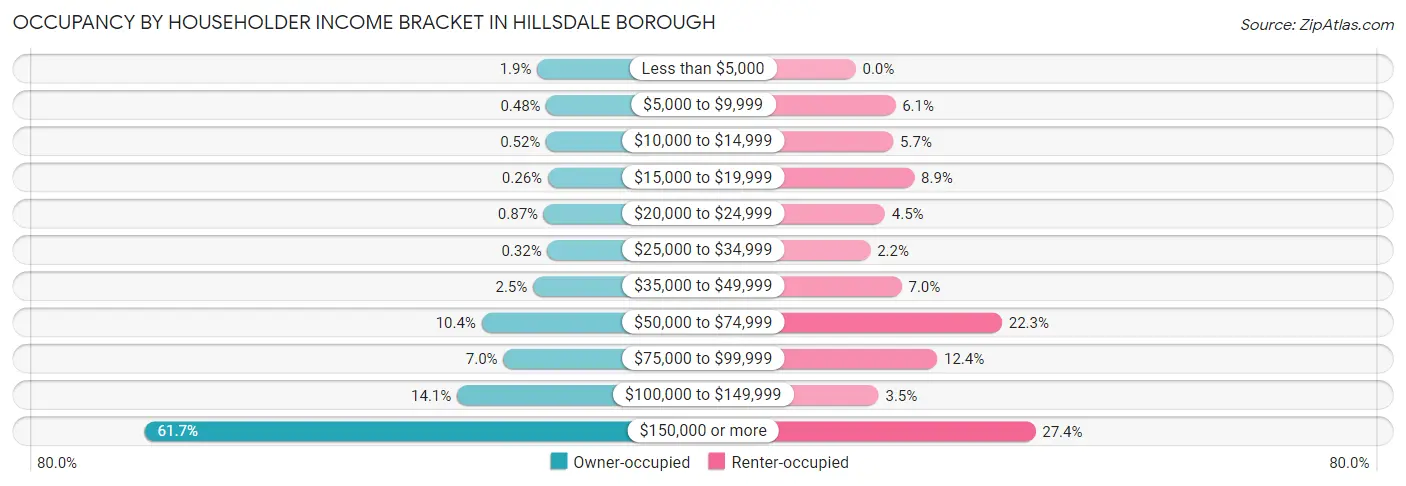
| Income Bracket | Owner-occupied | Renter-occupied |
| Less than $5,000 | 58 (1.9%) | 0 (0.0%) |
| $5,000 to $9,999 | 15 (0.5%) | 19 (6.0%) |
| $10,000 to $14,999 | 16 (0.5%) | 18 (5.7%) |
| $15,000 to $19,999 | 8 (0.3%) | 28 (8.9%) |
| $20,000 to $24,999 | 27 (0.9%) | 14 (4.5%) |
| $25,000 to $34,999 | 10 (0.3%) | 7 (2.2%) |
| $35,000 to $49,999 | 78 (2.5%) | 22 (7.0%) |
| $50,000 to $74,999 | 321 (10.3%) | 70 (22.3%) |
| $75,000 to $99,999 | 218 (7.0%) | 39 (12.4%) |
| $100,000 to $149,999 | 437 (14.1%) | 11 (3.5%) |
| $150,000 or more | 1,914 (61.7%) | 86 (27.4%) |
| Total | 3,102 (100.0%) | 314 (100.0%) |
Monthly Housing Cost Tiers in Hillsdale borough
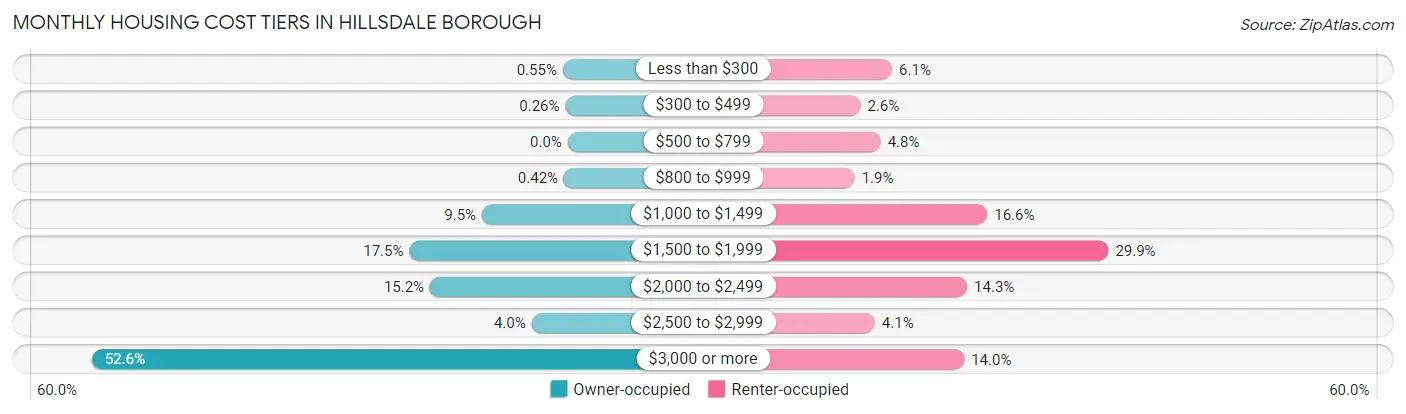
| Monthly Cost | Owner-occupied | Renter-occupied |
| Less than $300 | 17 (0.5%) | 19 (6.0%) |
| $300 to $499 | 8 (0.3%) | 8 (2.5%) |
| $500 to $799 | 0 (0.0%) | 15 (4.8%) |
| $800 to $999 | 13 (0.4%) | 6 (1.9%) |
| $1,000 to $1,499 | 294 (9.5%) | 52 (16.6%) |
| $1,500 to $1,999 | 543 (17.5%) | 94 (29.9%) |
| $2,000 to $2,499 | 472 (15.2%) | 45 (14.3%) |
| $2,500 to $2,999 | 124 (4.0%) | 13 (4.1%) |
| $3,000 or more | 1,631 (52.6%) | 44 (14.0%) |
| Total | 3,102 (100.0%) | 314 (100.0%) |
Physical Housing Characteristics in Hillsdale borough
Housing Structures in Hillsdale borough
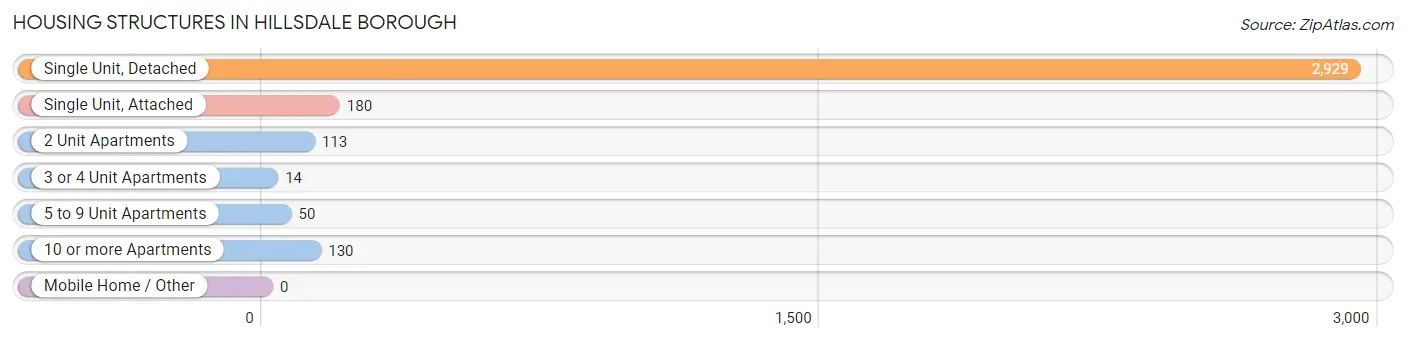
| Structure Type | # Housing Units | % Housing Units |
| Single Unit, Detached | 2,929 | 85.7% |
| Single Unit, Attached | 180 | 5.3% |
| 2 Unit Apartments | 113 | 3.3% |
| 3 or 4 Unit Apartments | 14 | 0.4% |
| 5 to 9 Unit Apartments | 50 | 1.5% |
| 10 or more Apartments | 130 | 3.8% |
| Mobile Home / Other | 0 | 0.0% |
| Total | 3,416 | 100.0% |
Housing Structures by Occupancy in Hillsdale borough
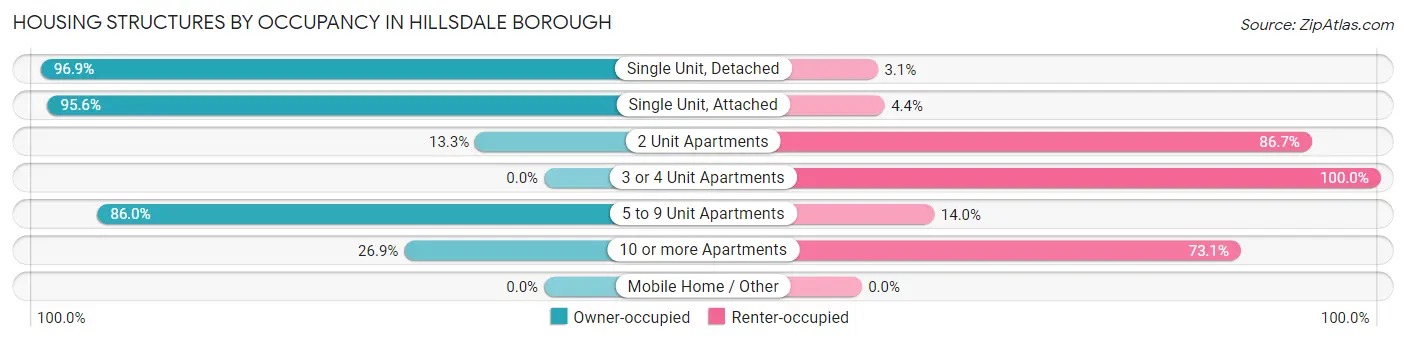
| Structure Type | Owner-occupied | Renter-occupied |
| Single Unit, Detached | 2,837 (96.9%) | 92 (3.1%) |
| Single Unit, Attached | 172 (95.6%) | 8 (4.4%) |
| 2 Unit Apartments | 15 (13.3%) | 98 (86.7%) |
| 3 or 4 Unit Apartments | 0 (0.0%) | 14 (100.0%) |
| 5 to 9 Unit Apartments | 43 (86.0%) | 7 (14.0%) |
| 10 or more Apartments | 35 (26.9%) | 95 (73.1%) |
| Mobile Home / Other | 0 (0.0%) | 0 (0.0%) |
| Total | 3,102 (90.8%) | 314 (9.2%) |
Housing Structures by Number of Rooms in Hillsdale borough
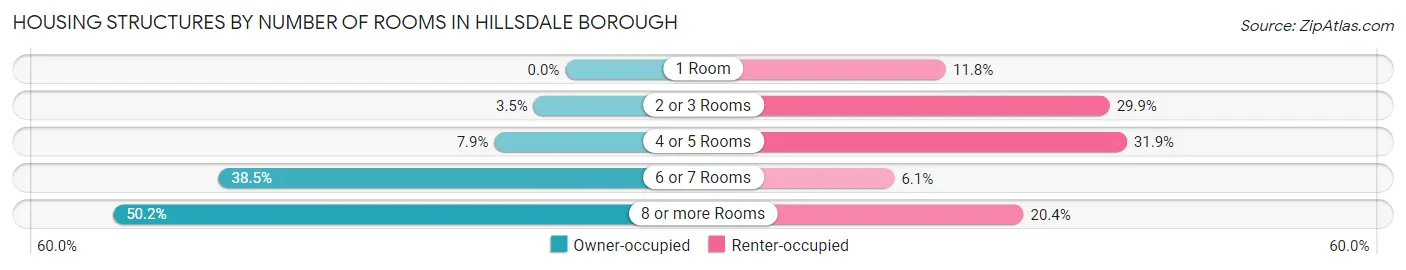
| Number of Rooms | Owner-occupied | Renter-occupied |
| 1 Room | 0 (0.0%) | 37 (11.8%) |
| 2 or 3 Rooms | 109 (3.5%) | 94 (29.9%) |
| 4 or 5 Rooms | 244 (7.9%) | 100 (31.9%) |
| 6 or 7 Rooms | 1,193 (38.5%) | 19 (6.0%) |
| 8 or more Rooms | 1,556 (50.2%) | 64 (20.4%) |
| Total | 3,102 (100.0%) | 314 (100.0%) |
Housing Structure by Heating Type in Hillsdale borough
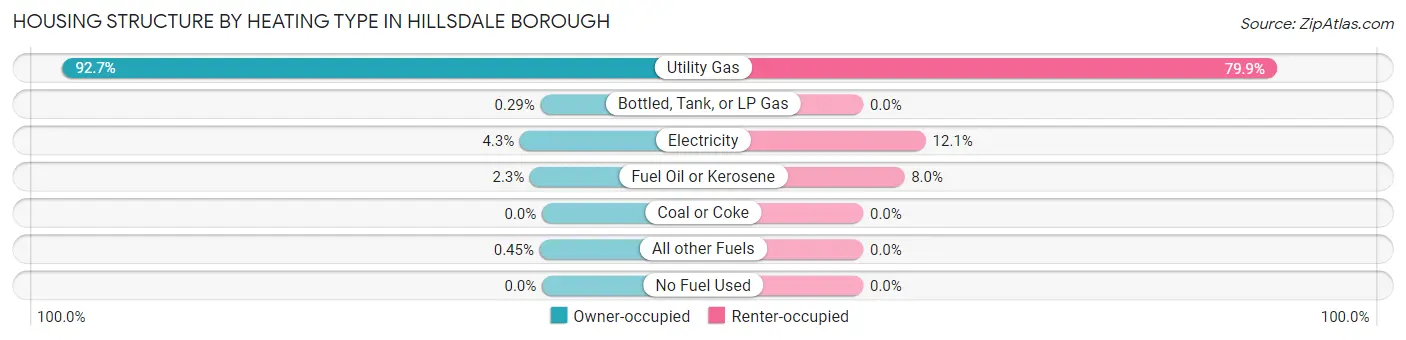
| Heating Type | Owner-occupied | Renter-occupied |
| Utility Gas | 2,875 (92.7%) | 251 (79.9%) |
| Bottled, Tank, or LP Gas | 9 (0.3%) | 0 (0.0%) |
| Electricity | 132 (4.3%) | 38 (12.1%) |
| Fuel Oil or Kerosene | 72 (2.3%) | 25 (8.0%) |
| Coal or Coke | 0 (0.0%) | 0 (0.0%) |
| All other Fuels | 14 (0.4%) | 0 (0.0%) |
| No Fuel Used | 0 (0.0%) | 0 (0.0%) |
| Total | 3,102 (100.0%) | 314 (100.0%) |
Household Vehicle Usage in Hillsdale borough
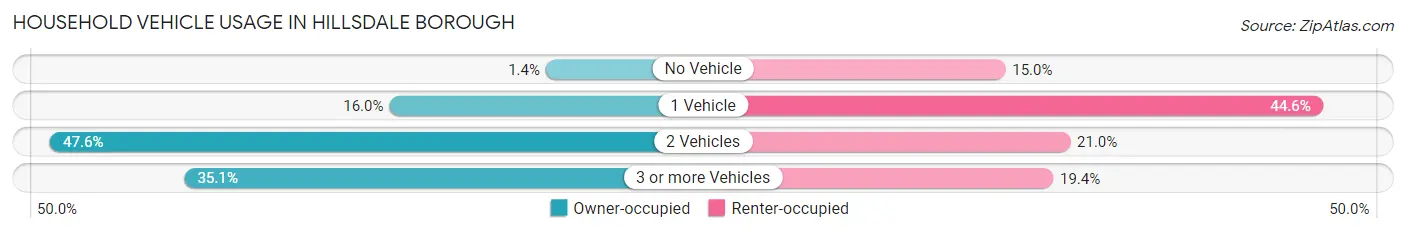
| Vehicles per Household | Owner-occupied | Renter-occupied |
| No Vehicle | 42 (1.3%) | 47 (15.0%) |
| 1 Vehicle | 495 (16.0%) | 140 (44.6%) |
| 2 Vehicles | 1,477 (47.6%) | 66 (21.0%) |
| 3 or more Vehicles | 1,088 (35.1%) | 61 (19.4%) |
| Total | 3,102 (100.0%) | 314 (100.0%) |
Real Estate & Mortgages in Hillsdale borough
Real Estate and Mortgage Overview in Hillsdale borough
| Characteristic | Without Mortgage | With Mortgage |
| Housing Units | 1,013 | 2,089 |
| Median Property Value | $633,800 | $638,000 |
| Median Household Income | $154,391 | $1,378 |
| Monthly Housing Costs | $1,501 | $1,608 |
| Real Estate Taxes | $10,001 | $26 |
Property Value by Mortgage Status in Hillsdale borough
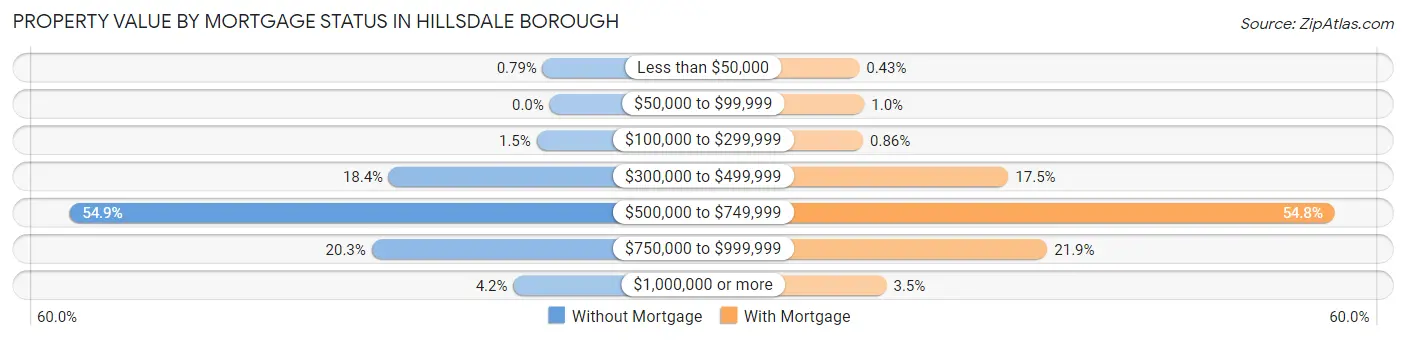
| Property Value | Without Mortgage | With Mortgage |
| Less than $50,000 | 8 (0.8%) | 9 (0.4%) |
| $50,000 to $99,999 | 0 (0.0%) | 21 (1.0%) |
| $100,000 to $299,999 | 15 (1.5%) | 18 (0.9%) |
| $300,000 to $499,999 | 186 (18.4%) | 365 (17.5%) |
| $500,000 to $749,999 | 556 (54.9%) | 1,144 (54.8%) |
| $750,000 to $999,999 | 206 (20.3%) | 458 (21.9%) |
| $1,000,000 or more | 42 (4.2%) | 74 (3.5%) |
| Total | 1,013 (100.0%) | 2,089 (100.0%) |
Household Income by Mortgage Status in Hillsdale borough
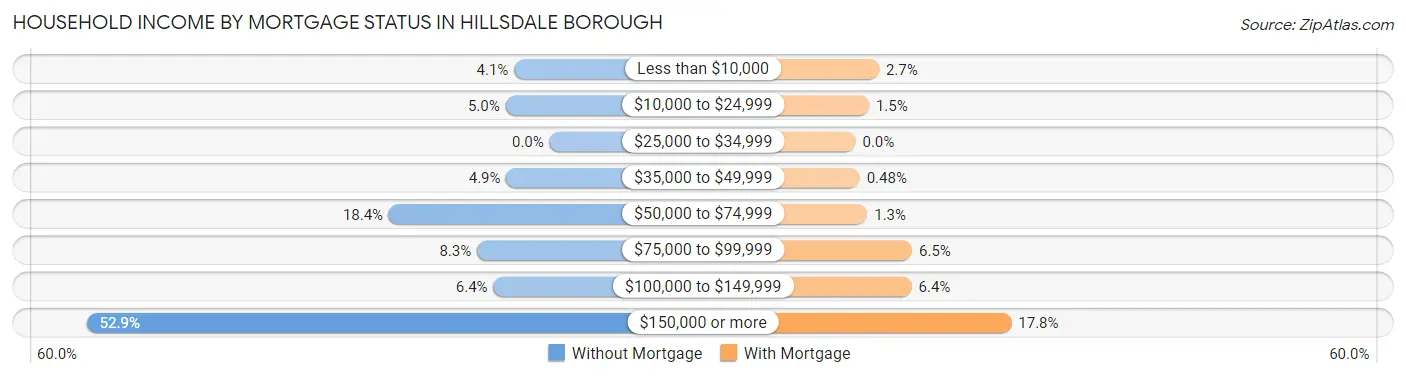
| Household Income | Without Mortgage | With Mortgage |
| Less than $10,000 | 41 (4.1%) | 56 (2.7%) |
| $10,000 to $24,999 | 51 (5.0%) | 32 (1.5%) |
| $25,000 to $34,999 | 0 (0.0%) | 0 (0.0%) |
| $35,000 to $49,999 | 50 (4.9%) | 10 (0.5%) |
| $50,000 to $74,999 | 186 (18.4%) | 28 (1.3%) |
| $75,000 to $99,999 | 84 (8.3%) | 135 (6.5%) |
| $100,000 to $149,999 | 65 (6.4%) | 134 (6.4%) |
| $150,000 or more | 536 (52.9%) | 372 (17.8%) |
| Total | 1,013 (100.0%) | 2,089 (100.0%) |
Property Value to Household Income Ratio in Hillsdale borough
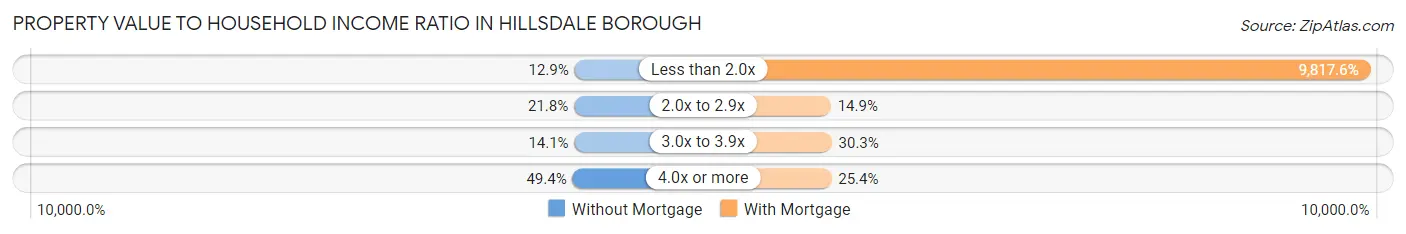
| Value-to-Income Ratio | Without Mortgage | With Mortgage |
| Less than 2.0x | 131 (12.9%) | 205,089 (9,817.6%) |
| 2.0x to 2.9x | 221 (21.8%) | 312 (14.9%) |
| 3.0x to 3.9x | 143 (14.1%) | 632 (30.2%) |
| 4.0x or more | 500 (49.4%) | 531 (25.4%) |
| Total | 1,013 (100.0%) | 2,089 (100.0%) |
Real Estate Taxes by Mortgage Status in Hillsdale borough
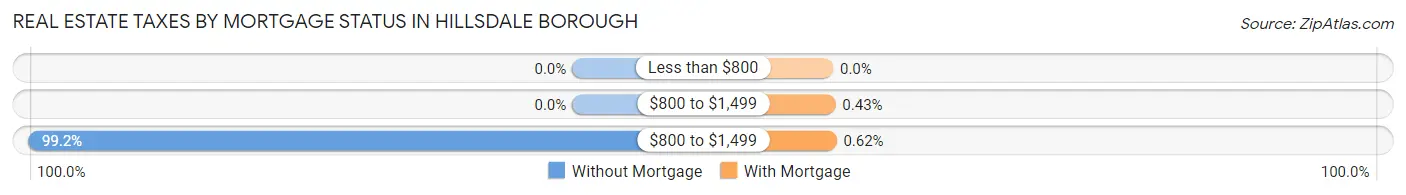
| Property Taxes | Without Mortgage | With Mortgage |
| Less than $800 | 0 (0.0%) | 0 (0.0%) |
| $800 to $1,499 | 0 (0.0%) | 9 (0.4%) |
| $800 to $1,499 | 1,005 (99.2%) | 13 (0.6%) |
| Total | 1,013 (100.0%) | 2,089 (100.0%) |
Health & Disability in Hillsdale borough
Health Insurance Coverage by Age in Hillsdale borough
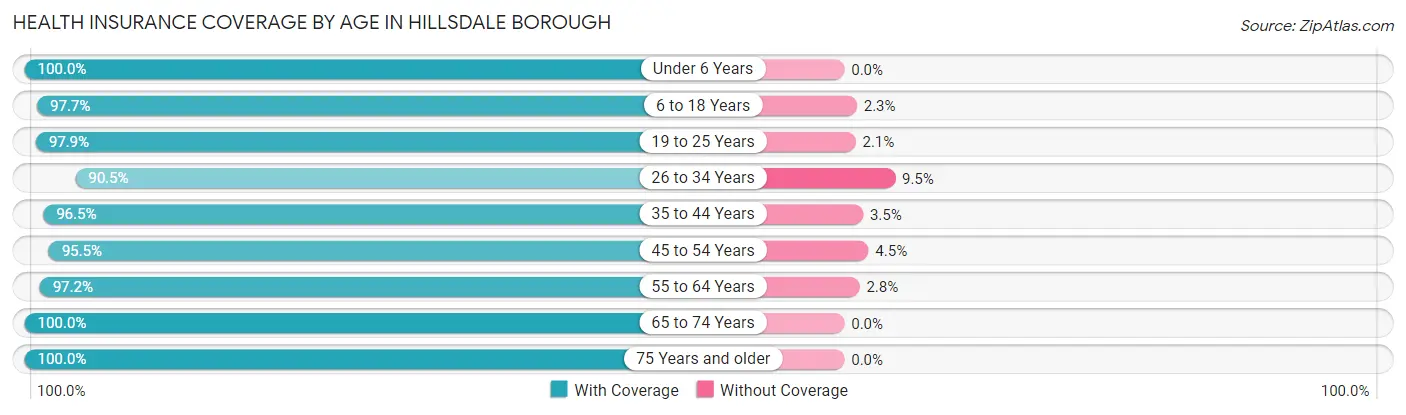
| Age Bracket | With Coverage | Without Coverage |
| Under 6 Years | 695 (100.0%) | 0 (0.0%) |
| 6 to 18 Years | 1,591 (97.7%) | 38 (2.3%) |
| 19 to 25 Years | 980 (97.9%) | 21 (2.1%) |
| 26 to 34 Years | 775 (90.5%) | 81 (9.5%) |
| 35 to 44 Years | 1,332 (96.5%) | 48 (3.5%) |
| 45 to 54 Years | 1,252 (95.5%) | 59 (4.5%) |
| 55 to 64 Years | 1,718 (97.2%) | 50 (2.8%) |
| 65 to 74 Years | 794 (100.0%) | 0 (0.0%) |
| 75 Years and older | 691 (100.0%) | 0 (0.0%) |
| Total | 9,828 (97.1%) | 297 (2.9%) |
Health Insurance Coverage by Citizenship Status in Hillsdale borough
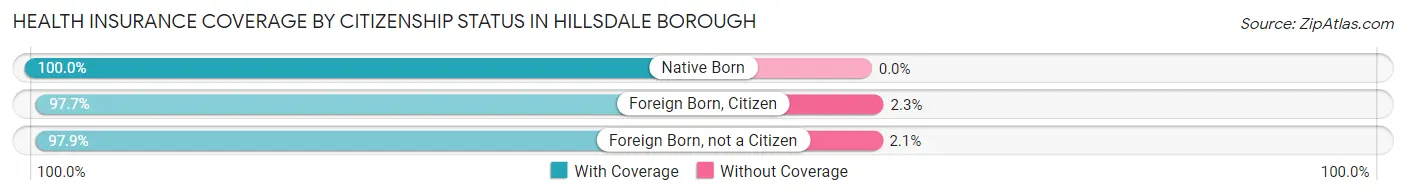
| Citizenship Status | With Coverage | Without Coverage |
| Native Born | 695 (100.0%) | 0 (0.0%) |
| Foreign Born, Citizen | 1,591 (97.7%) | 38 (2.3%) |
| Foreign Born, not a Citizen | 980 (97.9%) | 21 (2.1%) |
Health Insurance Coverage by Household Income in Hillsdale borough
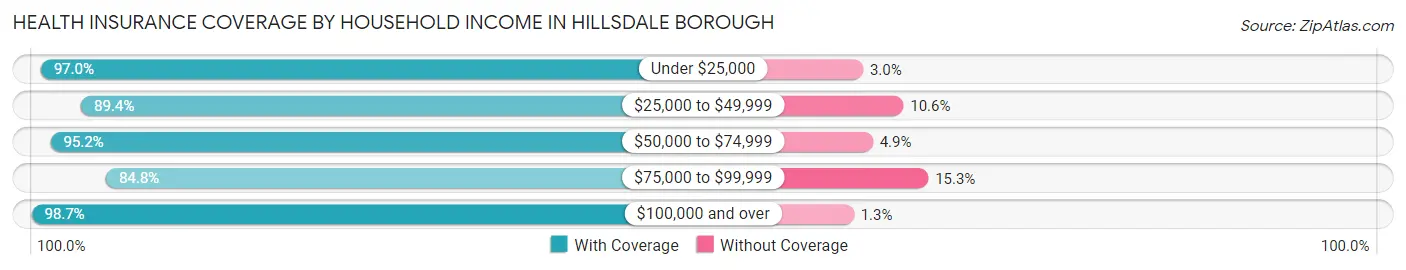
| Household Income | With Coverage | Without Coverage |
| Under $25,000 | 256 (97.0%) | 8 (3.0%) |
| $25,000 to $49,999 | 245 (89.4%) | 29 (10.6%) |
| $50,000 to $74,999 | 844 (95.2%) | 43 (4.9%) |
| $75,000 to $99,999 | 639 (84.8%) | 115 (15.2%) |
| $100,000 and over | 7,800 (98.7%) | 102 (1.3%) |
Public vs Private Health Insurance Coverage by Age in Hillsdale borough
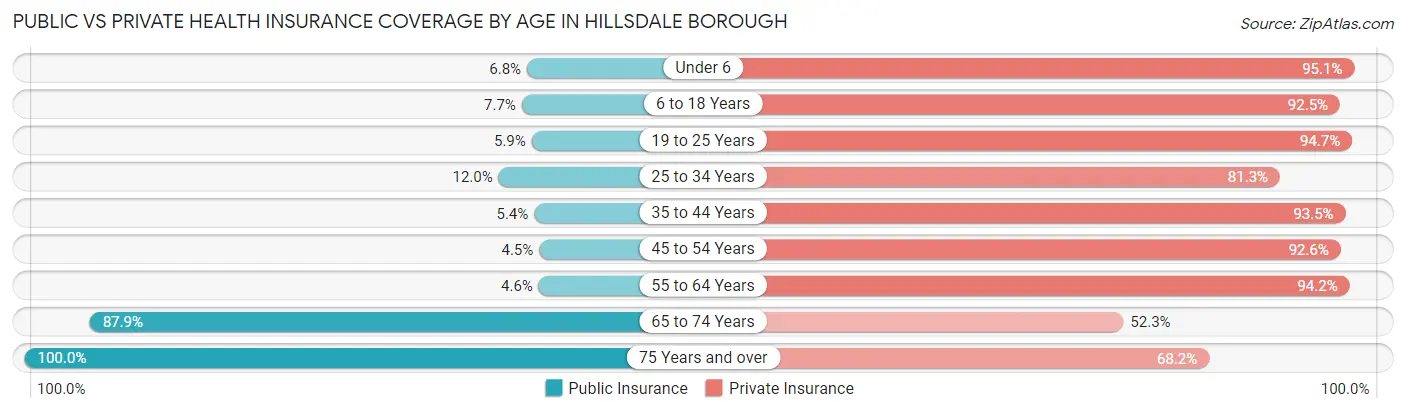
| Age Bracket | Public Insurance | Private Insurance |
| Under 6 | 47 (6.8%) | 661 (95.1%) |
| 6 to 18 Years | 126 (7.7%) | 1,506 (92.4%) |
| 19 to 25 Years | 59 (5.9%) | 948 (94.7%) |
| 25 to 34 Years | 103 (12.0%) | 696 (81.3%) |
| 35 to 44 Years | 75 (5.4%) | 1,290 (93.5%) |
| 45 to 54 Years | 59 (4.5%) | 1,214 (92.6%) |
| 55 to 64 Years | 81 (4.6%) | 1,666 (94.2%) |
| 65 to 74 Years | 698 (87.9%) | 415 (52.3%) |
| 75 Years and over | 691 (100.0%) | 471 (68.2%) |
| Total | 1,939 (19.2%) | 8,867 (87.6%) |
Disability Status by Sex by Age in Hillsdale borough
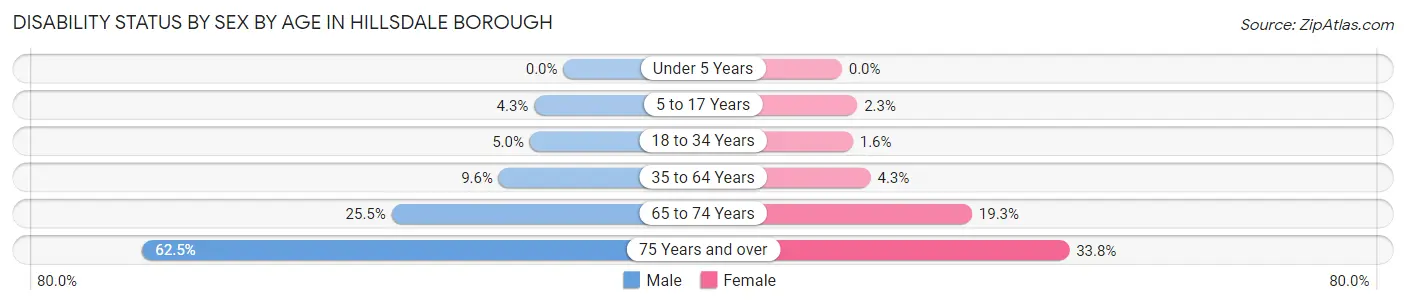
| Age Bracket | Male | Female |
| Under 5 Years | 0 (0.0%) | 0 (0.0%) |
| 5 to 17 Years | 34 (4.3%) | 18 (2.3%) |
| 18 to 34 Years | 42 (5.0%) | 20 (1.6%) |
| 35 to 64 Years | 203 (9.6%) | 100 (4.3%) |
| 65 to 74 Years | 114 (25.5%) | 67 (19.3%) |
| 75 Years and over | 145 (62.5%) | 155 (33.8%) |
Disability Class by Sex by Age in Hillsdale borough
Disability Class: Hearing Difficulty
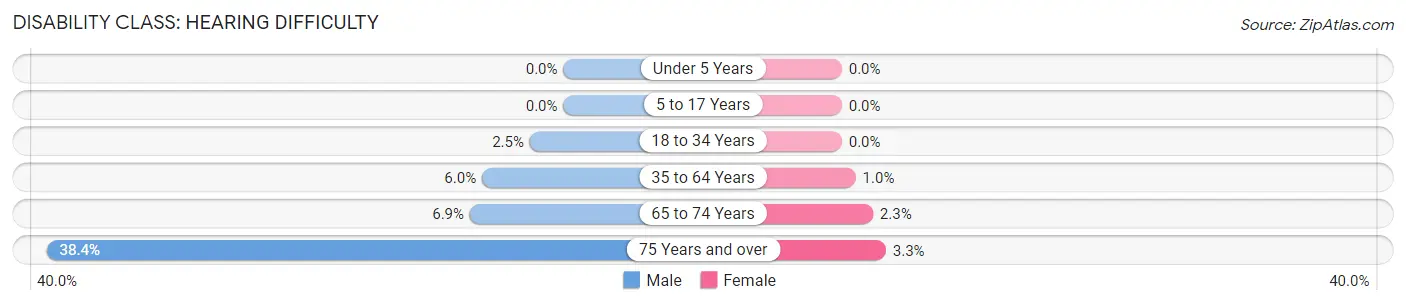
| Age Bracket | Male | Female |
| Under 5 Years | 0 (0.0%) | 0 (0.0%) |
| 5 to 17 Years | 0 (0.0%) | 0 (0.0%) |
| 18 to 34 Years | 21 (2.5%) | 0 (0.0%) |
| 35 to 64 Years | 128 (6.0%) | 24 (1.0%) |
| 65 to 74 Years | 31 (6.9%) | 8 (2.3%) |
| 75 Years and over | 89 (38.4%) | 15 (3.3%) |
Disability Class: Vision Difficulty
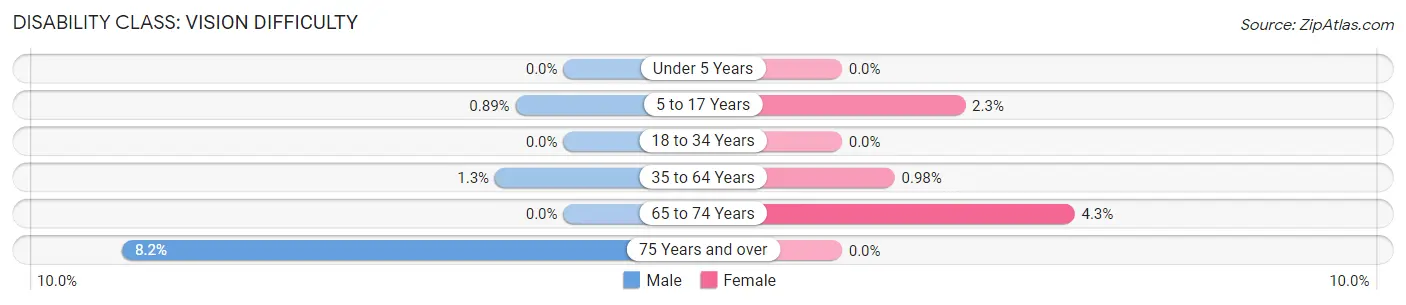
| Age Bracket | Male | Female |
| Under 5 Years | 0 (0.0%) | 0 (0.0%) |
| 5 to 17 Years | 7 (0.9%) | 18 (2.3%) |
| 18 to 34 Years | 0 (0.0%) | 0 (0.0%) |
| 35 to 64 Years | 27 (1.3%) | 23 (1.0%) |
| 65 to 74 Years | 0 (0.0%) | 15 (4.3%) |
| 75 Years and over | 19 (8.2%) | 0 (0.0%) |
Disability Class: Cognitive Difficulty
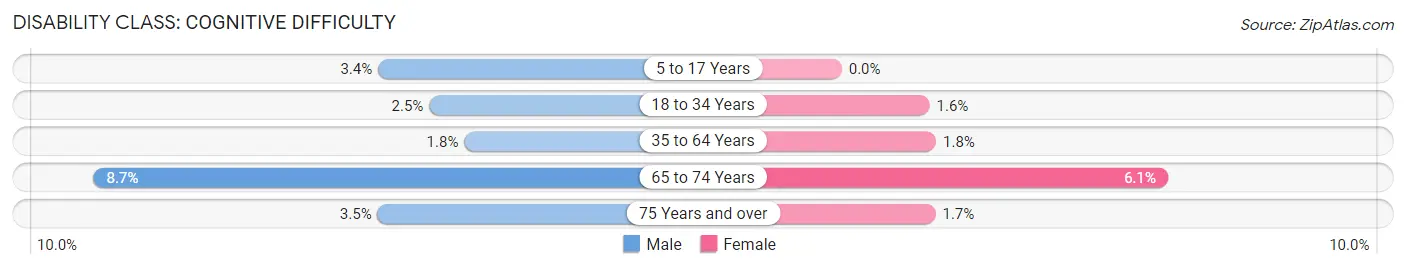
| Age Bracket | Male | Female |
| 5 to 17 Years | 27 (3.4%) | 0 (0.0%) |
| 18 to 34 Years | 21 (2.5%) | 20 (1.6%) |
| 35 to 64 Years | 39 (1.8%) | 41 (1.8%) |
| 65 to 74 Years | 39 (8.7%) | 21 (6.0%) |
| 75 Years and over | 8 (3.5%) | 8 (1.7%) |
Disability Class: Ambulatory Difficulty
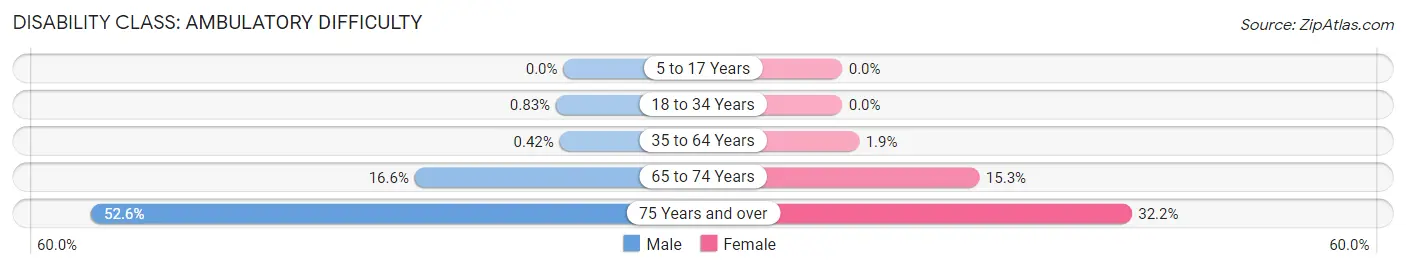
| Age Bracket | Male | Female |
| 5 to 17 Years | 0 (0.0%) | 0 (0.0%) |
| 18 to 34 Years | 7 (0.8%) | 0 (0.0%) |
| 35 to 64 Years | 9 (0.4%) | 44 (1.9%) |
| 65 to 74 Years | 74 (16.6%) | 53 (15.3%) |
| 75 Years and over | 122 (52.6%) | 148 (32.2%) |
Disability Class: Self-Care Difficulty
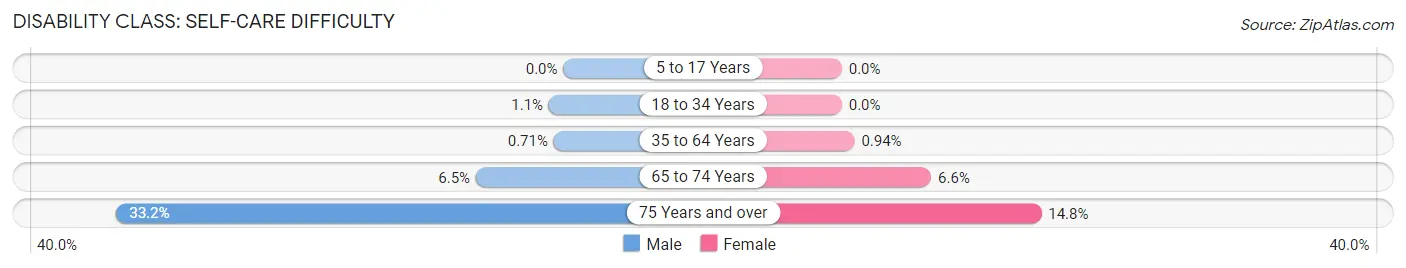
| Age Bracket | Male | Female |
| 5 to 17 Years | 0 (0.0%) | 0 (0.0%) |
| 18 to 34 Years | 9 (1.1%) | 0 (0.0%) |
| 35 to 64 Years | 15 (0.7%) | 22 (0.9%) |
| 65 to 74 Years | 29 (6.5%) | 23 (6.6%) |
| 75 Years and over | 77 (33.2%) | 68 (14.8%) |
Technology Access in Hillsdale borough
Computing Device Access in Hillsdale borough
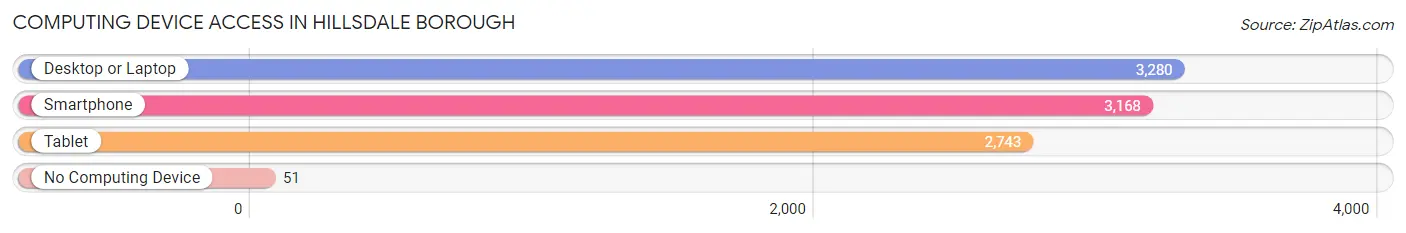
| Device Type | # Households | % Households |
| Desktop or Laptop | 3,280 | 96.0% |
| Smartphone | 3,168 | 92.7% |
| Tablet | 2,743 | 80.3% |
| No Computing Device | 51 | 1.5% |
| Total | 3,416 | 100.0% |
Internet Access in Hillsdale borough
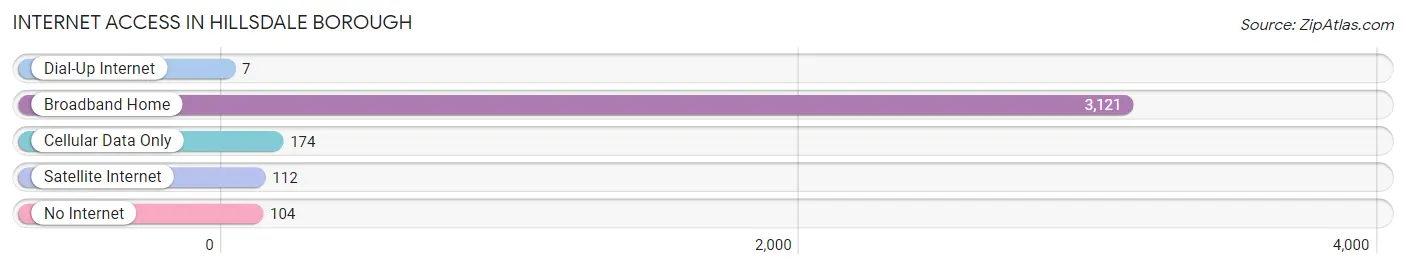
| Internet Type | # Households | % Households |
| Dial-Up Internet | 7 | 0.2% |
| Broadband Home | 3,121 | 91.4% |
| Cellular Data Only | 174 | 5.1% |
| Satellite Internet | 112 | 3.3% |
| No Internet | 104 | 3.0% |
| Total | 3,416 | 100.0% |
Hillsdale borough Summary
Hillsdale Borough is a small borough located in Bergen County, New Jersey. It is situated in the northeastern part of the state, just west of the Hudson River. The borough is bordered by the towns of Westwood, Washington Township, and River Vale. As of the 2010 United States Census, the borough had a total population of 8,305.
History
Hillsdale Borough was originally part of the larger Hillsdale Township, which was established in 1775. The township was divided into two parts in 1894, with the northern part becoming Hillsdale Borough. The borough was officially incorporated in 1898.
The area was originally inhabited by the Lenni Lenape Native Americans. The first European settlers arrived in the area in the late 17th century. The area was primarily used for farming and was known as the “Hillsdale Farms”. The area was also home to several mills, which were used to process grain and lumber.
Geography
Hillsdale Borough is located at 40°57'45" North, 74°02'45" West (40.9625, -74.0458). The borough has a total area of 2.2 square miles, all of which is land. The borough is located in the Pascack Valley region of Bergen County.
The borough is located in a hilly area, with elevations ranging from 200 to 500 feet above sea level. The borough is located in the Hackensack River watershed and is home to several small streams, including the Pascack Brook and the Ho-Ho-Kus Brook.
Economy
Hillsdale Borough has a diverse economy, with a mix of retail, manufacturing, and service businesses. The borough is home to several small businesses, including restaurants, shops, and professional services. The borough is also home to several large employers, including the Hillsdale Shopping Center, which is the largest shopping center in the borough.
The borough is also home to several industrial parks, which are home to a variety of manufacturing and service businesses. The borough is also home to several corporate headquarters, including the headquarters of the Bergen County Board of Education.
Demographics
As of the 2010 United States Census, there were 8,305 people, 3,093 households, and 2,092 families residing in the borough. The population density was 3,741.3 people per square mile. The racial makeup of the borough was 87.2% White, 4.2% African American, 0.2% Native American, 5.2% Asian, 0.1% Pacific Islander, 1.3% from other races, and 1.9% from two or more races. Hispanic or Latino of any race were 6.7% of the population.
The median income for a household in the borough was $87,917, and the median income for a family was $103,917. Males had a median income of $71,917 versus $50,917 for females. The per capita income for the borough was $41,917. About 2.3% of families and 3.7% of the population were below the poverty line, including 4.2% of those under age 18 and 4.2% of those age 65 or over.
Conclusion
Hillsdale Borough is a small borough located in Bergen County, New Jersey. It is situated in the northeastern part of the state, just west of the Hudson River. The borough has a diverse economy, with a mix of retail, manufacturing, and service businesses. As of the 2010 United States Census, the borough had a total population of 8,305. The median income for a household in the borough was $87,917, and the median income for a family was $103,917. The borough is located in a hilly area, with elevations ranging from 200 to 500 feet above sea level. The borough is located in the Hackensack River watershed and is home to several small streams, including the Pascack Brook and the Ho-Ho-Kus Brook.
Common Questions
What is Per Capita Income in Hillsdale borough?
Per Capita income in Hillsdale borough is $66,663.
What is the Median Family Income in Hillsdale borough?
Median Family Income in Hillsdale borough is $198,176.
What is the Median Household income in Hillsdale borough?
Median Household Income in Hillsdale borough is $175,802.
What is Income or Wage Gap in Hillsdale borough?
Income or Wage Gap in Hillsdale borough is 34.9%.
Women in Hillsdale borough earn 65.1 cents for every dollar earned by a man.
What is Inequality or Gini Index in Hillsdale borough?
Inequality or Gini Index in Hillsdale borough is 0.39.
What is the Total Population of Hillsdale borough?
Total Population of Hillsdale borough is 10,125.
What is the Total Male Population of Hillsdale borough?
Total Male Population of Hillsdale borough is 4,651.
What is the Total Female Population of Hillsdale borough?
Total Female Population of Hillsdale borough is 5,474.
What is the Ratio of Males per 100 Females in Hillsdale borough?
There are 84.97 Males per 100 Females in Hillsdale borough.
What is the Ratio of Females per 100 Males in Hillsdale borough?
There are 117.70 Females per 100 Males in Hillsdale borough.
What is the Median Population Age in Hillsdale borough?
Median Population Age in Hillsdale borough is 42.2 Years.
What is the Average Family Size in Hillsdale borough
Average Family Size in Hillsdale borough is 3.3 People.
What is the Average Household Size in Hillsdale borough
Average Household Size in Hillsdale borough is 3.0 People.
How Large is the Labor Force in Hillsdale borough?
There are 5,993 People in the Labor Forcein in Hillsdale borough.
What is the Percentage of People in the Labor Force in Hillsdale borough?
71.9% of People are in the Labor Force in Hillsdale borough.
What is the Unemployment Rate in Hillsdale borough?
Unemployment Rate in Hillsdale borough is 2.9%.