Rockleigh borough, NJ Map & Demographics
Rockleigh borough Overview
$61,123
PER CAPITA INCOME
$226,250
AVG FAMILY INCOME
$206,250
AVG HOUSEHOLD INCOME
55.4%
WAGE / INCOME GAP [ % ]
44.6¢/ $1
WAGE / INCOME GAP [ $ ]
0.55
INEQUALITY / GINI INDEX
567
TOTAL POPULATION
206
MALE POPULATION
361
FEMALE POPULATION
57.06
MALES / 100 FEMALES
175.24
FEMALES / 100 MALES
68.5
MEDIAN AGE
3.3
AVG FAMILY SIZE
3.4
AVG HOUSEHOLD SIZE
121
LABOR FORCE [ PEOPLE ]
23.2%
PERCENT IN LABOR FORCE
0.8%
UNEMPLOYMENT RATE
Income in Rockleigh borough
Income Overview in Rockleigh borough
Per Capita Income in Rockleigh borough is $61,123, while median incomes of families and households are $226,250 and $206,250 respectively.
| Characteristic | Number | Measure |
| Per Capita Income | 567 | $61,123 |
| Median Family Income | 68 | $226,250 |
| Mean Family Income | 68 | $416,431 |
| Median Household Income | 78 | $206,250 |
| Mean Household Income | 78 | $388,845 |
| Income Deficit | 68 | $0 |
| Wage / Income Gap (%) | 567 | 55.42% |
| Wage / Income Gap ($) | 567 | 44.58¢ per $1 |
| Gini / Inequality Index | 567 | 0.55 |
Earnings by Sex in Rockleigh borough
Average Earnings in Rockleigh borough are $58,571, $101,875 for men and $45,417 for women, a difference of 55.4%.
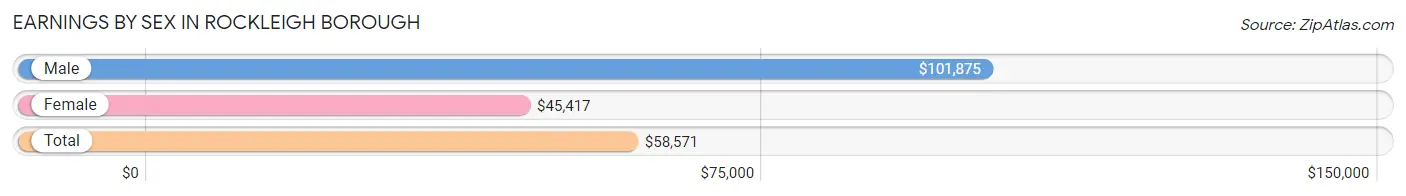
| Sex | Number | Average Earnings |
| Male | 81 (56.2%) | $101,875 |
| Female | 63 (43.8%) | $45,417 |
| Total | 144 (100.0%) | $58,571 |
Earnings by Sex by Income Bracket in Rockleigh borough
The most common earnings brackets in Rockleigh borough are $100,000+ for men (42 | 51.8%) and $100,000+ for women (11 | 17.5%).
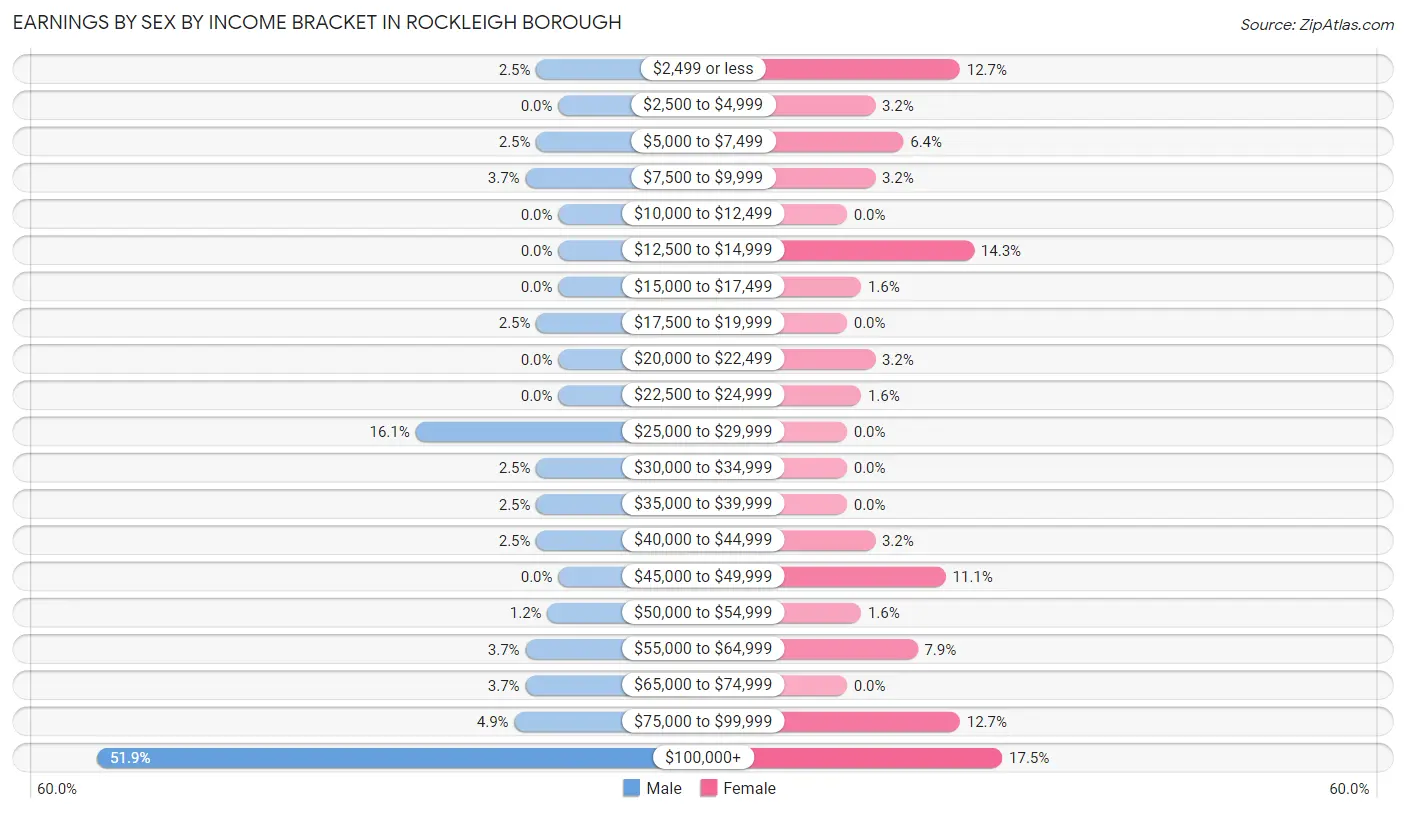
| Income | Male | Female |
| $2,499 or less | 2 (2.5%) | 8 (12.7%) |
| $2,500 to $4,999 | 0 (0.0%) | 2 (3.2%) |
| $5,000 to $7,499 | 2 (2.5%) | 4 (6.4%) |
| $7,500 to $9,999 | 3 (3.7%) | 2 (3.2%) |
| $10,000 to $12,499 | 0 (0.0%) | 0 (0.0%) |
| $12,500 to $14,999 | 0 (0.0%) | 9 (14.3%) |
| $15,000 to $17,499 | 0 (0.0%) | 1 (1.6%) |
| $17,500 to $19,999 | 2 (2.5%) | 0 (0.0%) |
| $20,000 to $22,499 | 0 (0.0%) | 2 (3.2%) |
| $22,500 to $24,999 | 0 (0.0%) | 1 (1.6%) |
| $25,000 to $29,999 | 13 (16.1%) | 0 (0.0%) |
| $30,000 to $34,999 | 2 (2.5%) | 0 (0.0%) |
| $35,000 to $39,999 | 2 (2.5%) | 0 (0.0%) |
| $40,000 to $44,999 | 2 (2.5%) | 2 (3.2%) |
| $45,000 to $49,999 | 0 (0.0%) | 7 (11.1%) |
| $50,000 to $54,999 | 1 (1.2%) | 1 (1.6%) |
| $55,000 to $64,999 | 3 (3.7%) | 5 (7.9%) |
| $65,000 to $74,999 | 3 (3.7%) | 0 (0.0%) |
| $75,000 to $99,999 | 4 (4.9%) | 8 (12.7%) |
| $100,000+ | 42 (51.8%) | 11 (17.5%) |
| Total | 81 (100.0%) | 63 (100.0%) |
Earnings by Sex by Educational Attainment in Rockleigh borough
Average earnings in Rockleigh borough are $103,750 for men and $47,813 for women, a difference of 53.9%. Men with an educational attainment of bachelor's degree enjoy the highest average annual earnings of $250,001, while those with college or associate's degree education earn the least with $68,333. Women with an educational attainment of graduate degree earn the most with the average annual earnings of $80,750, while those with graduate degree education have the smallest earnings of $80,750.
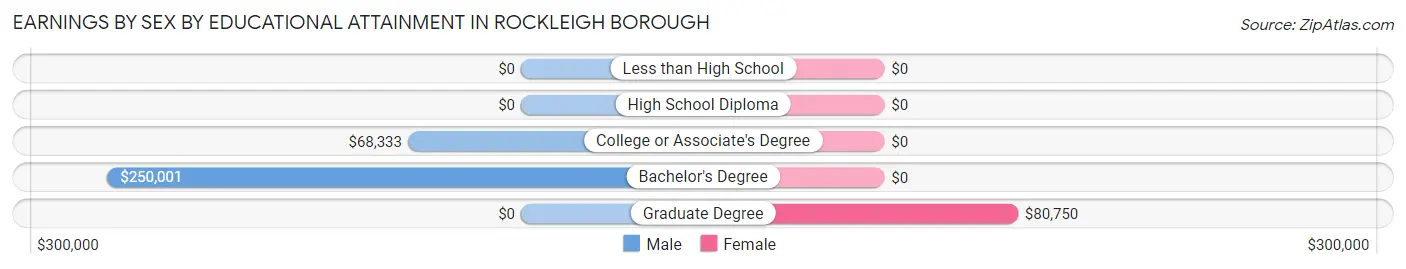
| Educational Attainment | Male Income | Female Income |
| Less than High School | - | - |
| High School Diploma | - | - |
| College or Associate's Degree | $68,333 | $0 |
| Bachelor's Degree | $250,001 | $0 |
| Graduate Degree | - | - |
| Total | $103,750 | $47,813 |
Family Income in Rockleigh borough
Family Income Brackets in Rockleigh borough
According to the Rockleigh borough family income data, there are 37 families falling into the $200,000+ income range, which is the most common income bracket and makes up 54.4% of all families.
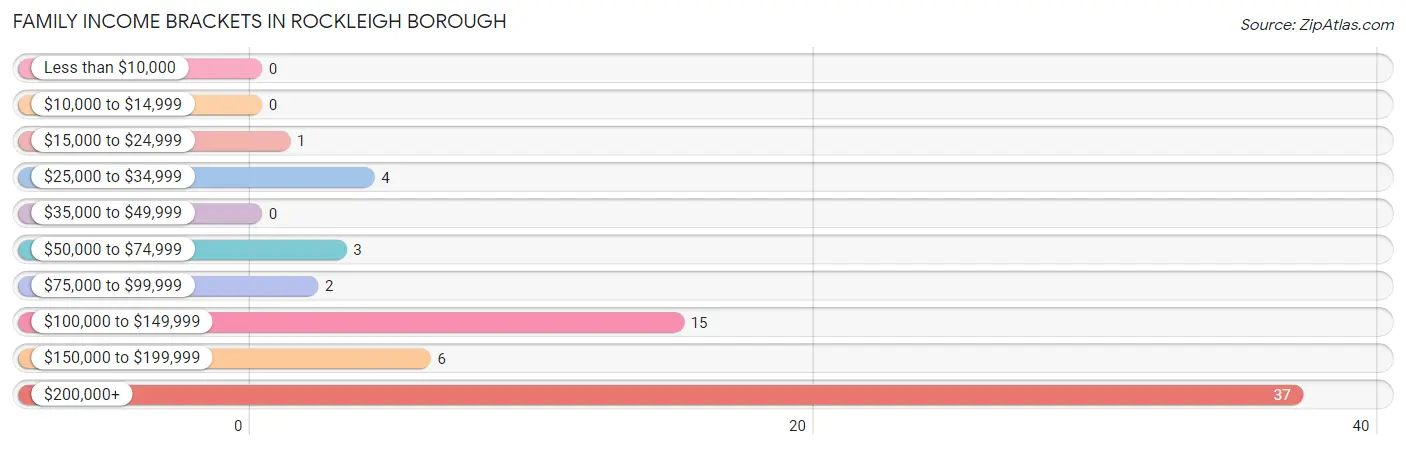
| Income Bracket | # Families | % Families |
| Less than $10,000 | 0 | 0.0% |
| $10,000 to $14,999 | 0 | 0.0% |
| $15,000 to $24,999 | 1 | 1.5% |
| $25,000 to $34,999 | 4 | 5.9% |
| $35,000 to $49,999 | 0 | 0.0% |
| $50,000 to $74,999 | 3 | 4.4% |
| $75,000 to $99,999 | 2 | 2.9% |
| $100,000 to $149,999 | 15 | 22.1% |
| $150,000 to $199,999 | 6 | 8.8% |
| $200,000+ | 37 | 54.4% |
Family Income by Famaliy Size in Rockleigh borough
4-person families (18 | 26.5%) account for the highest median family income in Rockleigh borough with $250,001 per family, while 2-person families (29 | 42.6%) have the highest median income of $70,312 per family member.
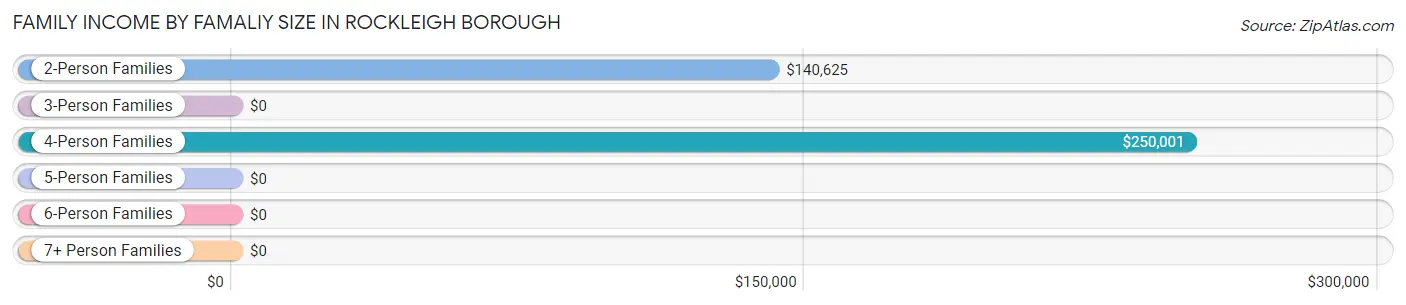
| Income Bracket | # Families | Median Income |
| 2-Person Families | 29 (42.6%) | $140,625 |
| 3-Person Families | 14 (20.6%) | $0 |
| 4-Person Families | 18 (26.5%) | $250,001 |
| 5-Person Families | 4 (5.9%) | $0 |
| 6-Person Families | 2 (2.9%) | $0 |
| 7+ Person Families | 1 (1.5%) | $0 |
| Total | 68 (100.0%) | $226,250 |
Family Income by Number of Earners in Rockleigh borough
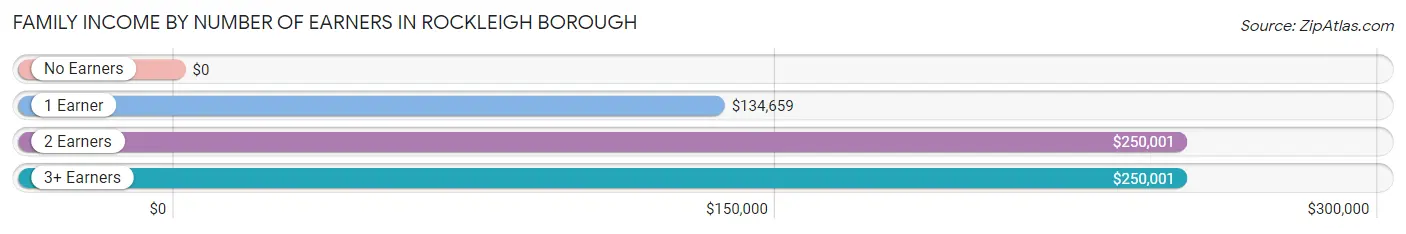
| Number of Earners | # Families | Median Income |
| No Earners | 8 (11.8%) | $0 |
| 1 Earner | 29 (42.6%) | $134,659 |
| 2 Earners | 23 (33.8%) | $250,001 |
| 3+ Earners | 8 (11.8%) | $250,001 |
| Total | 68 (100.0%) | $226,250 |
Household Income in Rockleigh borough
Household Income Brackets in Rockleigh borough
With 39 households falling in the category, the $200,000+ income range is the most frequent in Rockleigh borough, accounting for 50.0% of all households.
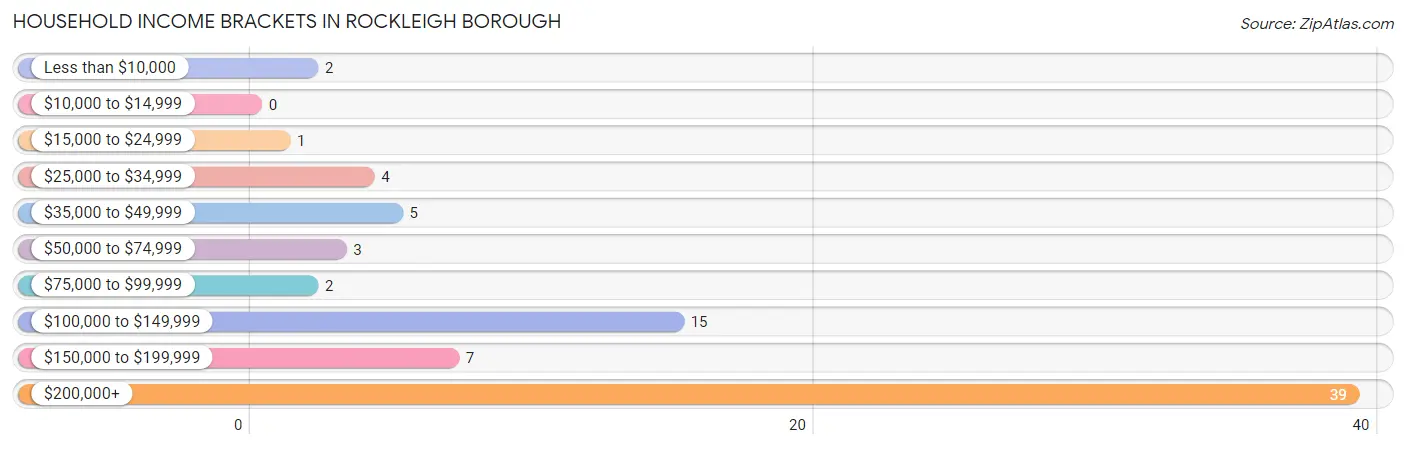
| Income Bracket | # Households | % Households |
| Less than $10,000 | 2 | 2.6% |
| $10,000 to $14,999 | 0 | 0.0% |
| $15,000 to $24,999 | 1 | 1.3% |
| $25,000 to $34,999 | 4 | 5.1% |
| $35,000 to $49,999 | 5 | 6.4% |
| $50,000 to $74,999 | 3 | 3.8% |
| $75,000 to $99,999 | 2 | 2.6% |
| $100,000 to $149,999 | 15 | 19.2% |
| $150,000 to $199,999 | 7 | 9.0% |
| $200,000+ | 39 | 50.0% |
Household Income by Householder Age in Rockleigh borough
The median household income in Rockleigh borough is $206,250, with the highest median household income of $250,001 found in the 45 to 64 years age bracket for the primary householder. A total of 35 households (44.9%) fall into this category. Meanwhile, the 15 to 24 years age bracket for the primary householder has the lowest median household income of $0, with 4 households (5.1%) in this group.
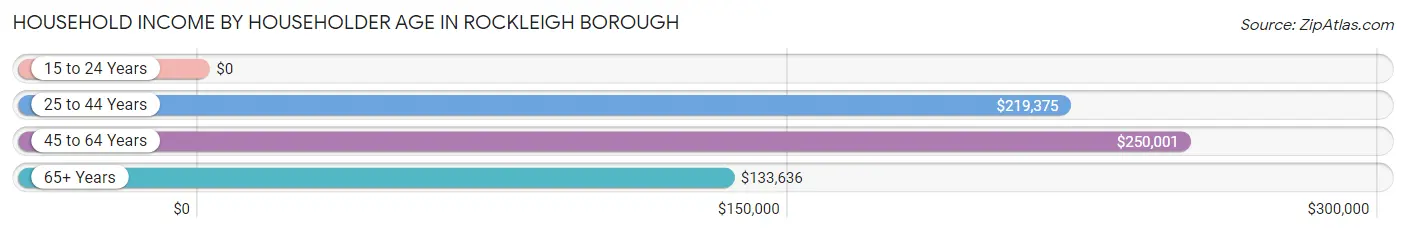
| Income Bracket | # Households | Median Income |
| 15 to 24 Years | 4 (5.1%) | $0 |
| 25 to 44 Years | 5 (6.4%) | $219,375 |
| 45 to 64 Years | 35 (44.9%) | $250,001 |
| 65+ Years | 34 (43.6%) | $133,636 |
| Total | 78 (100.0%) | $206,250 |
Poverty in Rockleigh borough
Income Below Poverty by Sex and Age in Rockleigh borough
With 9.8% poverty level for males and 13.3% for females among the residents of Rockleigh borough, 35 to 44 year old males and 35 to 44 year old females are the most vulnerable to poverty, with 8 males (50.0%) and 2 females (25.0%) in their respective age groups living below the poverty level.
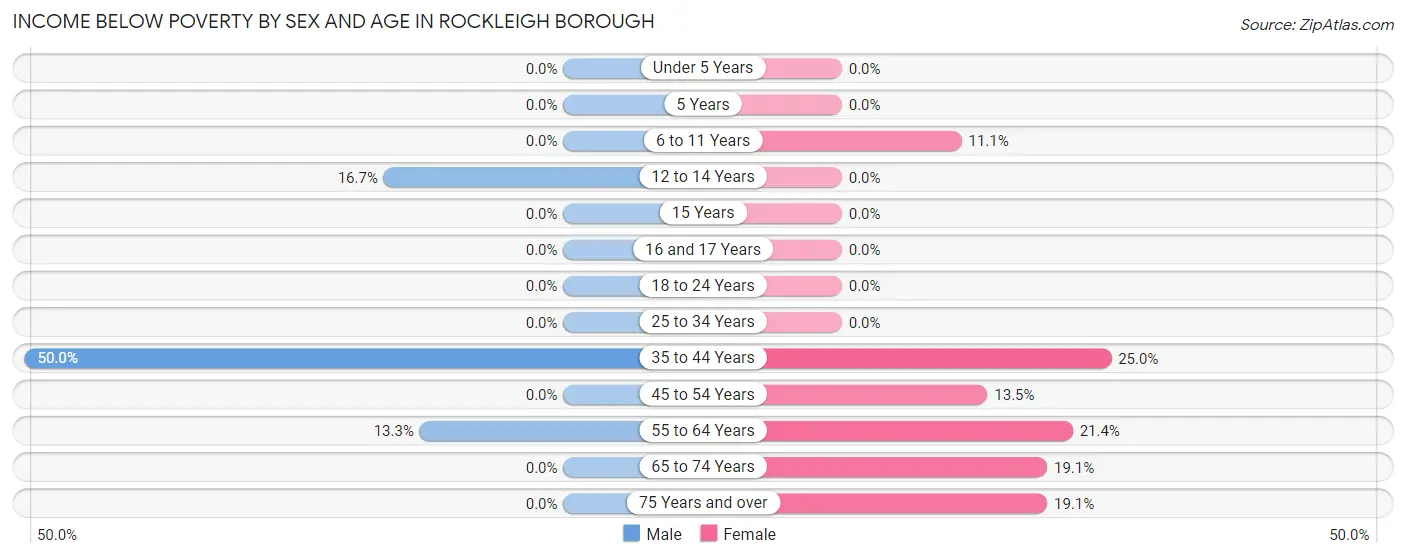
| Age Bracket | Male | Female |
| Under 5 Years | 0 (0.0%) | 0 (0.0%) |
| 5 Years | 0 (0.0%) | 0 (0.0%) |
| 6 to 11 Years | 0 (0.0%) | 1 (11.1%) |
| 12 to 14 Years | 2 (16.7%) | 0 (0.0%) |
| 15 Years | 0 (0.0%) | 0 (0.0%) |
| 16 and 17 Years | 0 (0.0%) | 0 (0.0%) |
| 18 to 24 Years | 0 (0.0%) | 0 (0.0%) |
| 25 to 34 Years | 0 (0.0%) | 0 (0.0%) |
| 35 to 44 Years | 8 (50.0%) | 2 (25.0%) |
| 45 to 54 Years | 0 (0.0%) | 5 (13.5%) |
| 55 to 64 Years | 4 (13.3%) | 6 (21.4%) |
| 65 to 74 Years | 0 (0.0%) | 4 (19.1%) |
| 75 Years and over | 0 (0.0%) | 4 (19.1%) |
| Total | 14 (9.8%) | 22 (13.3%) |
Income Above Poverty by Sex and Age in Rockleigh borough
According to the poverty statistics in Rockleigh borough, males aged under 5 years and females aged under 5 years are the age groups that are most secure financially, with 100.0% of males and 100.0% of females in these age groups living above the poverty line.
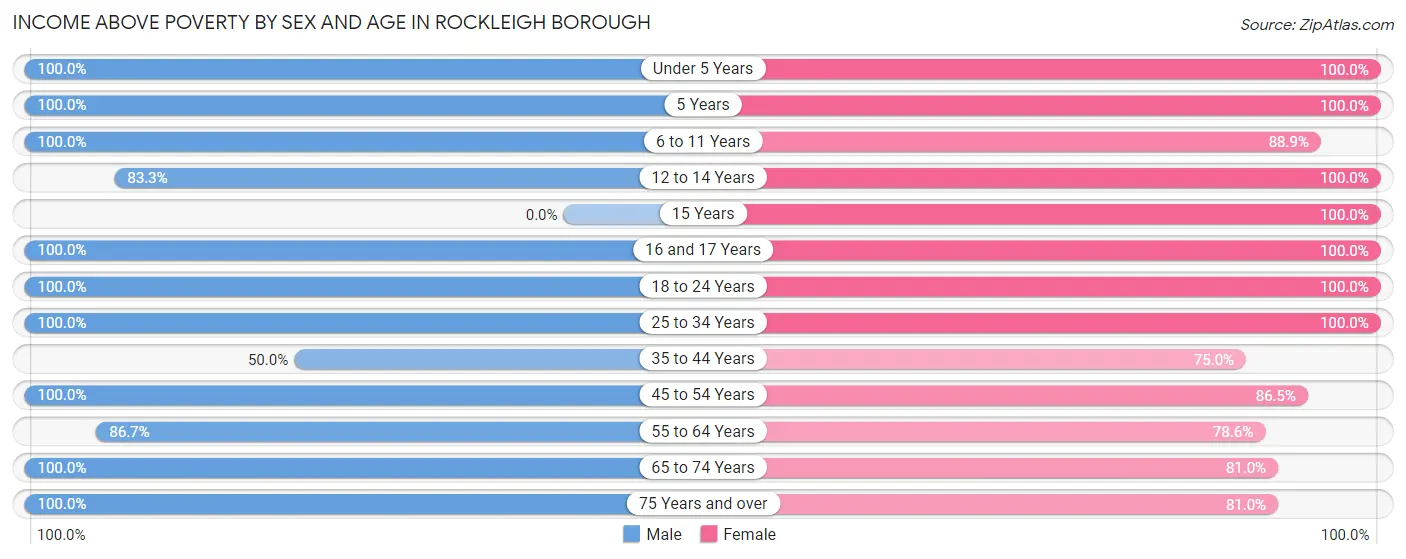
| Age Bracket | Male | Female |
| Under 5 Years | 2 (100.0%) | 1 (100.0%) |
| 5 Years | 1 (100.0%) | 4 (100.0%) |
| 6 to 11 Years | 4 (100.0%) | 8 (88.9%) |
| 12 to 14 Years | 10 (83.3%) | 2 (100.0%) |
| 15 Years | 0 (0.0%) | 6 (100.0%) |
| 16 and 17 Years | 3 (100.0%) | 11 (100.0%) |
| 18 to 24 Years | 14 (100.0%) | 8 (100.0%) |
| 25 to 34 Years | 8 (100.0%) | 9 (100.0%) |
| 35 to 44 Years | 8 (50.0%) | 6 (75.0%) |
| 45 to 54 Years | 23 (100.0%) | 32 (86.5%) |
| 55 to 64 Years | 26 (86.7%) | 22 (78.6%) |
| 65 to 74 Years | 20 (100.0%) | 17 (80.9%) |
| 75 Years and over | 10 (100.0%) | 17 (80.9%) |
| Total | 129 (90.2%) | 143 (86.7%) |
Income Below Poverty Among Married-Couple Families in Rockleigh borough
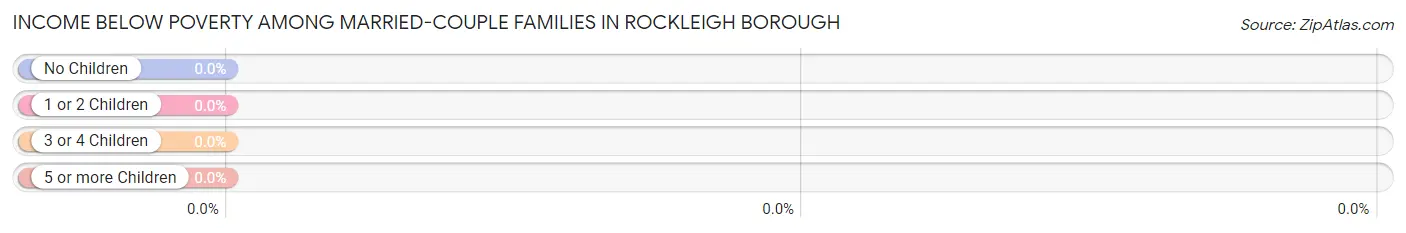
| Children | Above Poverty | Below Poverty |
| No Children | 34 (100.0%) | 0 (0.0%) |
| 1 or 2 Children | 21 (100.0%) | 0 (0.0%) |
| 3 or 4 Children | 3 (100.0%) | 0 (0.0%) |
| 5 or more Children | 0 (0.0%) | 0 (0.0%) |
| Total | 58 (100.0%) | 0 (0.0%) |
Income Below Poverty Among Single-Parent Households in Rockleigh borough
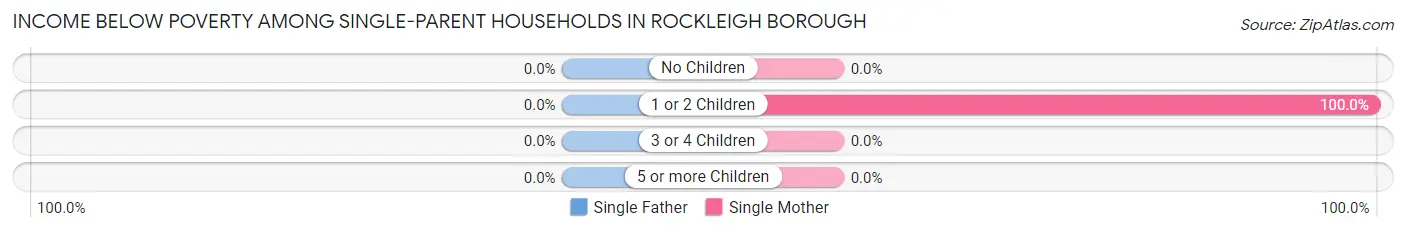
| Children | Single Father | Single Mother |
| No Children | 0 (0.0%) | 0 (0.0%) |
| 1 or 2 Children | 0 (0.0%) | 1 (100.0%) |
| 3 or 4 Children | 0 (0.0%) | 0 (0.0%) |
| 5 or more Children | 0 (0.0%) | 0 (0.0%) |
| Total | 0 (0.0%) | 1 (16.7%) |
Income Below Poverty Among Married-Couple vs Single-Parent Households in Rockleigh borough
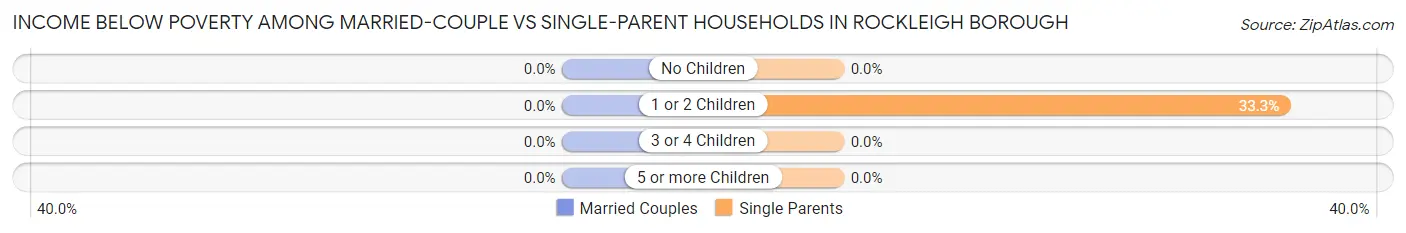
| Children | Married-Couple Families | Single-Parent Households |
| No Children | 0 (0.0%) | 0 (0.0%) |
| 1 or 2 Children | 0 (0.0%) | 1 (33.3%) |
| 3 or 4 Children | 0 (0.0%) | 0 (0.0%) |
| 5 or more Children | 0 (0.0%) | 0 (0.0%) |
| Total | 0 (0.0%) | 1 (10.0%) |
Race in Rockleigh borough
The most populous races in Rockleigh borough are White / Caucasian (475 | 83.8%), Hispanic or Latino (46 | 8.1%), and Asian (45 | 7.9%).
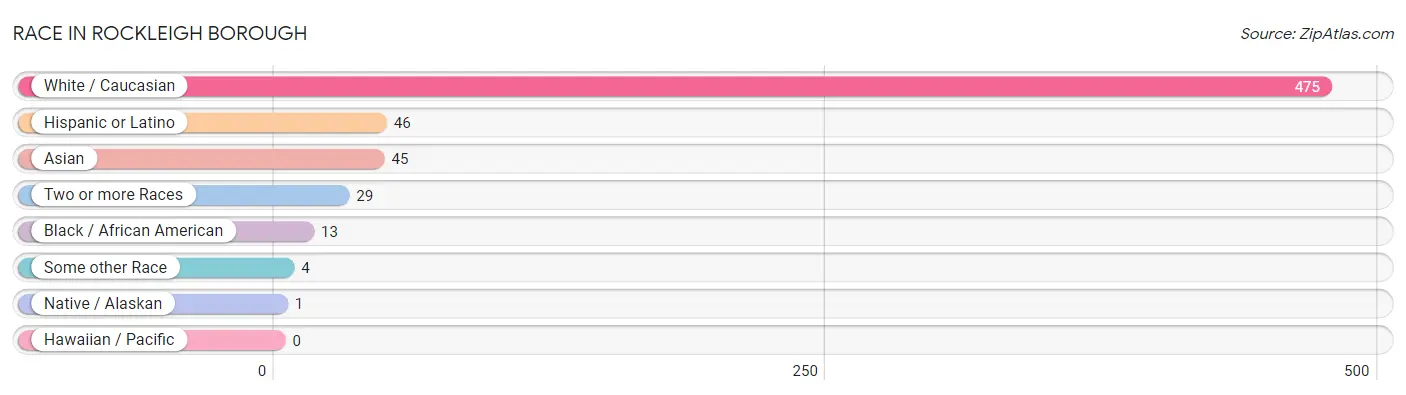
| Race | # Population | % Population |
| Asian | 45 | 7.9% |
| Black / African American | 13 | 2.3% |
| Hawaiian / Pacific | 0 | 0.0% |
| Hispanic or Latino | 46 | 8.1% |
| Native / Alaskan | 1 | 0.2% |
| White / Caucasian | 475 | 83.8% |
| Two or more Races | 29 | 5.1% |
| Some other Race | 4 | 0.7% |
| Total | 567 | 100.0% |
Ancestry in Rockleigh borough
The most populous ancestries reported in Rockleigh borough are Italian (81 | 14.3%), Irish (50 | 8.8%), German (31 | 5.5%), Russian (29 | 5.1%), and Burmese (24 | 4.2%), together accounting for 37.9% of all Rockleigh borough residents.
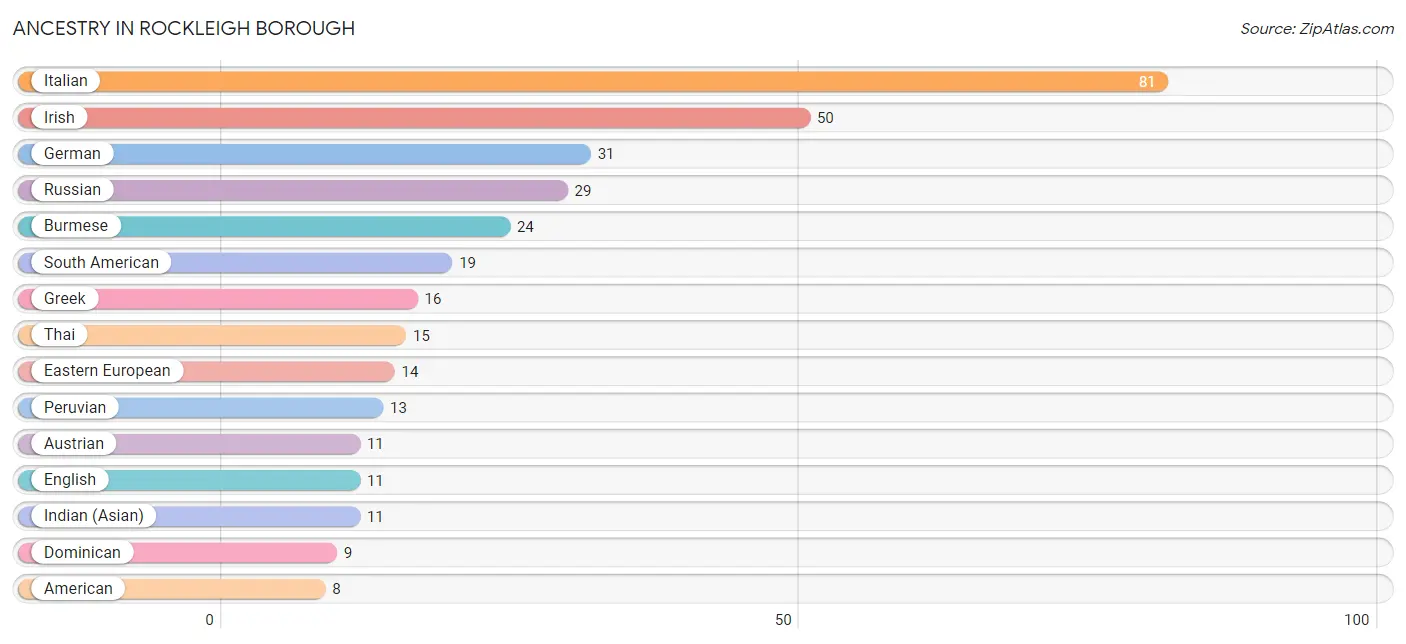
| Ancestry | # Population | % Population |
| American | 8 | 1.4% |
| Arab | 7 | 1.2% |
| Austrian | 11 | 1.9% |
| Burmese | 24 | 4.2% |
| Colombian | 2 | 0.4% |
| Dominican | 9 | 1.6% |
| Dutch | 5 | 0.9% |
| Eastern European | 14 | 2.5% |
| Ecuadorian | 4 | 0.7% |
| English | 11 | 1.9% |
| German | 31 | 5.5% |
| Greek | 16 | 2.8% |
| Haitian | 4 | 0.7% |
| Indian (Asian) | 11 | 1.9% |
| Irish | 50 | 8.8% |
| Italian | 81 | 14.3% |
| Korean | 5 | 0.9% |
| Lebanese | 2 | 0.4% |
| Mexican | 5 | 0.9% |
| Peruvian | 13 | 2.3% |
| Polish | 8 | 1.4% |
| Puerto Rican | 1 | 0.2% |
| Russian | 29 | 5.1% |
| Scottish | 1 | 0.2% |
| South American | 19 | 3.4% |
| Spaniard | 2 | 0.4% |
| Thai | 15 | 2.6% |
| Ukrainian | 4 | 0.7% | View All 28 Rows |
Immigrants in Rockleigh borough
The most numerous immigrant groups reported in Rockleigh borough came from Europe (46 | 8.1%), Asia (45 | 7.9%), Eastern Asia (31 | 5.5%), Korea (26 | 4.6%), and Ireland (15 | 2.6%), together accounting for 28.8% of all Rockleigh borough residents.
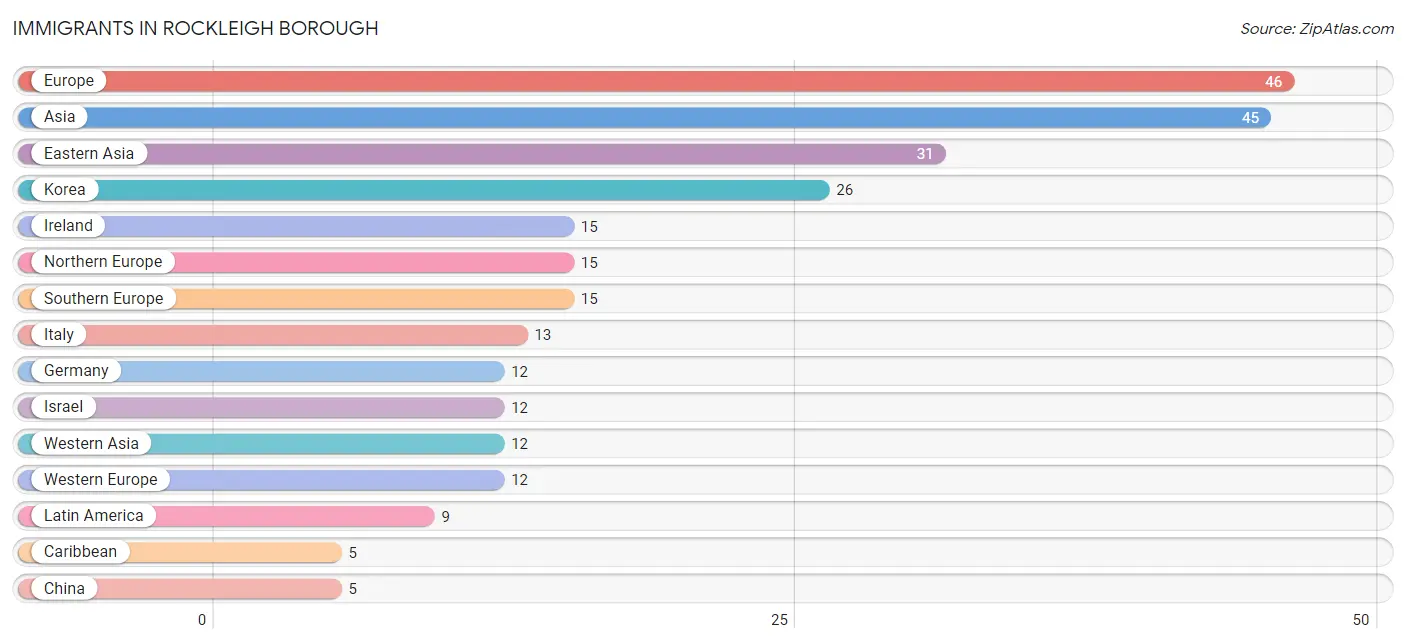
| Immigration Origin | # Population | % Population |
| Asia | 45 | 7.9% |
| Caribbean | 5 | 0.9% |
| China | 5 | 0.9% |
| Dominican Republic | 5 | 0.9% |
| Eastern Asia | 31 | 5.5% |
| Eastern Europe | 4 | 0.7% |
| Ecuador | 4 | 0.7% |
| Europe | 46 | 8.1% |
| Germany | 12 | 2.1% |
| Greece | 2 | 0.4% |
| India | 2 | 0.4% |
| Ireland | 15 | 2.6% |
| Israel | 12 | 2.1% |
| Italy | 13 | 2.3% |
| Korea | 26 | 4.6% |
| Latin America | 9 | 1.6% |
| Northern Europe | 15 | 2.6% |
| Poland | 2 | 0.4% |
| South America | 4 | 0.7% |
| South Central Asia | 2 | 0.4% |
| Southern Europe | 15 | 2.6% |
| Ukraine | 2 | 0.4% |
| Western Asia | 12 | 2.1% |
| Western Europe | 12 | 2.1% | View All 24 Rows |
Sex and Age in Rockleigh borough
Sex and Age in Rockleigh borough
The most populous age groups in Rockleigh borough are 85 Years and over (29 | 14.1%) for men and 85 Years and over (144 | 39.9%) for women.
| Age Bracket | Male | Female |
| Under 5 Years | 2 (1.0%) | 1 (0.3%) |
| 5 to 9 Years | 4 (1.9%) | 9 (2.5%) |
| 10 to 14 Years | 17 (8.3%) | 6 (1.7%) |
| 15 to 19 Years | 20 (9.7%) | 21 (5.8%) |
| 20 to 24 Years | 6 (2.9%) | 4 (1.1%) |
| 25 to 29 Years | 2 (1.0%) | 3 (0.8%) |
| 30 to 34 Years | 9 (4.4%) | 12 (3.3%) |
| 35 to 39 Years | 6 (2.9%) | 0 (0.0%) |
| 40 to 44 Years | 14 (6.8%) | 8 (2.2%) |
| 45 to 49 Years | 5 (2.4%) | 18 (5.0%) |
| 50 to 54 Years | 18 (8.7%) | 26 (7.2%) |
| 55 to 59 Years | 15 (7.3%) | 16 (4.4%) |
| 60 to 64 Years | 19 (9.2%) | 12 (3.3%) |
| 65 to 69 Years | 16 (7.8%) | 14 (3.9%) |
| 70 to 74 Years | 4 (1.9%) | 23 (6.4%) |
| 75 to 79 Years | 7 (3.4%) | 14 (3.9%) |
| 80 to 84 Years | 13 (6.3%) | 30 (8.3%) |
| 85 Years and over | 29 (14.1%) | 144 (39.9%) |
| Total | 206 (100.0%) | 361 (100.0%) |
Families and Households in Rockleigh borough
Median Family Size in Rockleigh borough
The median family size in Rockleigh borough is 3.34 persons per family, with single female/mother families (6 | 8.8%) accounting for the largest median family size of 4 persons per family. On the other hand, single male/father families (4 | 5.9%) represent the smallest median family size with 2.75 persons per family.
| Family Type | # Families | Family Size |
| Married-Couple | 58 (85.3%) | 3.31 |
| Single Male/Father | 4 (5.9%) | 2.75 |
| Single Female/Mother | 6 (8.8%) | 4.00 |
| Total Families | 68 (100.0%) | 3.34 |
Median Household Size in Rockleigh borough
The median household size in Rockleigh borough is 3.44 persons per household, with single female/mother households (6 | 7.7%) accounting for the largest median household size of 4 persons per household. married-couple households (58 | 74.4%) represent the smallest median household size with 3.31 persons per household.
| Household Type | # Households | Household Size |
| Married-Couple | 58 (74.4%) | 3.31 |
| Single Male/Father | 4 (5.1%) | 3.50 |
| Single Female/Mother | 6 (7.7%) | 4.00 |
| Non-family | 10 (12.8%) | 3.80 |
| Total Households | 78 (100.0%) | 3.44 |
Household Size by Marriage Status in Rockleigh borough
Out of a total of 78 households in Rockleigh borough, 68 (87.2%) are family households, while 10 (12.8%) are nonfamily households. The most numerous type of family households are 2-person households, comprising 27, and the most common type of nonfamily households are 1-person households, comprising 8.
| Household Size | Family Households | Nonfamily Households |
| 1-Person Households | - | 8 (10.3%) |
| 2-Person Households | 27 (34.6%) | 0 (0.0%) |
| 3-Person Households | 14 (17.9%) | 0 (0.0%) |
| 4-Person Households | 20 (25.6%) | 0 (0.0%) |
| 5-Person Households | 4 (5.1%) | 0 (0.0%) |
| 6-Person Households | 2 (2.6%) | 0 (0.0%) |
| 7+ Person Households | 1 (1.3%) | 2 (2.6%) |
| Total | 68 (87.2%) | 10 (12.8%) |
Female Fertility in Rockleigh borough
Fertility by Age in Rockleigh borough
| Age Bracket | Women with Births | Births / 1,000 Women |
| 15 to 19 years | 0 (0.0%) | 0.0 |
| 20 to 34 years | 0 (0.0%) | 0.0 |
| 35 to 50 years | 0 (0.0%) | 0.0 |
| Total | 0 (0.0%) | 0.0 |
Fertility by Age by Marriage Status in Rockleigh borough
| Age Bracket | Married | Unmarried |
| 15 to 19 years | 0 (0.0%) | 0 (0.0%) |
| 20 to 34 years | 0 (0.0%) | 0 (0.0%) |
| 35 to 50 years | 0 (0.0%) | 0 (0.0%) |
| Total | 0 (0.0%) | 0 (0.0%) |
Fertility by Education in Rockleigh borough
| Educational Attainment | Women with Births | Births / 1,000 Women |
| Less than High School | 0 (0.0%) | 0.0 |
| High School Diploma | 0 (0.0%) | 0.0 |
| College or Associate's Degree | 0 (0.0%) | 0.0 |
| Bachelor's Degree | 0 (0.0%) | 0.0 |
| Graduate Degree | 0 (0.0%) | 0.0 |
| Total | 0 (0.0%) | 0.0 |
Fertility by Education by Marriage Status in Rockleigh borough
| Educational Attainment | Married | Unmarried |
| Less than High School | 0 (0.0%) | 0 (0.0%) |
| High School Diploma | 0 (0.0%) | 0 (0.0%) |
| College or Associate's Degree | 0 (0.0%) | 0 (0.0%) |
| Bachelor's Degree | 0 (0.0%) | 0 (0.0%) |
| Graduate Degree | 0 (0.0%) | 0 (0.0%) |
| Total | 0 (0.0%) | 0 (0.0%) |
Employment Characteristics in Rockleigh borough
Employment by Class of Employer in Rockleigh borough
Among the 118 employed individuals in Rockleigh borough, private company employees (47 | 39.8%), self-employed (incorporated) (27 | 22.9%), and self-employed (not incorporated) (19 | 16.1%) make up the most common classes of employment.
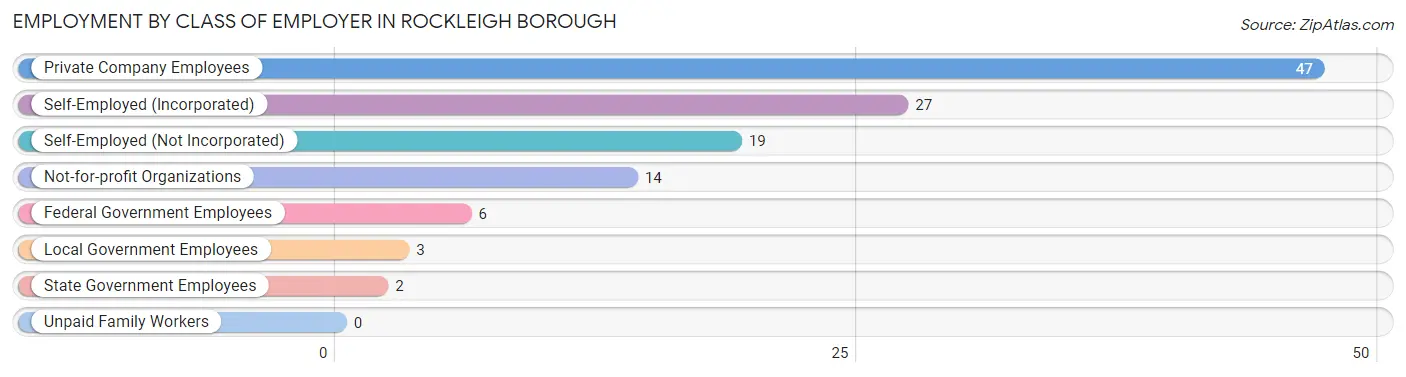
| Employer Class | # Employees | % Employees |
| Private Company Employees | 47 | 39.8% |
| Self-Employed (Incorporated) | 27 | 22.9% |
| Self-Employed (Not Incorporated) | 19 | 16.1% |
| Not-for-profit Organizations | 14 | 11.9% |
| Local Government Employees | 3 | 2.5% |
| State Government Employees | 2 | 1.7% |
| Federal Government Employees | 6 | 5.1% |
| Unpaid Family Workers | 0 | 0.0% |
| Total | 118 | 100.0% |
Employment Status by Age in Rockleigh borough
According to the labor force statistics for Rockleigh borough, out of the total population over 16 years of age (521), 23.2% or 121 individuals are in the labor force, with 0.8% or 1 of them unemployed. The age group with the highest labor force participation rate is 45 to 54 years, with 70.1% or 47 individuals in the labor force. Within the labor force, the 45 to 54 years age range has the highest percentage of unemployed individuals, with 2.1% or 1 of them being unemployed.
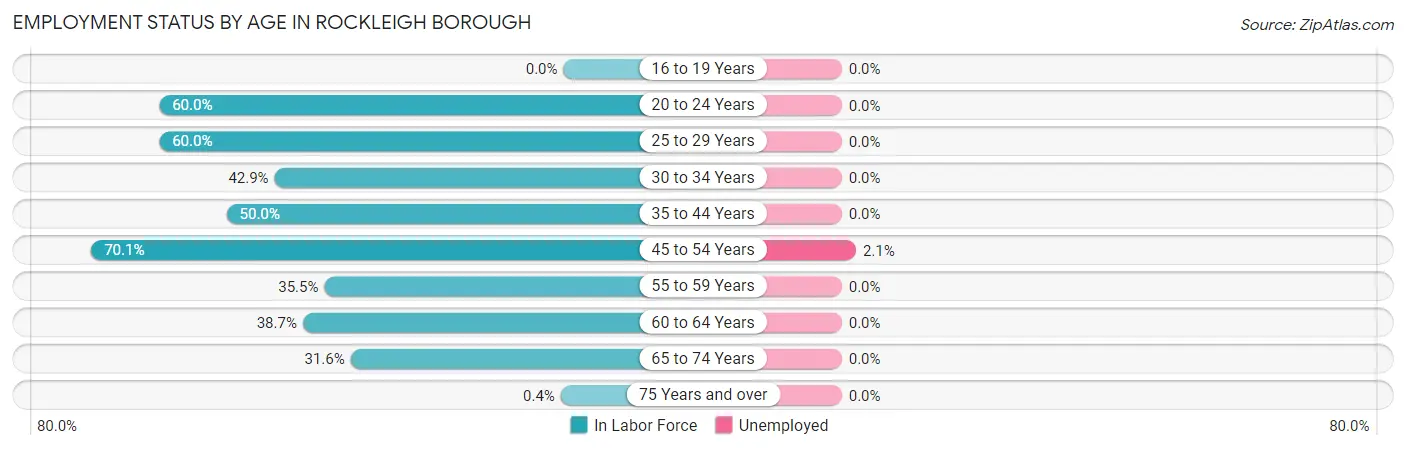
| Age Bracket | In Labor Force | Unemployed |
| 16 to 19 Years | 0 (0.0%) | 0 (0.0%) |
| 20 to 24 Years | 6 (60.0%) | 0 (0.0%) |
| 25 to 29 Years | 3 (60.0%) | 0 (0.0%) |
| 30 to 34 Years | 9 (42.9%) | 0 (0.0%) |
| 35 to 44 Years | 14 (50.0%) | 0 (0.0%) |
| 45 to 54 Years | 47 (70.1%) | 1 (2.1%) |
| 55 to 59 Years | 11 (35.5%) | 0 (0.0%) |
| 60 to 64 Years | 12 (38.7%) | 0 (0.0%) |
| 65 to 74 Years | 18 (31.6%) | 0 (0.0%) |
| 75 Years and over | 1 (0.4%) | 0 (0.0%) |
| Total | 121 (23.2%) | 1 (0.8%) |
Employment Status by Educational Attainment in Rockleigh borough
According to labor force statistics for Rockleigh borough, 52.5% of individuals (96) out of the total population between 25 and 64 years of age (183) are in the labor force, with 1.0% or 1 of them being unemployed. The group with the highest labor force participation rate are those with the educational attainment of college / associate degree, with 77.8% or 7 individuals in the labor force. Within the labor force, individuals with bachelor's degree or higher education have the highest percentage of unemployment, with 1.3% or 1 of them being unemployed.
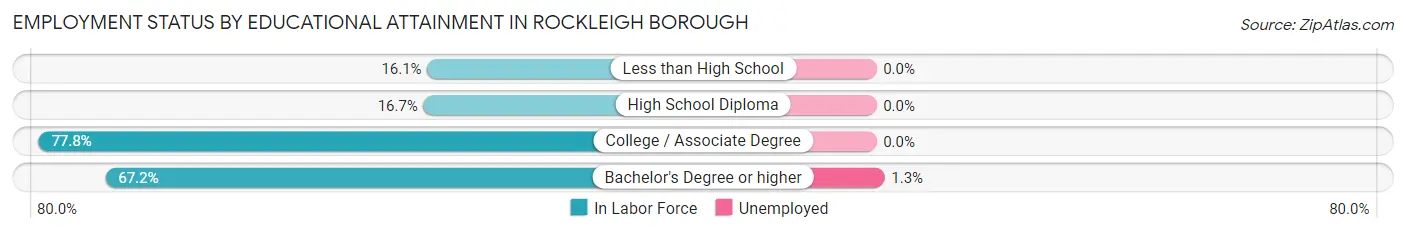
| Educational Attainment | In Labor Force | Unemployed |
| Less than High School | 5 (16.1%) | 0 (0.0%) |
| High School Diploma | 4 (16.7%) | 0 (0.0%) |
| College / Associate Degree | 7 (77.8%) | 0 (0.0%) |
| Bachelor's Degree or higher | 80 (67.2%) | 2 (1.3%) |
| Total | 96 (52.5%) | 2 (1.0%) |
Employment Occupations by Sex in Rockleigh borough
Management, Business, Science and Arts Occupations
The most common Management, Business, Science and Arts occupations in Rockleigh borough are Management (32 | 26.7%), Community & Social Service (19 | 15.8%), Health Diagnosing & Treating (17 | 14.2%), Health Technologists (17 | 14.2%), and Education Instruction & Library (8 | 6.7%).
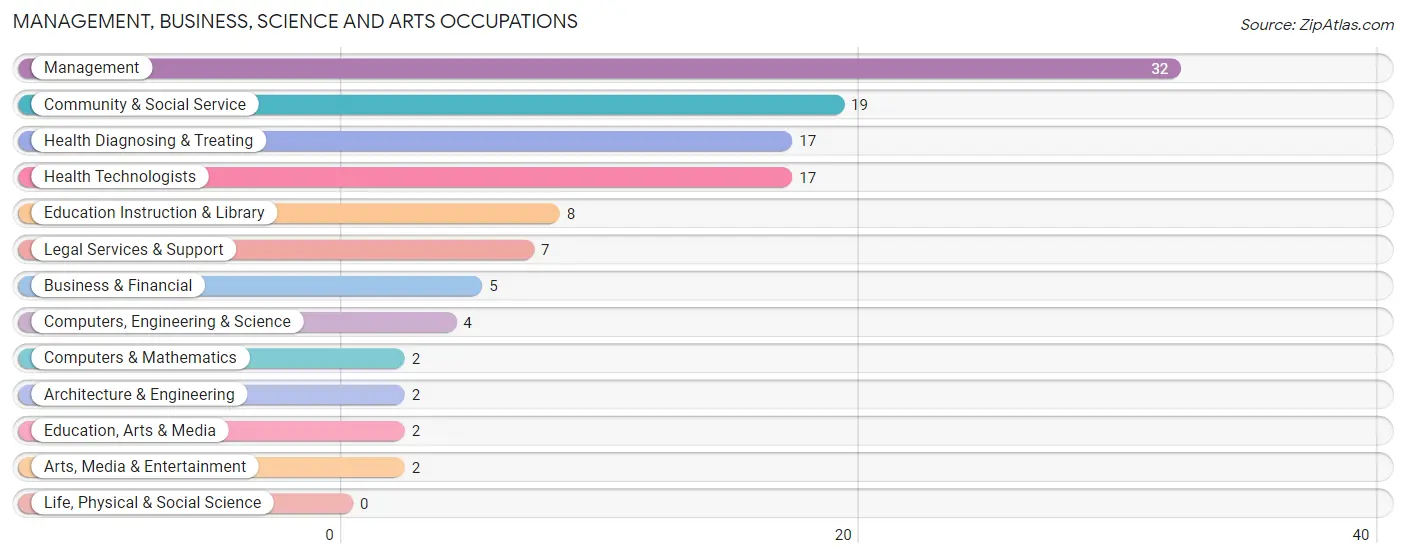
Management, Business, Science and Arts Occupations by Sex
Within the Management, Business, Science and Arts occupations in Rockleigh borough, the most male-oriented occupations are Computers, Engineering & Science (100.0%), Computers & Mathematics (100.0%), and Architecture & Engineering (100.0%), while the most female-oriented occupations are Education, Arts & Media (100.0%), Legal Services & Support (71.4%), and Community & Social Service (47.4%).
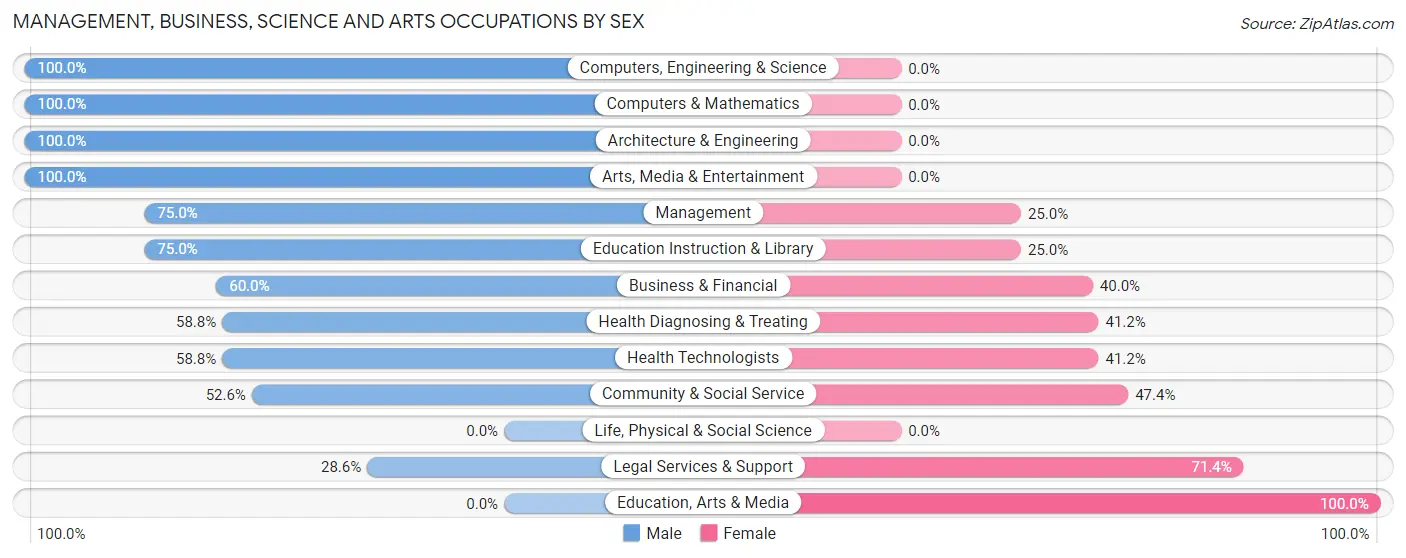
| Occupation | Male | Female |
| Management | 24 (75.0%) | 8 (25.0%) |
| Business & Financial | 3 (60.0%) | 2 (40.0%) |
| Computers, Engineering & Science | 4 (100.0%) | 0 (0.0%) |
| Computers & Mathematics | 2 (100.0%) | 0 (0.0%) |
| Architecture & Engineering | 2 (100.0%) | 0 (0.0%) |
| Life, Physical & Social Science | 0 (0.0%) | 0 (0.0%) |
| Community & Social Service | 10 (52.6%) | 9 (47.4%) |
| Education, Arts & Media | 0 (0.0%) | 2 (100.0%) |
| Legal Services & Support | 2 (28.6%) | 5 (71.4%) |
| Education Instruction & Library | 6 (75.0%) | 2 (25.0%) |
| Arts, Media & Entertainment | 2 (100.0%) | 0 (0.0%) |
| Health Diagnosing & Treating | 10 (58.8%) | 7 (41.2%) |
| Health Technologists | 10 (58.8%) | 7 (41.2%) |
| Total (Category) | 51 (66.2%) | 26 (33.8%) |
| Total (Overall) | 76 (63.3%) | 44 (36.7%) |
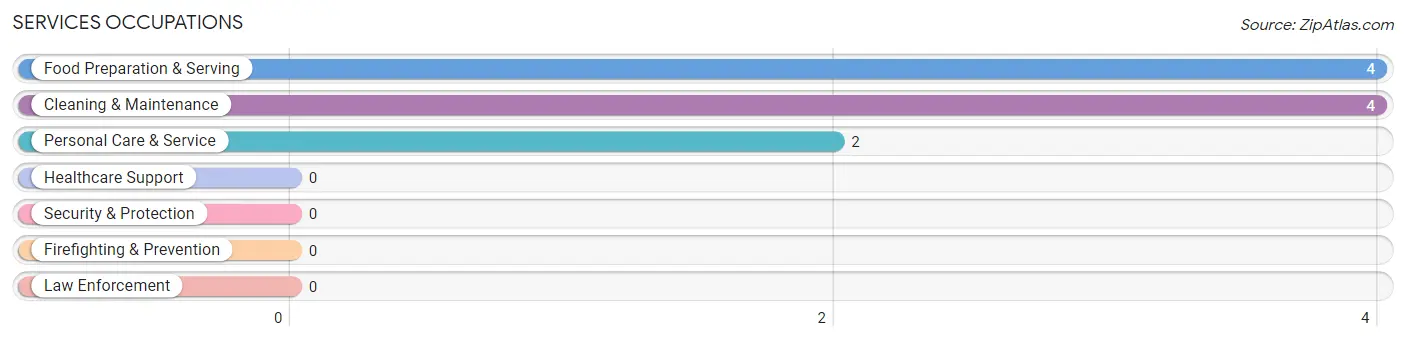
Services Occupations
The most common Services occupations in Rockleigh borough are Food Preparation & Serving (4 | 3.3%), Cleaning & Maintenance (4 | 3.3%), and Personal Care & Service (2 | 1.7%).
Services Occupations by Sex
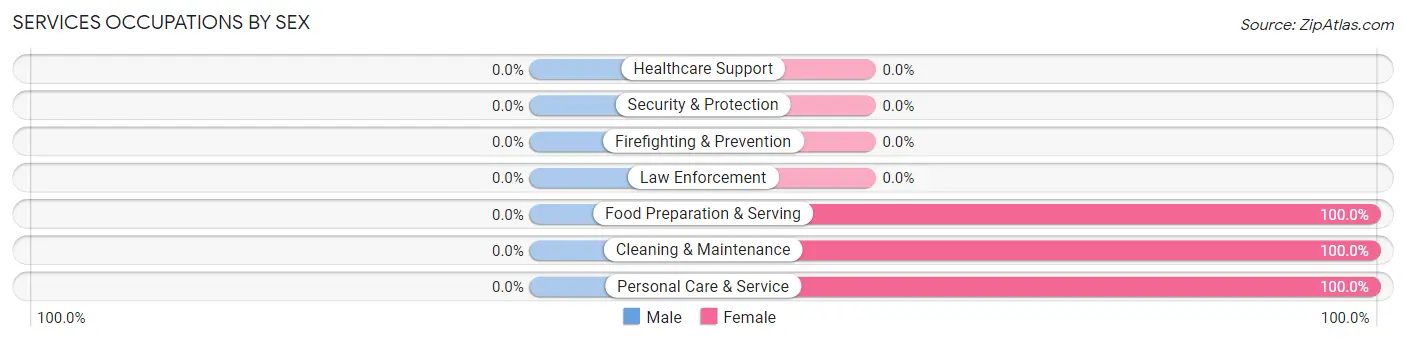
| Occupation | Male | Female |
| Healthcare Support | 0 (0.0%) | 0 (0.0%) |
| Security & Protection | 0 (0.0%) | 0 (0.0%) |
| Firefighting & Prevention | 0 (0.0%) | 0 (0.0%) |
| Law Enforcement | 0 (0.0%) | 0 (0.0%) |
| Food Preparation & Serving | 0 (0.0%) | 4 (100.0%) |
| Cleaning & Maintenance | 0 (0.0%) | 4 (100.0%) |
| Personal Care & Service | 0 (0.0%) | 2 (100.0%) |
| Total (Category) | 0 (0.0%) | 10 (100.0%) |
| Total (Overall) | 76 (63.3%) | 44 (36.7%) |
Sales and Office Occupations
The most common Sales and Office occupations in Rockleigh borough are Sales & Related (16 | 13.3%), and Office & Administration (10 | 8.3%).
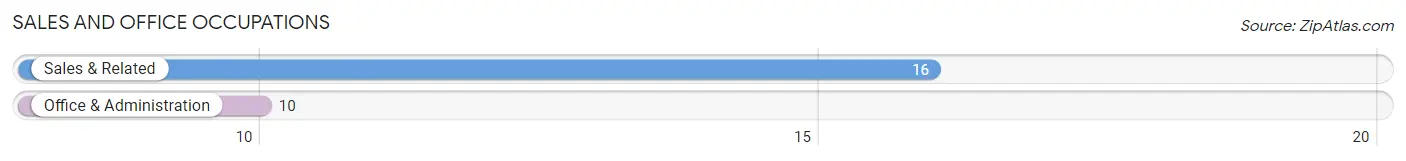
Sales and Office Occupations by Sex
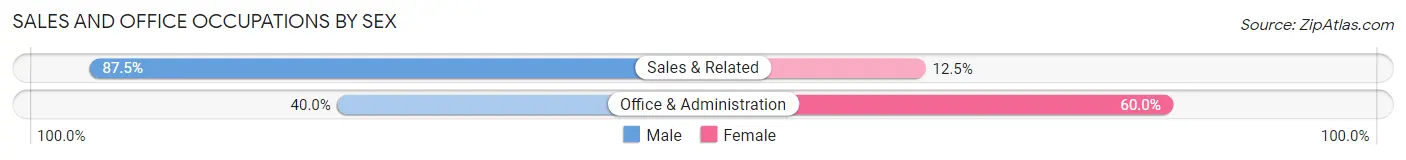
| Occupation | Male | Female |
| Sales & Related | 14 (87.5%) | 2 (12.5%) |
| Office & Administration | 4 (40.0%) | 6 (60.0%) |
| Total (Category) | 18 (69.2%) | 8 (30.8%) |
| Total (Overall) | 76 (63.3%) | 44 (36.7%) |
Natural Resources, Construction and Maintenance Occupations
The most common Natural Resources, Construction and Maintenance occupations in Rockleigh borough are Installation, Maintenance & Repair (3 | 2.5%), and Construction & Extraction (2 | 1.7%).
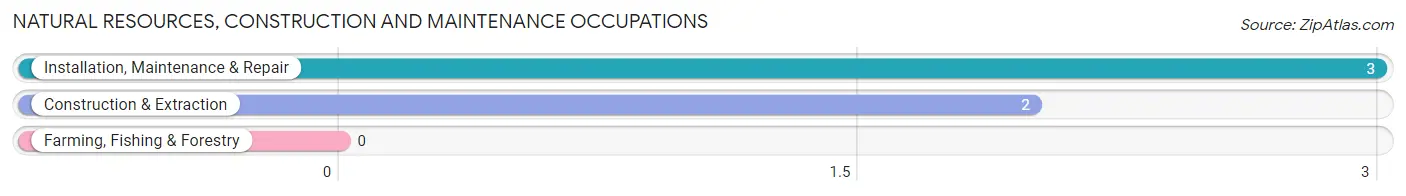
Natural Resources, Construction and Maintenance Occupations by Sex
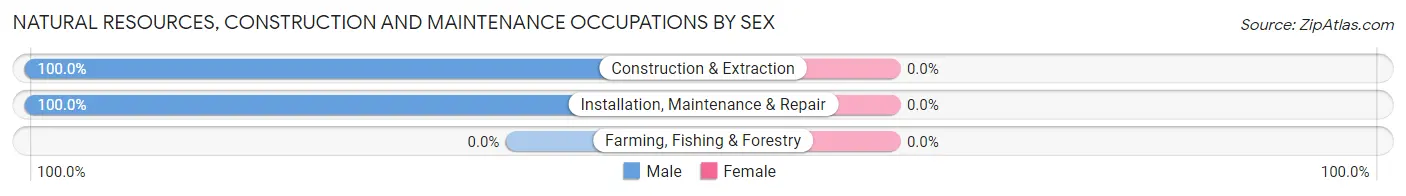
| Occupation | Male | Female |
| Farming, Fishing & Forestry | 0 (0.0%) | 0 (0.0%) |
| Construction & Extraction | 2 (100.0%) | 0 (0.0%) |
| Installation, Maintenance & Repair | 3 (100.0%) | 0 (0.0%) |
| Total (Category) | 5 (100.0%) | 0 (0.0%) |
| Total (Overall) | 76 (63.3%) | 44 (36.7%) |
Production, Transportation and Moving Occupations
The most common Production, Transportation and Moving occupations in Rockleigh borough are , and Transportation (2 | 1.7%).
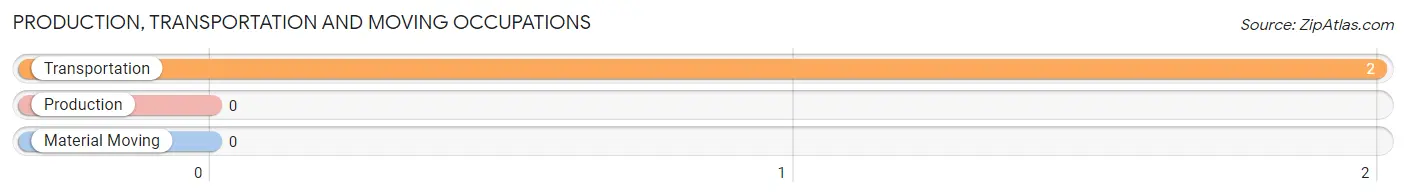
Production, Transportation and Moving Occupations by Sex
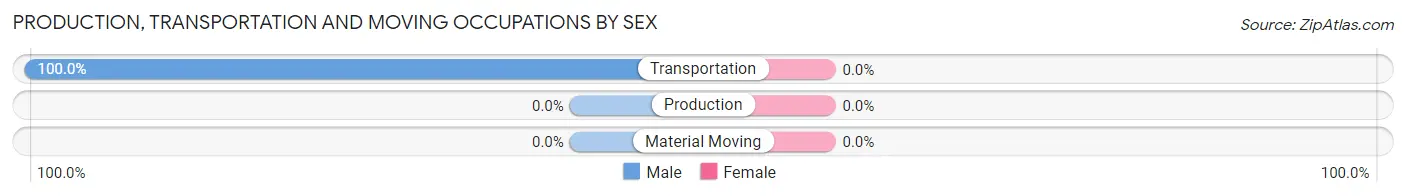
| Occupation | Male | Female |
| Production | 0 (0.0%) | 0 (0.0%) |
| Transportation | 2 (100.0%) | 0 (0.0%) |
| Material Moving | 0 (0.0%) | 0 (0.0%) |
| Total (Category) | 2 (100.0%) | 0 (0.0%) |
| Total (Overall) | 76 (63.3%) | 44 (36.7%) |
Employment Industries by Sex in Rockleigh borough
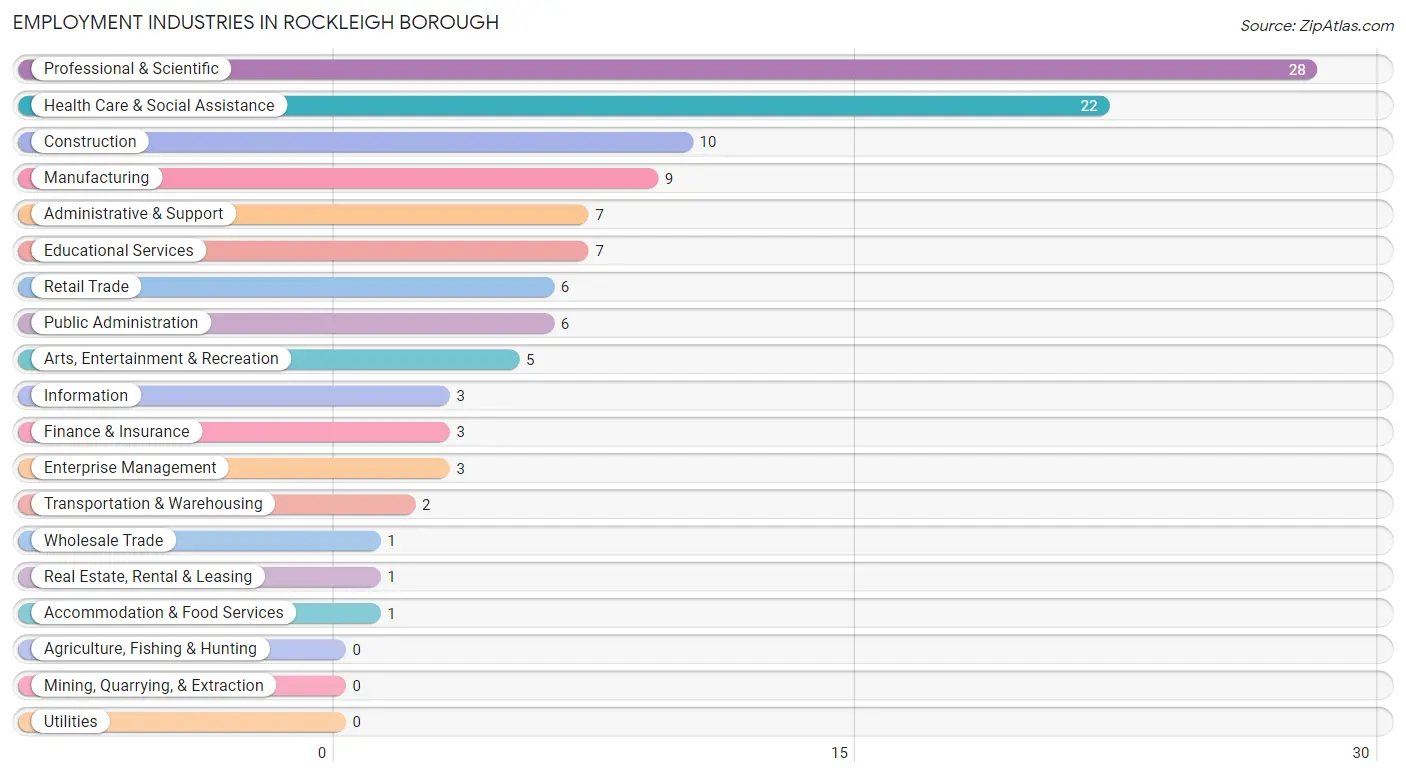
Employment Industries in Rockleigh borough
The major employment industries in Rockleigh borough include Professional & Scientific (28 | 23.3%), Health Care & Social Assistance (22 | 18.3%), Construction (10 | 8.3%), Manufacturing (9 | 7.5%), and Administrative & Support (7 | 5.8%).
Employment Industries by Sex in Rockleigh borough
The Rockleigh borough industries that see more men than women are Manufacturing (100.0%), Wholesale Trade (100.0%), and Transportation & Warehousing (100.0%), whereas the industries that tend to have a higher number of women are Real Estate, Rental & Leasing (100.0%), Enterprise Management (100.0%), and Administrative & Support (57.1%).
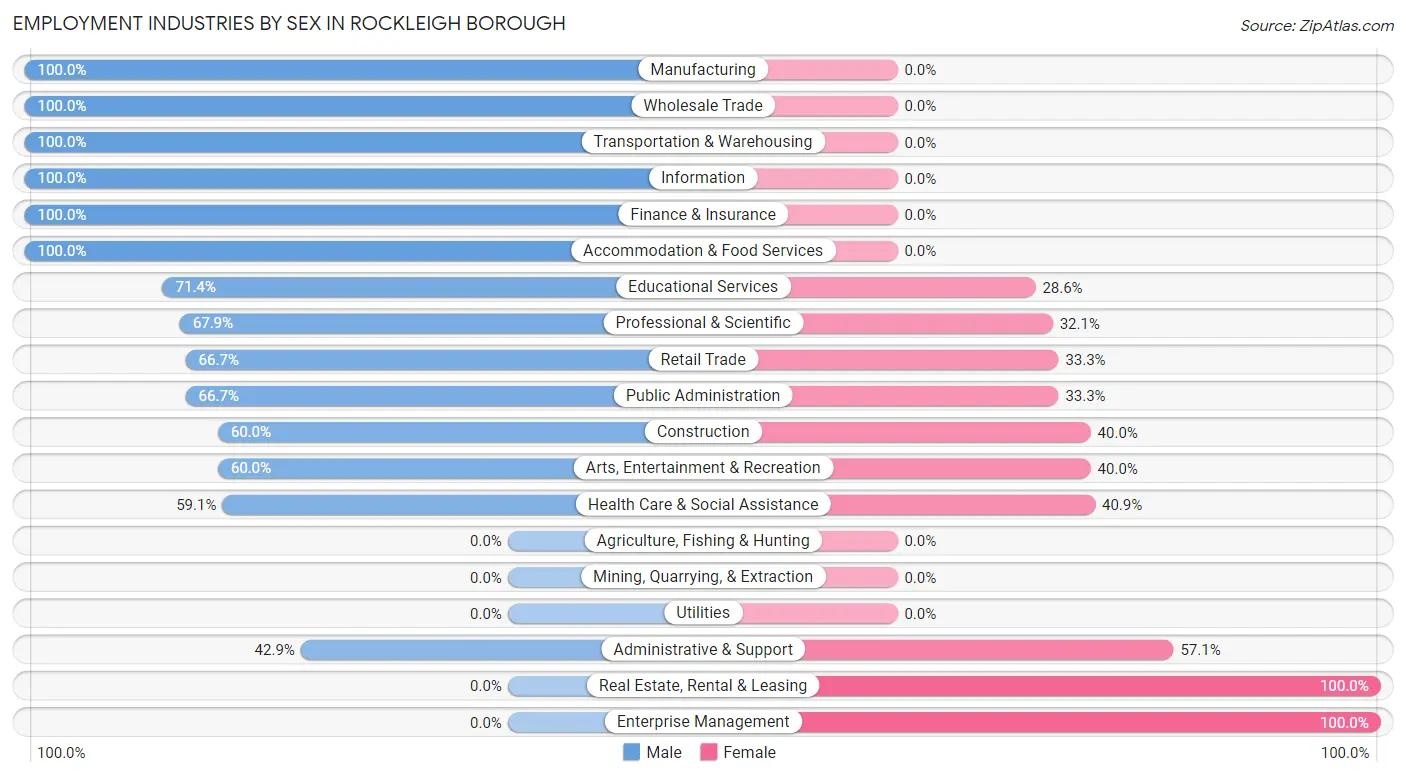
| Industry | Male | Female |
| Agriculture, Fishing & Hunting | 0 (0.0%) | 0 (0.0%) |
| Mining, Quarrying, & Extraction | 0 (0.0%) | 0 (0.0%) |
| Construction | 6 (60.0%) | 4 (40.0%) |
| Manufacturing | 9 (100.0%) | 0 (0.0%) |
| Wholesale Trade | 1 (100.0%) | 0 (0.0%) |
| Retail Trade | 4 (66.7%) | 2 (33.3%) |
| Transportation & Warehousing | 2 (100.0%) | 0 (0.0%) |
| Utilities | 0 (0.0%) | 0 (0.0%) |
| Information | 3 (100.0%) | 0 (0.0%) |
| Finance & Insurance | 3 (100.0%) | 0 (0.0%) |
| Real Estate, Rental & Leasing | 0 (0.0%) | 1 (100.0%) |
| Professional & Scientific | 19 (67.9%) | 9 (32.1%) |
| Enterprise Management | 0 (0.0%) | 3 (100.0%) |
| Administrative & Support | 3 (42.9%) | 4 (57.1%) |
| Educational Services | 5 (71.4%) | 2 (28.6%) |
| Health Care & Social Assistance | 13 (59.1%) | 9 (40.9%) |
| Arts, Entertainment & Recreation | 3 (60.0%) | 2 (40.0%) |
| Accommodation & Food Services | 1 (100.0%) | 0 (0.0%) |
| Public Administration | 4 (66.7%) | 2 (33.3%) |
| Total | 76 (63.3%) | 44 (36.7%) |
Education in Rockleigh borough
School Enrollment in Rockleigh borough
The most common levels of schooling among the 95 students in Rockleigh borough are high school (39 | 41.0%), college / undergraduate (21 | 22.1%), and middle school (14 | 14.7%).
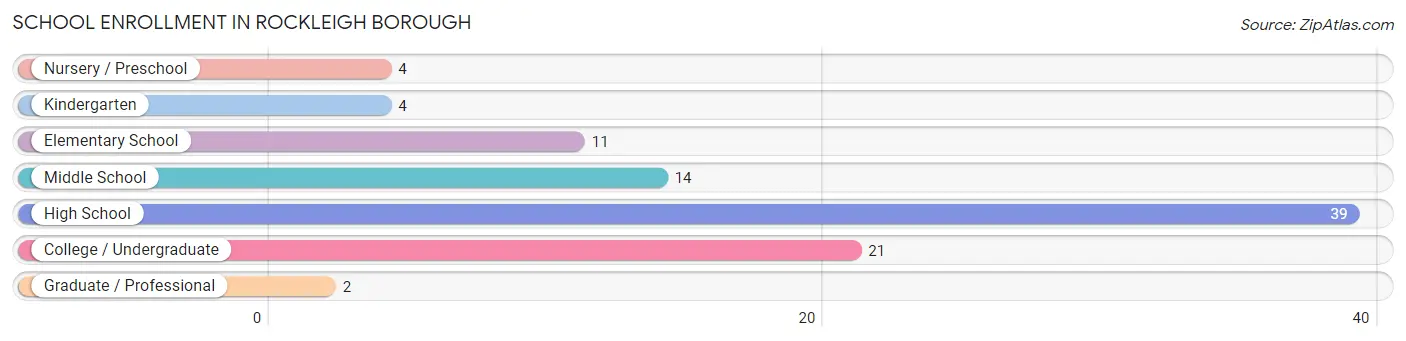
| School Level | # Students | % Students |
| Nursery / Preschool | 4 | 4.2% |
| Kindergarten | 4 | 4.2% |
| Elementary School | 11 | 11.6% |
| Middle School | 14 | 14.7% |
| High School | 39 | 41.0% |
| College / Undergraduate | 21 | 22.1% |
| Graduate / Professional | 2 | 2.1% |
| Total | 95 | 100.0% |
School Enrollment by Age by Funding Source in Rockleigh borough
Out of a total of 95 students who are enrolled in schools in Rockleigh borough, 53 (55.8%) attend a private institution, while the remaining 42 (44.2%) are enrolled in public schools. The age group of 25 to 34 year olds has the highest likelihood of being enrolled in private schools, with 2 (100.0% in the age bracket) enrolled. Conversely, the age group of 18 to 19 year olds has the lowest likelihood of being enrolled in a private school, with 9 (75.0% in the age bracket) attending a public institution.
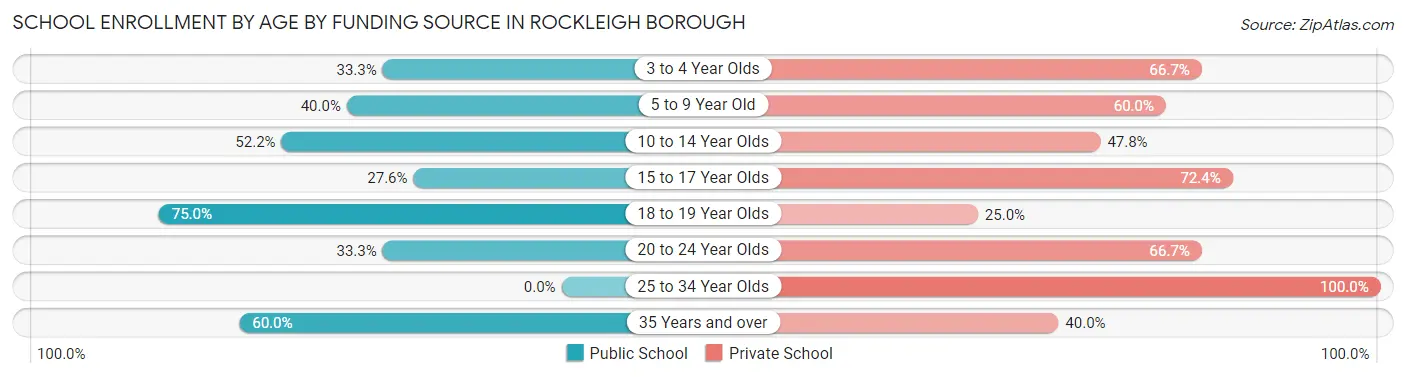
| Age Bracket | Public School | Private School |
| 3 to 4 Year Olds | 1 (33.3%) | 2 (66.7%) |
| 5 to 9 Year Old | 4 (40.0%) | 6 (60.0%) |
| 10 to 14 Year Olds | 12 (52.2%) | 11 (47.8%) |
| 15 to 17 Year Olds | 8 (27.6%) | 21 (72.4%) |
| 18 to 19 Year Olds | 9 (75.0%) | 3 (25.0%) |
| 20 to 24 Year Olds | 2 (33.3%) | 4 (66.7%) |
| 25 to 34 Year Olds | 0 (0.0%) | 2 (100.0%) |
| 35 Years and over | 6 (60.0%) | 4 (40.0%) |
| Total | 42 (44.2%) | 53 (55.8%) |
Educational Attainment by Field of Study in Rockleigh borough
Education (40 | 23.0%), business (34 | 19.5%), social sciences (18 | 10.3%), visual & performing arts (18 | 10.3%), and bio, nature & agricultural (15 | 8.6%) are the most common fields of study among 174 individuals in Rockleigh borough who have obtained a bachelor's degree or higher.
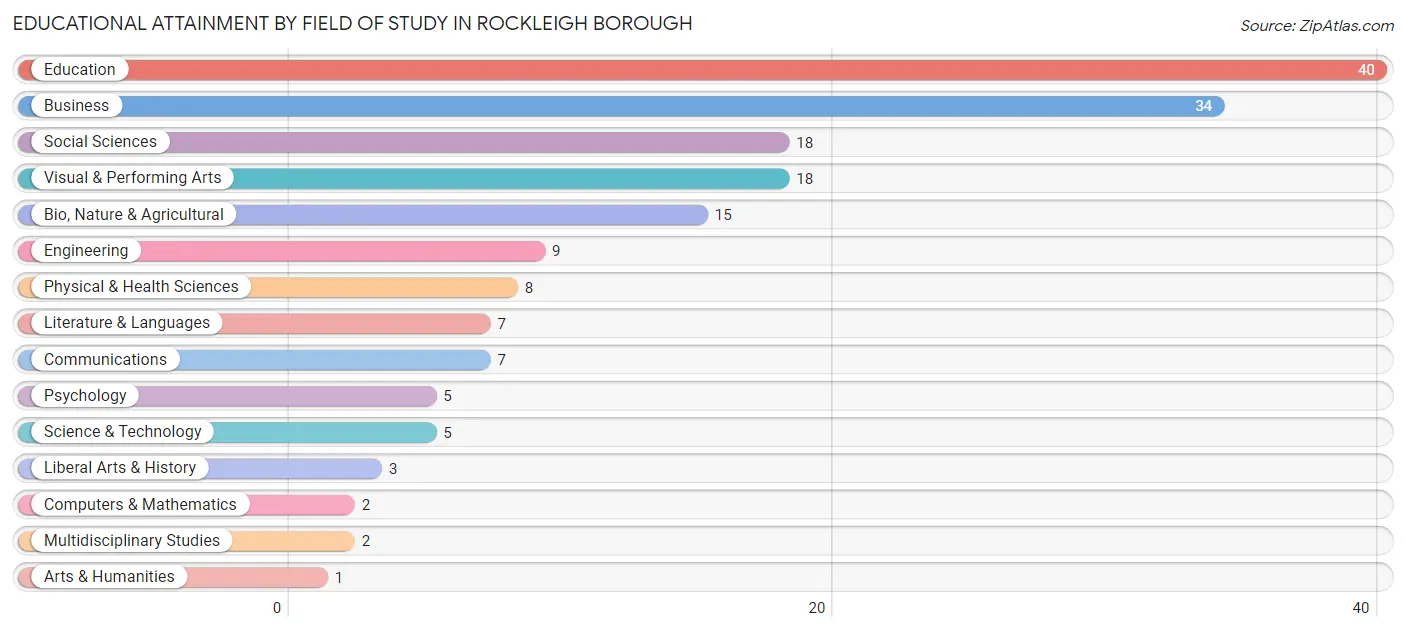
| Field of Study | # Graduates | % Graduates |
| Computers & Mathematics | 2 | 1.1% |
| Bio, Nature & Agricultural | 15 | 8.6% |
| Physical & Health Sciences | 8 | 4.6% |
| Psychology | 5 | 2.9% |
| Social Sciences | 18 | 10.3% |
| Engineering | 9 | 5.2% |
| Multidisciplinary Studies | 2 | 1.1% |
| Science & Technology | 5 | 2.9% |
| Business | 34 | 19.5% |
| Education | 40 | 23.0% |
| Literature & Languages | 7 | 4.0% |
| Liberal Arts & History | 3 | 1.7% |
| Visual & Performing Arts | 18 | 10.3% |
| Communications | 7 | 4.0% |
| Arts & Humanities | 1 | 0.6% |
| Total | 174 | 100.0% |
Transportation & Commute in Rockleigh borough
Vehicle Availability by Sex in Rockleigh borough
The most prevalent vehicle ownership categories in Rockleigh borough are males with 2 vehicles (26, accounting for 35.1%) and females with 2 vehicles (15, making up 59.1%).
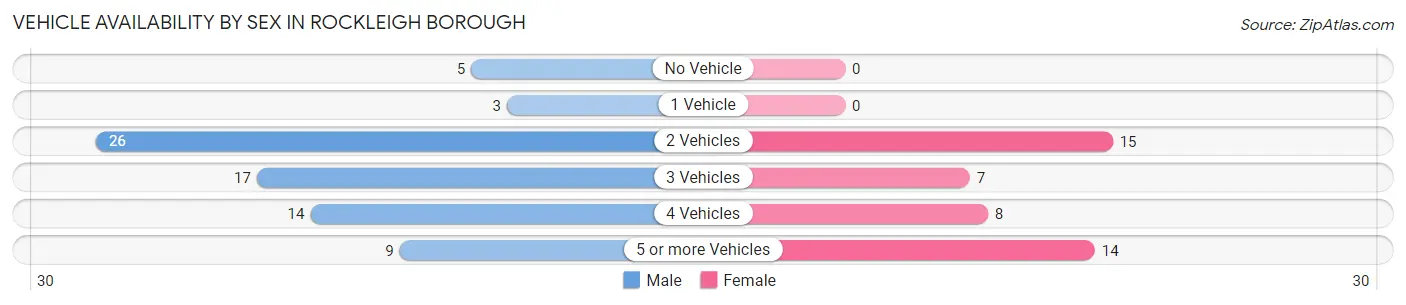
| Vehicles Available | Male | Female |
| No Vehicle | 5 (6.8%) | 0 (0.0%) |
| 1 Vehicle | 3 (4.1%) | 0 (0.0%) |
| 2 Vehicles | 26 (35.1%) | 15 (34.1%) |
| 3 Vehicles | 17 (23.0%) | 7 (15.9%) |
| 4 Vehicles | 14 (18.9%) | 8 (18.2%) |
| 5 or more Vehicles | 9 (12.2%) | 14 (31.8%) |
| Total | 74 (100.0%) | 44 (100.0%) |
Commute Time in Rockleigh borough
The most frequently occuring commute durations in Rockleigh borough are 45 to 59 minutes (16 commuters, 17.8%), 15 to 19 minutes (15 commuters, 16.7%), and 25 to 29 minutes (12 commuters, 13.3%).
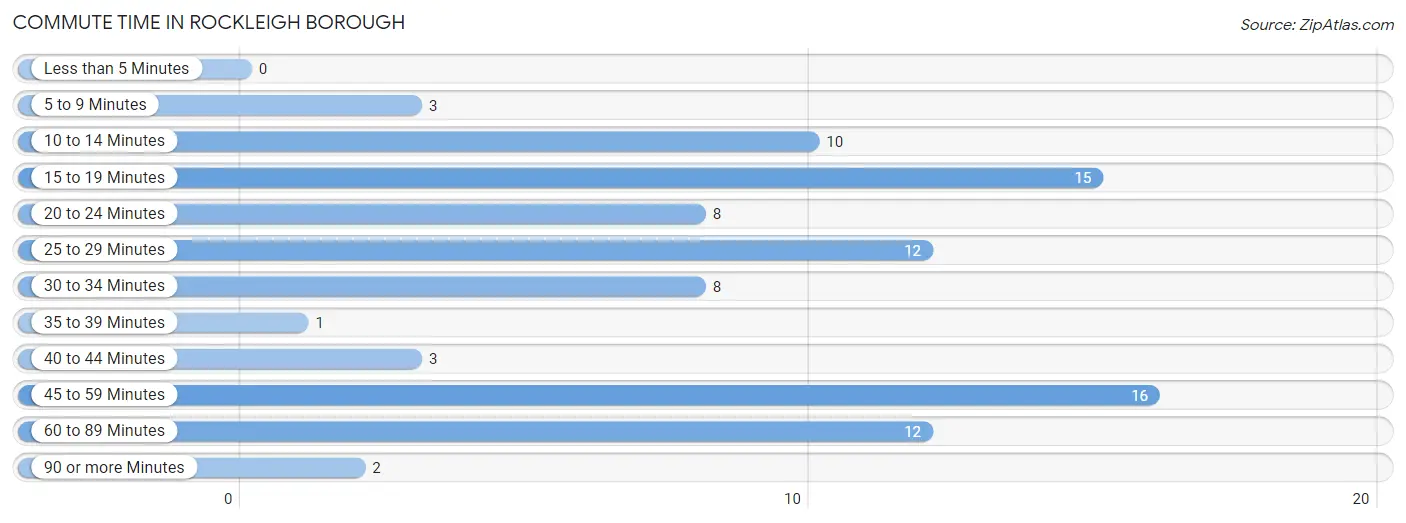
| Commute Time | # Commuters | % Commuters |
| Less than 5 Minutes | 0 | 0.0% |
| 5 to 9 Minutes | 3 | 3.3% |
| 10 to 14 Minutes | 10 | 11.1% |
| 15 to 19 Minutes | 15 | 16.7% |
| 20 to 24 Minutes | 8 | 8.9% |
| 25 to 29 Minutes | 12 | 13.3% |
| 30 to 34 Minutes | 8 | 8.9% |
| 35 to 39 Minutes | 1 | 1.1% |
| 40 to 44 Minutes | 3 | 3.3% |
| 45 to 59 Minutes | 16 | 17.8% |
| 60 to 89 Minutes | 12 | 13.3% |
| 90 or more Minutes | 2 | 2.2% |
Commute Time by Sex in Rockleigh borough
The most common commute times in Rockleigh borough are 45 to 59 minutes (13 commuters, 22.4%) for males and 60 to 89 minutes (9 commuters, 28.1%) for females.
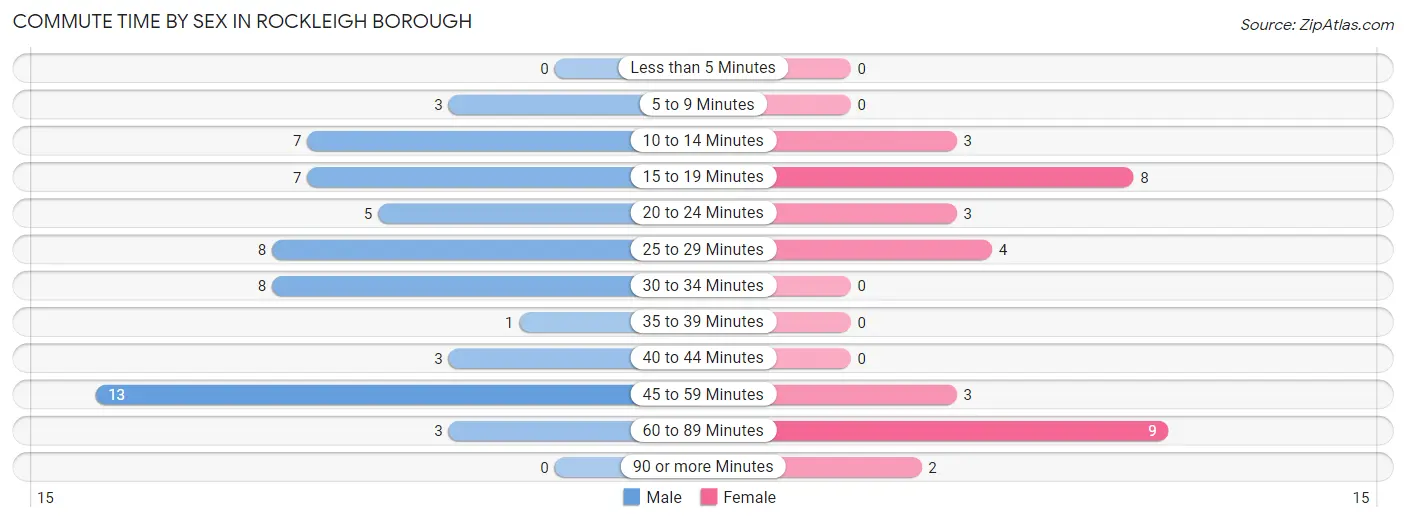
| Commute Time | Male | Female |
| Less than 5 Minutes | 0 (0.0%) | 0 (0.0%) |
| 5 to 9 Minutes | 3 (5.2%) | 0 (0.0%) |
| 10 to 14 Minutes | 7 (12.1%) | 3 (9.4%) |
| 15 to 19 Minutes | 7 (12.1%) | 8 (25.0%) |
| 20 to 24 Minutes | 5 (8.6%) | 3 (9.4%) |
| 25 to 29 Minutes | 8 (13.8%) | 4 (12.5%) |
| 30 to 34 Minutes | 8 (13.8%) | 0 (0.0%) |
| 35 to 39 Minutes | 1 (1.7%) | 0 (0.0%) |
| 40 to 44 Minutes | 3 (5.2%) | 0 (0.0%) |
| 45 to 59 Minutes | 13 (22.4%) | 3 (9.4%) |
| 60 to 89 Minutes | 3 (5.2%) | 9 (28.1%) |
| 90 or more Minutes | 0 (0.0%) | 2 (6.2%) |
Time of Departure to Work by Sex in Rockleigh borough
The most frequent times of departure to work in Rockleigh borough are 6:30 AM to 6:59 AM (13, 22.4%) for males and 8:00 AM to 8:29 AM (9, 28.1%) for females.
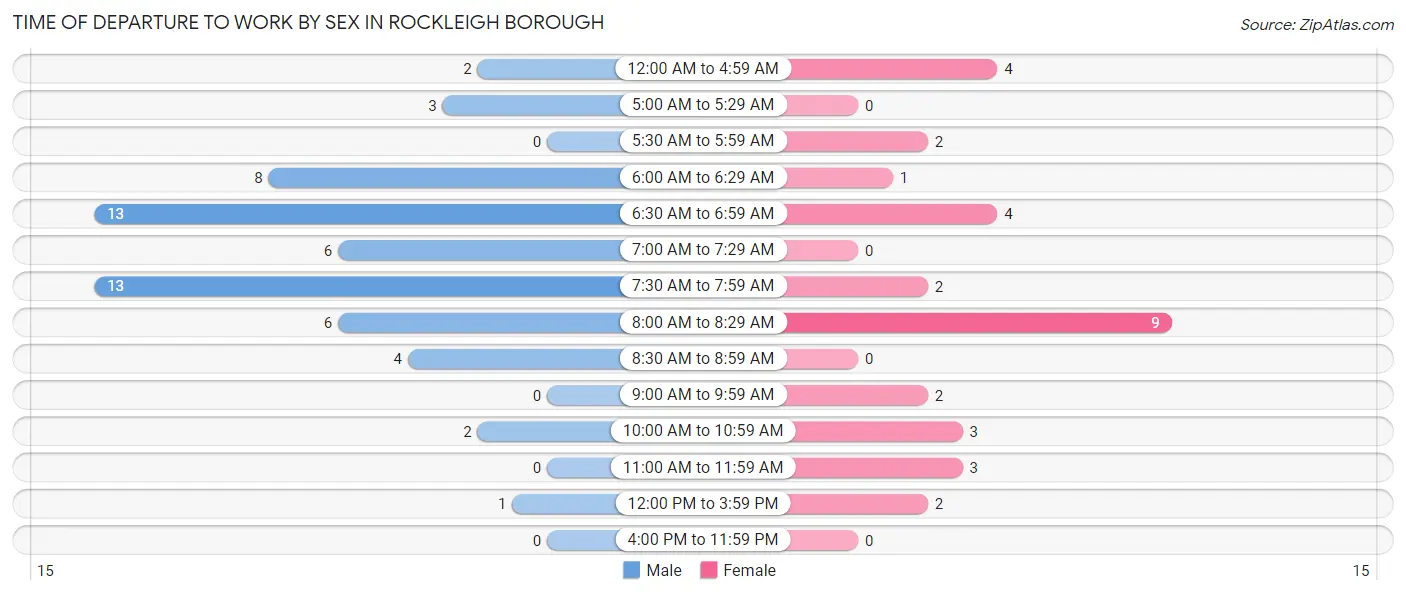
| Time of Departure | Male | Female |
| 12:00 AM to 4:59 AM | 2 (3.5%) | 4 (12.5%) |
| 5:00 AM to 5:29 AM | 3 (5.2%) | 0 (0.0%) |
| 5:30 AM to 5:59 AM | 0 (0.0%) | 2 (6.2%) |
| 6:00 AM to 6:29 AM | 8 (13.8%) | 1 (3.1%) |
| 6:30 AM to 6:59 AM | 13 (22.4%) | 4 (12.5%) |
| 7:00 AM to 7:29 AM | 6 (10.3%) | 0 (0.0%) |
| 7:30 AM to 7:59 AM | 13 (22.4%) | 2 (6.2%) |
| 8:00 AM to 8:29 AM | 6 (10.3%) | 9 (28.1%) |
| 8:30 AM to 8:59 AM | 4 (6.9%) | 0 (0.0%) |
| 9:00 AM to 9:59 AM | 0 (0.0%) | 2 (6.2%) |
| 10:00 AM to 10:59 AM | 2 (3.5%) | 3 (9.4%) |
| 11:00 AM to 11:59 AM | 0 (0.0%) | 3 (9.4%) |
| 12:00 PM to 3:59 PM | 1 (1.7%) | 2 (6.2%) |
| 4:00 PM to 11:59 PM | 0 (0.0%) | 0 (0.0%) |
| Total | 58 (100.0%) | 32 (100.0%) |
Housing Occupancy in Rockleigh borough
Occupancy by Ownership in Rockleigh borough
Of the total 78 dwellings in Rockleigh borough, owner-occupied units account for 64 (82.1%), while renter-occupied units make up 14 (17.9%).
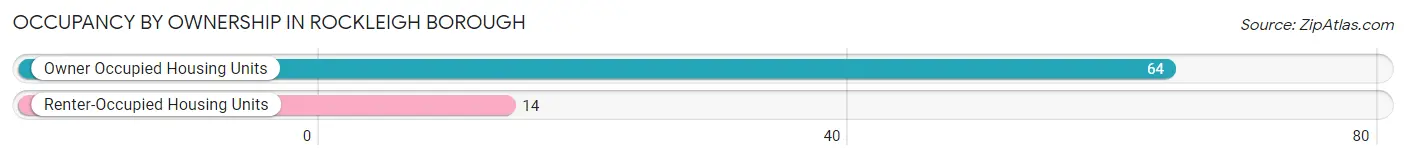
| Occupancy | # Housing Units | % Housing Units |
| Owner Occupied Housing Units | 64 | 82.1% |
| Renter-Occupied Housing Units | 14 | 17.9% |
| Total Occupied Housing Units | 78 | 100.0% |
Occupancy by Household Size in Rockleigh borough
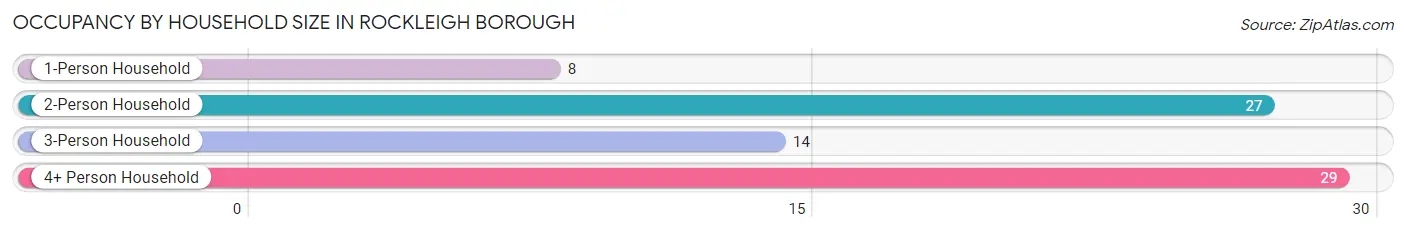
| Household Size | # Housing Units | % Housing Units |
| 1-Person Household | 8 | 10.3% |
| 2-Person Household | 27 | 34.6% |
| 3-Person Household | 14 | 17.9% |
| 4+ Person Household | 29 | 37.2% |
| Total Housing Units | 78 | 100.0% |
Occupancy by Ownership by Household Size in Rockleigh borough
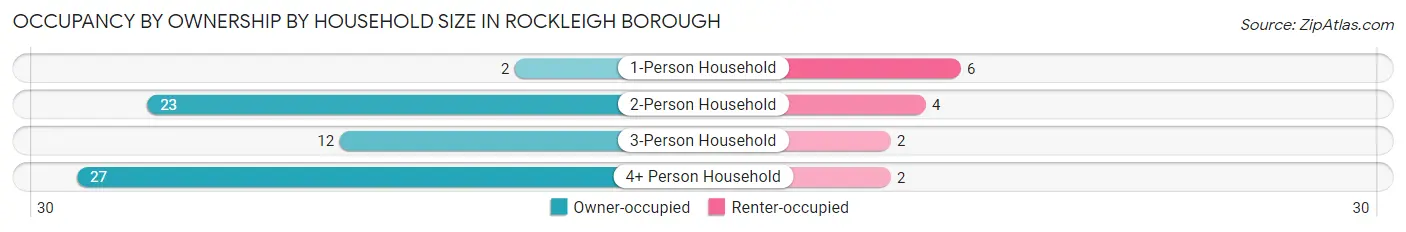
| Household Size | Owner-occupied | Renter-occupied |
| 1-Person Household | 2 (25.0%) | 6 (75.0%) |
| 2-Person Household | 23 (85.2%) | 4 (14.8%) |
| 3-Person Household | 12 (85.7%) | 2 (14.3%) |
| 4+ Person Household | 27 (93.1%) | 2 (6.9%) |
| Total Housing Units | 64 (82.1%) | 14 (17.9%) |
Occupancy by Educational Attainment in Rockleigh borough
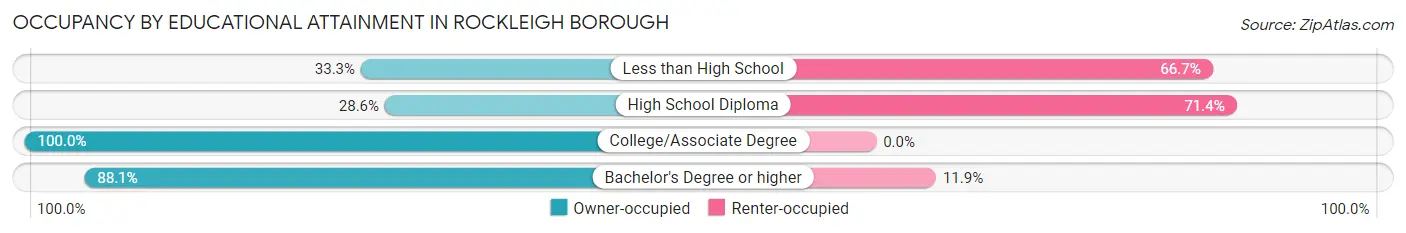
| Household Size | Owner-occupied | Renter-occupied |
| Less than High School | 1 (33.3%) | 2 (66.7%) |
| High School Diploma | 2 (28.6%) | 5 (71.4%) |
| College/Associate Degree | 9 (100.0%) | 0 (0.0%) |
| Bachelor's Degree or higher | 52 (88.1%) | 7 (11.9%) |
Occupancy by Age of Householder in Rockleigh borough
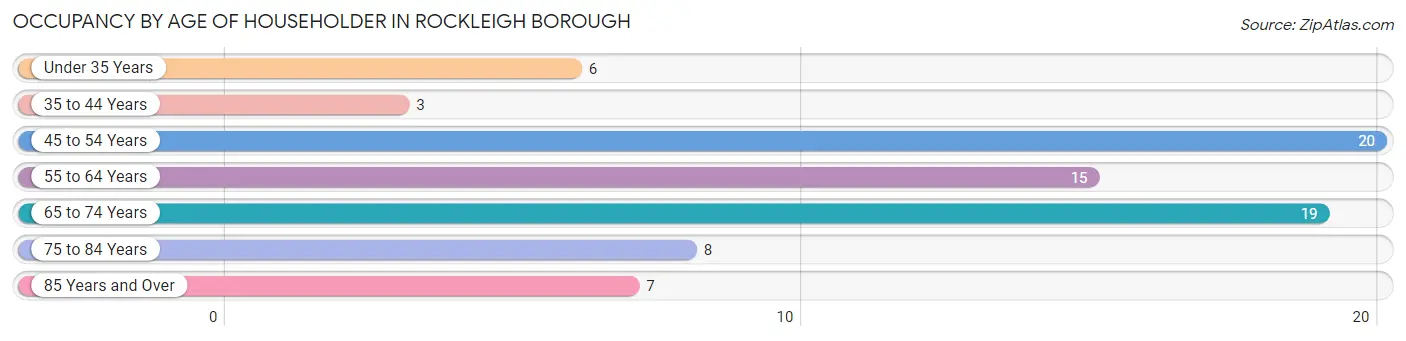
| Age Bracket | # Households | % Households |
| Under 35 Years | 6 | 7.7% |
| 35 to 44 Years | 3 | 3.8% |
| 45 to 54 Years | 20 | 25.6% |
| 55 to 64 Years | 15 | 19.2% |
| 65 to 74 Years | 19 | 24.4% |
| 75 to 84 Years | 8 | 10.3% |
| 85 Years and Over | 7 | 9.0% |
| Total | 78 | 100.0% |
Housing Finances in Rockleigh borough
Median Income by Occupancy in Rockleigh borough
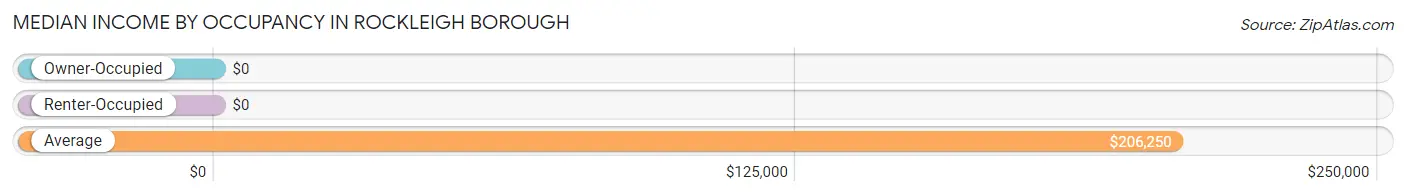
| Occupancy Type | # Households | Median Income |
| Owner-Occupied | 64 (82.1%) | $0 |
| Renter-Occupied | 14 (17.9%) | $0 |
| Average | 78 (100.0%) | $206,250 |
Occupancy by Householder Income Bracket in Rockleigh borough
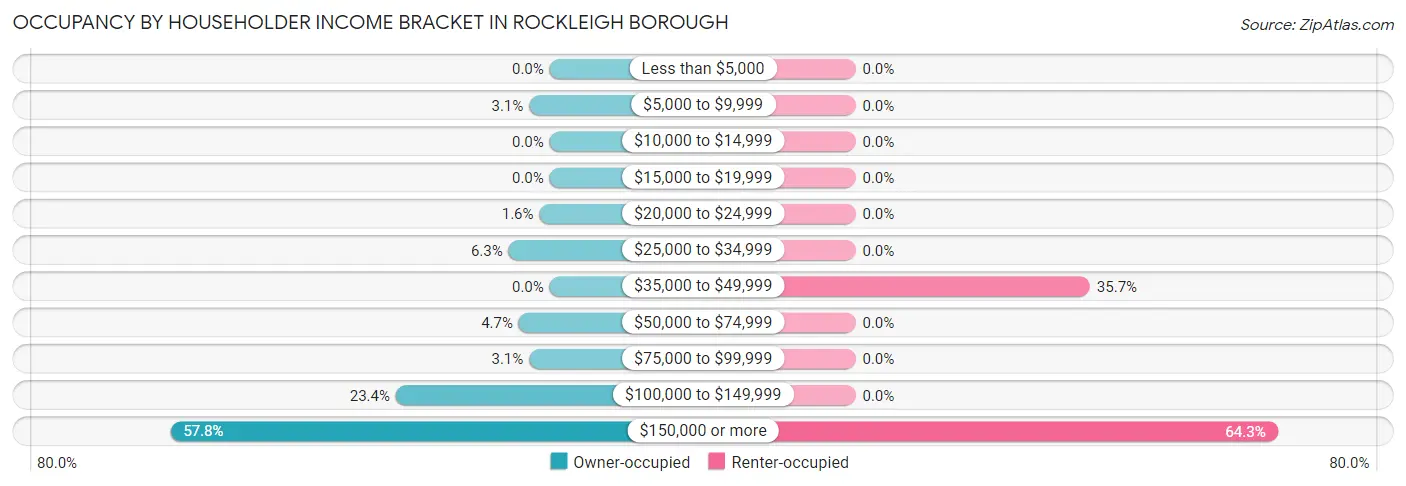
| Income Bracket | Owner-occupied | Renter-occupied |
| Less than $5,000 | 0 (0.0%) | 0 (0.0%) |
| $5,000 to $9,999 | 2 (3.1%) | 0 (0.0%) |
| $10,000 to $14,999 | 0 (0.0%) | 0 (0.0%) |
| $15,000 to $19,999 | 0 (0.0%) | 0 (0.0%) |
| $20,000 to $24,999 | 1 (1.6%) | 0 (0.0%) |
| $25,000 to $34,999 | 4 (6.2%) | 0 (0.0%) |
| $35,000 to $49,999 | 0 (0.0%) | 5 (35.7%) |
| $50,000 to $74,999 | 3 (4.7%) | 0 (0.0%) |
| $75,000 to $99,999 | 2 (3.1%) | 0 (0.0%) |
| $100,000 to $149,999 | 15 (23.4%) | 0 (0.0%) |
| $150,000 or more | 37 (57.8%) | 9 (64.3%) |
| Total | 64 (100.0%) | 14 (100.0%) |
Monthly Housing Cost Tiers in Rockleigh borough
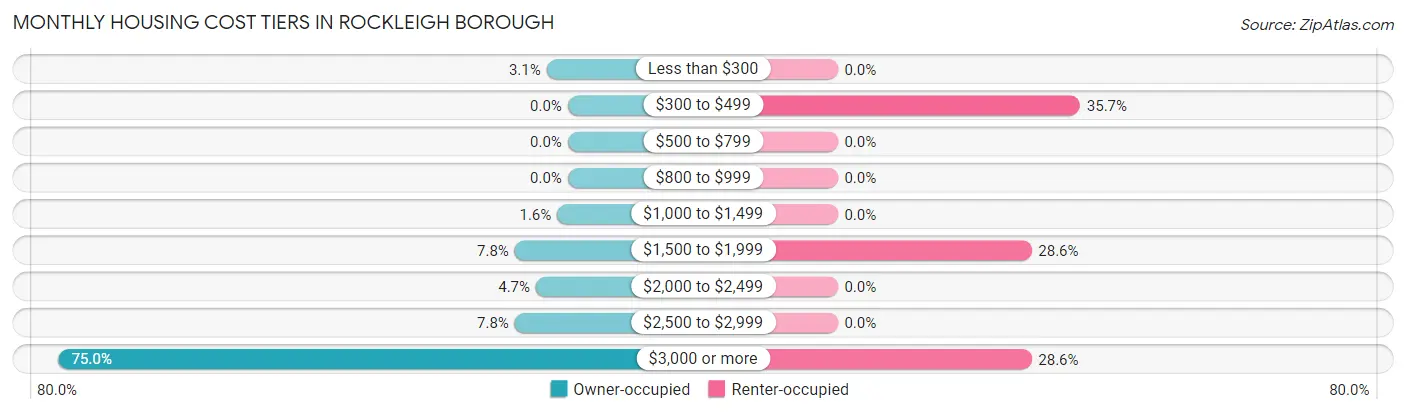
| Monthly Cost | Owner-occupied | Renter-occupied |
| Less than $300 | 2 (3.1%) | 0 (0.0%) |
| $300 to $499 | 0 (0.0%) | 5 (35.7%) |
| $500 to $799 | 0 (0.0%) | 0 (0.0%) |
| $800 to $999 | 0 (0.0%) | 0 (0.0%) |
| $1,000 to $1,499 | 1 (1.6%) | 0 (0.0%) |
| $1,500 to $1,999 | 5 (7.8%) | 4 (28.6%) |
| $2,000 to $2,499 | 3 (4.7%) | 0 (0.0%) |
| $2,500 to $2,999 | 5 (7.8%) | 0 (0.0%) |
| $3,000 or more | 48 (75.0%) | 4 (28.6%) |
| Total | 64 (100.0%) | 14 (100.0%) |
Physical Housing Characteristics in Rockleigh borough
Housing Structures in Rockleigh borough
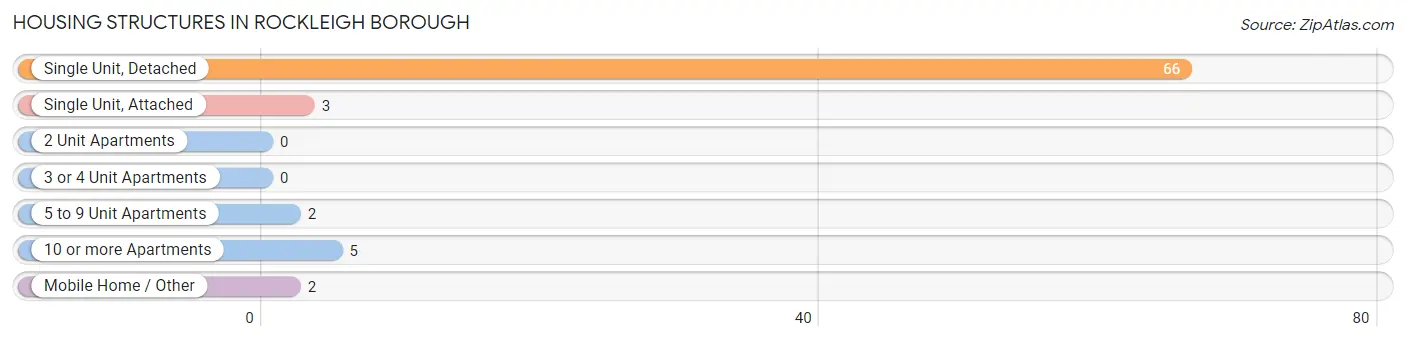
| Structure Type | # Housing Units | % Housing Units |
| Single Unit, Detached | 66 | 84.6% |
| Single Unit, Attached | 3 | 3.8% |
| 2 Unit Apartments | 0 | 0.0% |
| 3 or 4 Unit Apartments | 0 | 0.0% |
| 5 to 9 Unit Apartments | 2 | 2.6% |
| 10 or more Apartments | 5 | 6.4% |
| Mobile Home / Other | 2 | 2.6% |
| Total | 78 | 100.0% |
Housing Structures by Occupancy in Rockleigh borough
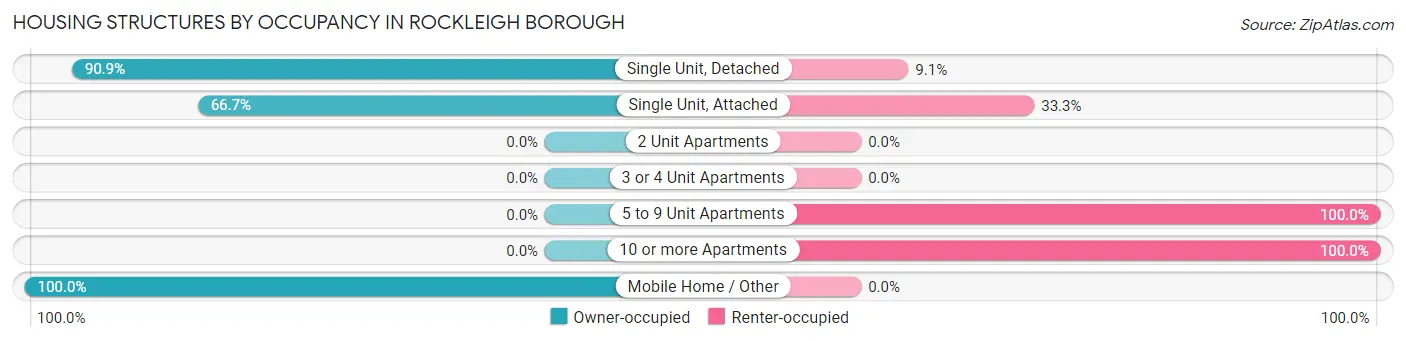
| Structure Type | Owner-occupied | Renter-occupied |
| Single Unit, Detached | 60 (90.9%) | 6 (9.1%) |
| Single Unit, Attached | 2 (66.7%) | 1 (33.3%) |
| 2 Unit Apartments | 0 (0.0%) | 0 (0.0%) |
| 3 or 4 Unit Apartments | 0 (0.0%) | 0 (0.0%) |
| 5 to 9 Unit Apartments | 0 (0.0%) | 2 (100.0%) |
| 10 or more Apartments | 0 (0.0%) | 5 (100.0%) |
| Mobile Home / Other | 2 (100.0%) | 0 (0.0%) |
| Total | 64 (82.1%) | 14 (17.9%) |
Housing Structures by Number of Rooms in Rockleigh borough
| Number of Rooms | Owner-occupied | Renter-occupied |
| 1 Room | 0 (0.0%) | 5 (35.7%) |
| 2 or 3 Rooms | 0 (0.0%) | 0 (0.0%) |
| 4 or 5 Rooms | 14 (21.9%) | 2 (14.3%) |
| 6 or 7 Rooms | 11 (17.2%) | 5 (35.7%) |
| 8 or more Rooms | 39 (60.9%) | 2 (14.3%) |
| Total | 64 (100.0%) | 14 (100.0%) |
Housing Structure by Heating Type in Rockleigh borough
| Heating Type | Owner-occupied | Renter-occupied |
| Utility Gas | 57 (89.1%) | 9 (64.3%) |
| Bottled, Tank, or LP Gas | 1 (1.6%) | 0 (0.0%) |
| Electricity | 6 (9.4%) | 5 (35.7%) |
| Fuel Oil or Kerosene | 0 (0.0%) | 0 (0.0%) |
| Coal or Coke | 0 (0.0%) | 0 (0.0%) |
| All other Fuels | 0 (0.0%) | 0 (0.0%) |
| No Fuel Used | 0 (0.0%) | 0 (0.0%) |
| Total | 64 (100.0%) | 14 (100.0%) |
Household Vehicle Usage in Rockleigh borough
| Vehicles per Household | Owner-occupied | Renter-occupied |
| No Vehicle | 2 (3.1%) | 5 (35.7%) |
| 1 Vehicle | 3 (4.7%) | 1 (7.1%) |
| 2 Vehicles | 34 (53.1%) | 2 (14.3%) |
| 3 or more Vehicles | 25 (39.1%) | 6 (42.9%) |
| Total | 64 (100.0%) | 14 (100.0%) |
Real Estate & Mortgages in Rockleigh borough
Real Estate and Mortgage Overview in Rockleigh borough
| Characteristic | Without Mortgage | With Mortgage |
| Housing Units | 17 | 47 |
| Median Property Value | $2,000,001 | $2,000,001 |
| Median Household Income | - | - |
| Monthly Housing Costs | $1,501 | $44 |
| Real Estate Taxes | $10,001 | $0 |
Property Value by Mortgage Status in Rockleigh borough
| Property Value | Without Mortgage | With Mortgage |
| Less than $50,000 | 0 (0.0%) | 0 (0.0%) |
| $50,000 to $99,999 | 0 (0.0%) | 0 (0.0%) |
| $100,000 to $299,999 | 0 (0.0%) | 0 (0.0%) |
| $300,000 to $499,999 | 2 (11.8%) | 4 (8.5%) |
| $500,000 to $749,999 | 0 (0.0%) | 0 (0.0%) |
| $750,000 to $999,999 | 5 (29.4%) | 1 (2.1%) |
| $1,000,000 or more | 10 (58.8%) | 42 (89.4%) |
| Total | 17 (100.0%) | 47 (100.0%) |
Household Income by Mortgage Status in Rockleigh borough
| Household Income | Without Mortgage | With Mortgage |
| Less than $10,000 | 0 (0.0%) | 0 (0.0%) |
| $10,000 to $24,999 | 0 (0.0%) | 2 (4.3%) |
| $25,000 to $34,999 | 4 (23.5%) | 1 (2.1%) |
| $35,000 to $49,999 | 0 (0.0%) | 0 (0.0%) |
| $50,000 to $74,999 | 2 (11.8%) | 0 (0.0%) |
| $75,000 to $99,999 | 0 (0.0%) | 1 (2.1%) |
| $100,000 to $149,999 | 4 (23.5%) | 2 (4.3%) |
| $150,000 or more | 7 (41.2%) | 11 (23.4%) |
| Total | 17 (100.0%) | 47 (100.0%) |
Property Value to Household Income Ratio in Rockleigh borough
| Value-to-Income Ratio | Without Mortgage | With Mortgage |
| Less than 2.0x | 2 (11.8%) | 250,001 (531,917.0%) |
| 2.0x to 2.9x | 1 (5.9%) | 2 (4.3%) |
| 3.0x to 3.9x | 0 (0.0%) | 7 (14.9%) |
| 4.0x or more | 14 (82.4%) | 7 (14.9%) |
| Total | 17 (100.0%) | 47 (100.0%) |
Real Estate Taxes by Mortgage Status in Rockleigh borough
| Property Taxes | Without Mortgage | With Mortgage |
| Less than $800 | 0 (0.0%) | 0 (0.0%) |
| $800 to $1,499 | 0 (0.0%) | 0 (0.0%) |
| $800 to $1,499 | 15 (88.2%) | 0 (0.0%) |
| Total | 17 (100.0%) | 47 (100.0%) |
Health & Disability in Rockleigh borough
Health Insurance Coverage by Age in Rockleigh borough
| Age Bracket | With Coverage | Without Coverage |
| Under 6 Years | 8 (100.0%) | 0 (0.0%) |
| 6 to 18 Years | 50 (92.6%) | 4 (7.4%) |
| 19 to 25 Years | 16 (100.0%) | 0 (0.0%) |
| 26 to 34 Years | 14 (87.5%) | 2 (12.5%) |
| 35 to 44 Years | 21 (87.5%) | 3 (12.5%) |
| 45 to 54 Years | 56 (93.3%) | 4 (6.7%) |
| 55 to 64 Years | 58 (100.0%) | 0 (0.0%) |
| 65 to 74 Years | 41 (100.0%) | 0 (0.0%) |
| 75 Years and older | 31 (100.0%) | 0 (0.0%) |
| Total | 295 (95.8%) | 13 (4.2%) |
Health Insurance Coverage by Citizenship Status in Rockleigh borough
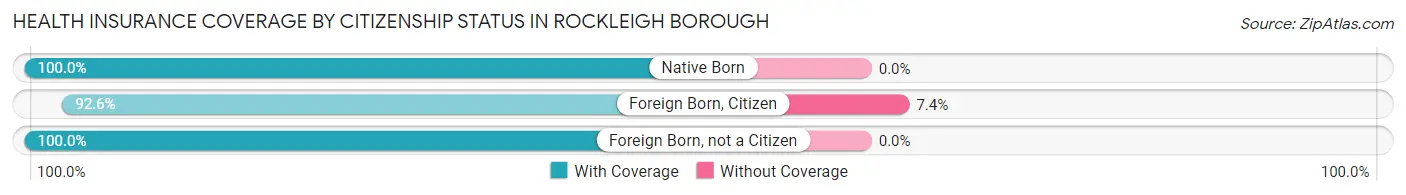
| Citizenship Status | With Coverage | Without Coverage |
| Native Born | 8 (100.0%) | 0 (0.0%) |
| Foreign Born, Citizen | 50 (92.6%) | 4 (7.4%) |
| Foreign Born, not a Citizen | 16 (100.0%) | 0 (0.0%) |
Health Insurance Coverage by Household Income in Rockleigh borough
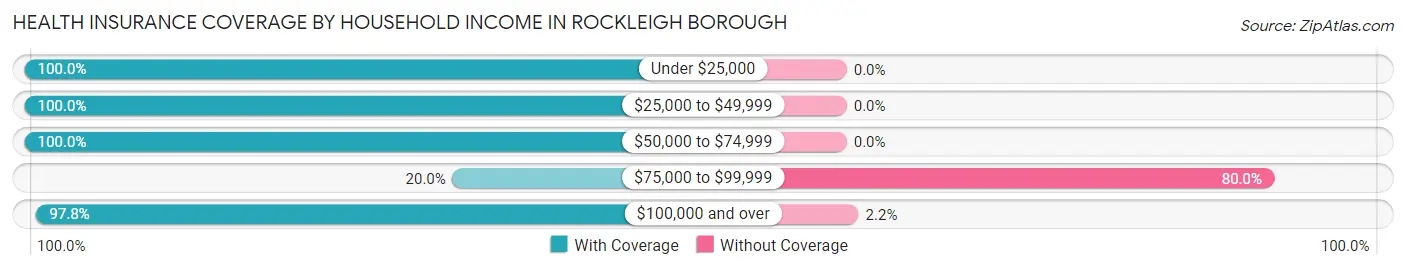
| Household Income | With Coverage | Without Coverage |
| Under $25,000 | 8 (100.0%) | 0 (0.0%) |
| $25,000 to $49,999 | 16 (100.0%) | 0 (0.0%) |
| $50,000 to $74,999 | 9 (100.0%) | 0 (0.0%) |
| $75,000 to $99,999 | 2 (20.0%) | 8 (80.0%) |
| $100,000 and over | 220 (97.8%) | 5 (2.2%) |
Public vs Private Health Insurance Coverage by Age in Rockleigh borough
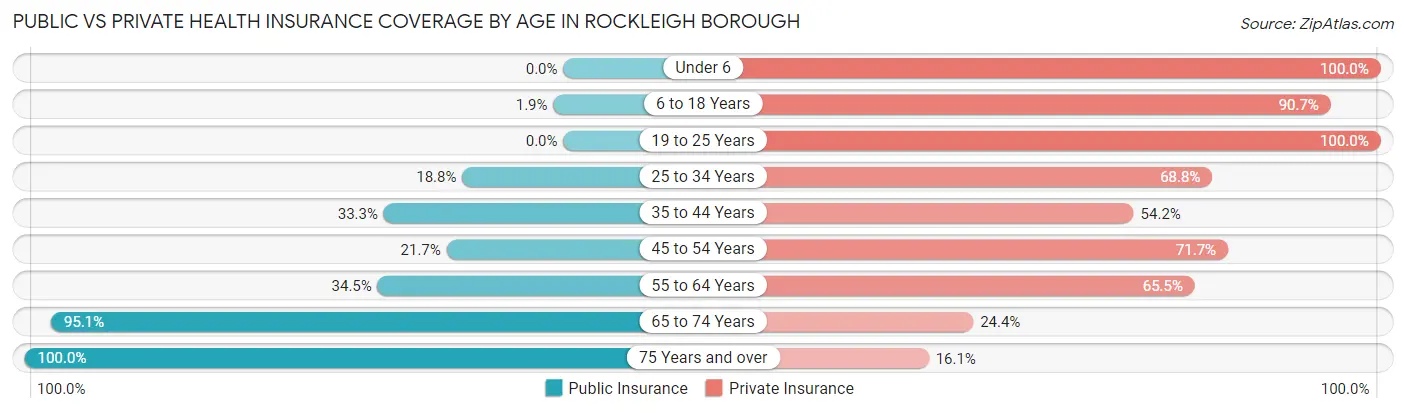
| Age Bracket | Public Insurance | Private Insurance |
| Under 6 | 0 (0.0%) | 8 (100.0%) |
| 6 to 18 Years | 1 (1.8%) | 49 (90.7%) |
| 19 to 25 Years | 0 (0.0%) | 16 (100.0%) |
| 25 to 34 Years | 3 (18.8%) | 11 (68.8%) |
| 35 to 44 Years | 8 (33.3%) | 13 (54.2%) |
| 45 to 54 Years | 13 (21.7%) | 43 (71.7%) |
| 55 to 64 Years | 20 (34.5%) | 38 (65.5%) |
| 65 to 74 Years | 39 (95.1%) | 10 (24.4%) |
| 75 Years and over | 31 (100.0%) | 5 (16.1%) |
| Total | 115 (37.3%) | 193 (62.7%) |
Disability Status by Sex by Age in Rockleigh borough
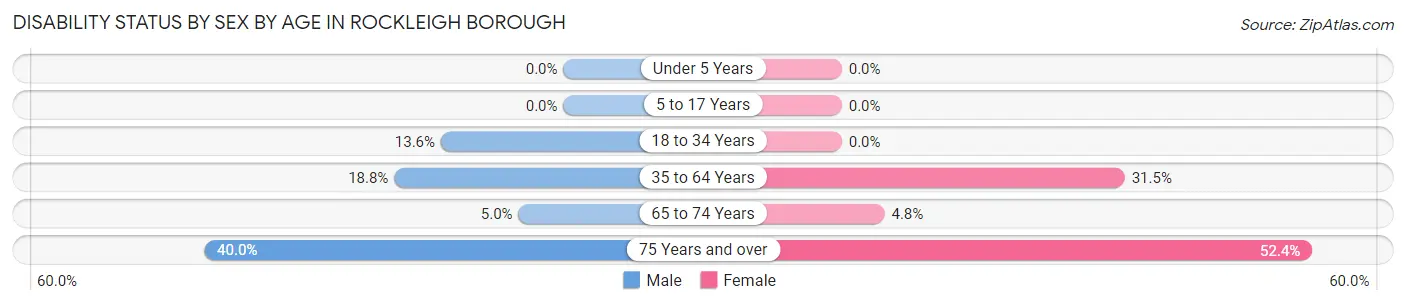
| Age Bracket | Male | Female |
| Under 5 Years | 0 (0.0%) | 0 (0.0%) |
| 5 to 17 Years | 0 (0.0%) | 0 (0.0%) |
| 18 to 34 Years | 3 (13.6%) | 0 (0.0%) |
| 35 to 64 Years | 13 (18.8%) | 23 (31.5%) |
| 65 to 74 Years | 1 (5.0%) | 1 (4.8%) |
| 75 Years and over | 4 (40.0%) | 11 (52.4%) |
Disability Class by Sex by Age in Rockleigh borough
Disability Class: Hearing Difficulty
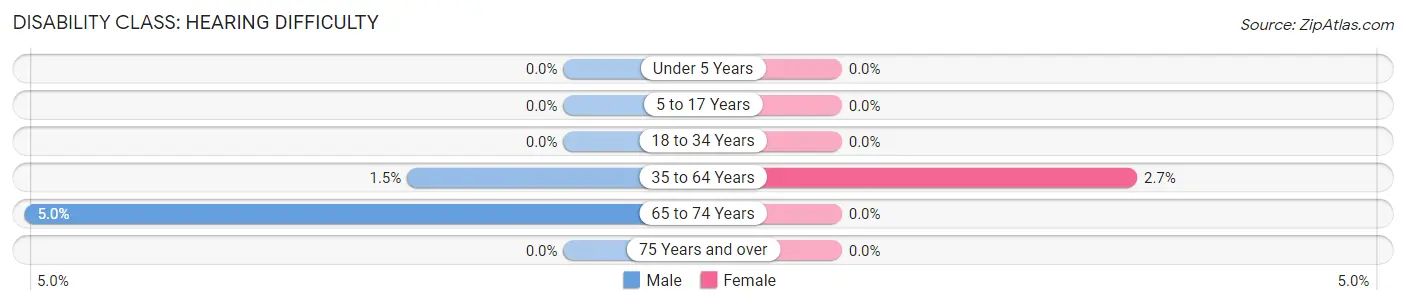
| Age Bracket | Male | Female |
| Under 5 Years | 0 (0.0%) | 0 (0.0%) |
| 5 to 17 Years | 0 (0.0%) | 0 (0.0%) |
| 18 to 34 Years | 0 (0.0%) | 0 (0.0%) |
| 35 to 64 Years | 1 (1.5%) | 2 (2.7%) |
| 65 to 74 Years | 1 (5.0%) | 0 (0.0%) |
| 75 Years and over | 0 (0.0%) | 0 (0.0%) |
Disability Class: Vision Difficulty
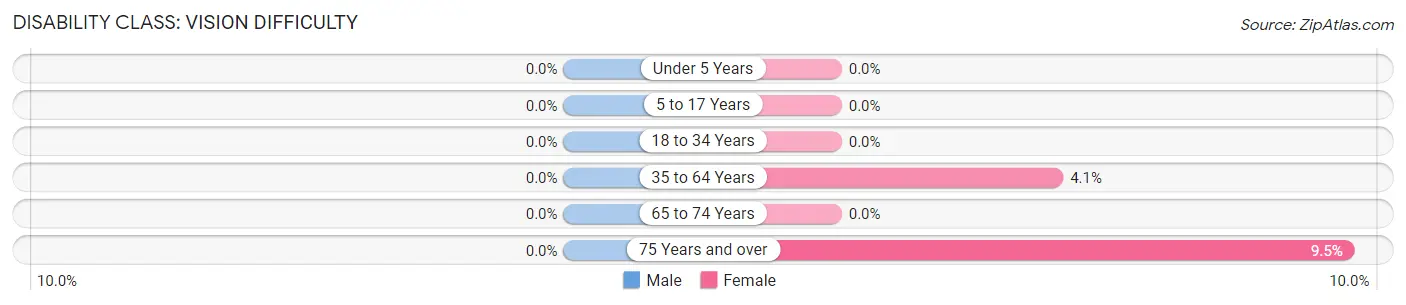
| Age Bracket | Male | Female |
| Under 5 Years | 0 (0.0%) | 0 (0.0%) |
| 5 to 17 Years | 0 (0.0%) | 0 (0.0%) |
| 18 to 34 Years | 0 (0.0%) | 0 (0.0%) |
| 35 to 64 Years | 0 (0.0%) | 3 (4.1%) |
| 65 to 74 Years | 0 (0.0%) | 0 (0.0%) |
| 75 Years and over | 0 (0.0%) | 2 (9.5%) |
Disability Class: Cognitive Difficulty
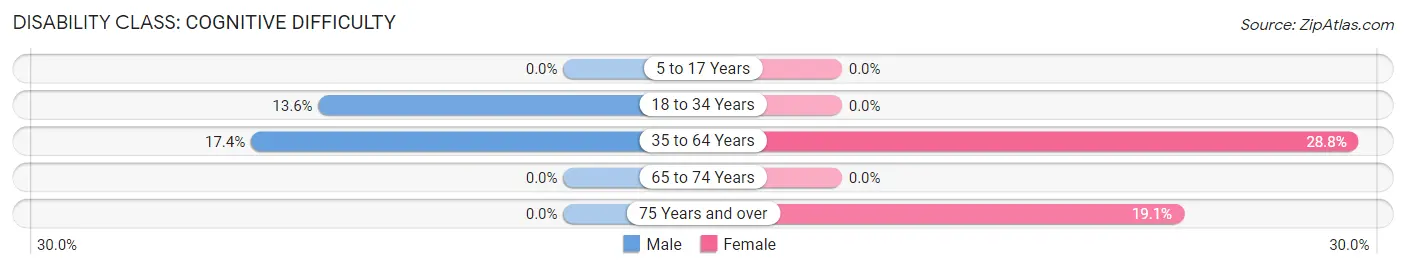
| Age Bracket | Male | Female |
| 5 to 17 Years | 0 (0.0%) | 0 (0.0%) |
| 18 to 34 Years | 3 (13.6%) | 0 (0.0%) |
| 35 to 64 Years | 12 (17.4%) | 21 (28.8%) |
| 65 to 74 Years | 0 (0.0%) | 0 (0.0%) |
| 75 Years and over | 0 (0.0%) | 4 (19.1%) |
Disability Class: Ambulatory Difficulty
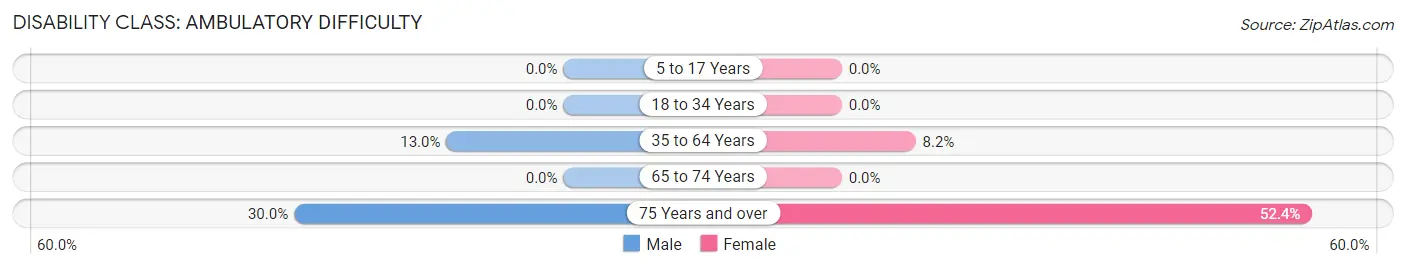
| Age Bracket | Male | Female |
| 5 to 17 Years | 0 (0.0%) | 0 (0.0%) |
| 18 to 34 Years | 0 (0.0%) | 0 (0.0%) |
| 35 to 64 Years | 9 (13.0%) | 6 (8.2%) |
| 65 to 74 Years | 0 (0.0%) | 0 (0.0%) |
| 75 Years and over | 3 (30.0%) | 11 (52.4%) |
Disability Class: Self-Care Difficulty
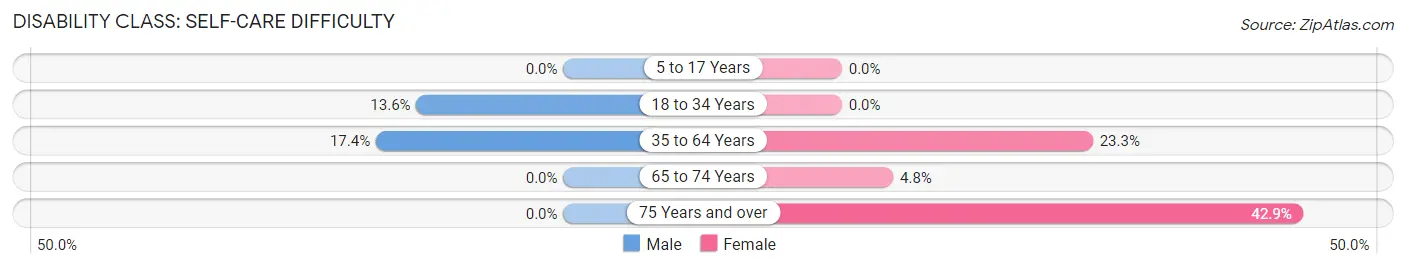
| Age Bracket | Male | Female |
| 5 to 17 Years | 0 (0.0%) | 0 (0.0%) |
| 18 to 34 Years | 3 (13.6%) | 0 (0.0%) |
| 35 to 64 Years | 12 (17.4%) | 17 (23.3%) |
| 65 to 74 Years | 0 (0.0%) | 1 (4.8%) |
| 75 Years and over | 0 (0.0%) | 9 (42.9%) |
Technology Access in Rockleigh borough
Computing Device Access in Rockleigh borough
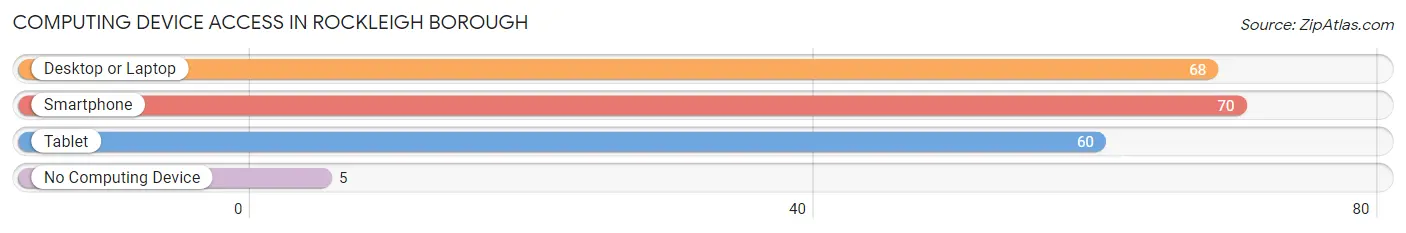
| Device Type | # Households | % Households |
| Desktop or Laptop | 68 | 87.2% |
| Smartphone | 70 | 89.7% |
| Tablet | 60 | 76.9% |
| No Computing Device | 5 | 6.4% |
| Total | 78 | 100.0% |
Internet Access in Rockleigh borough
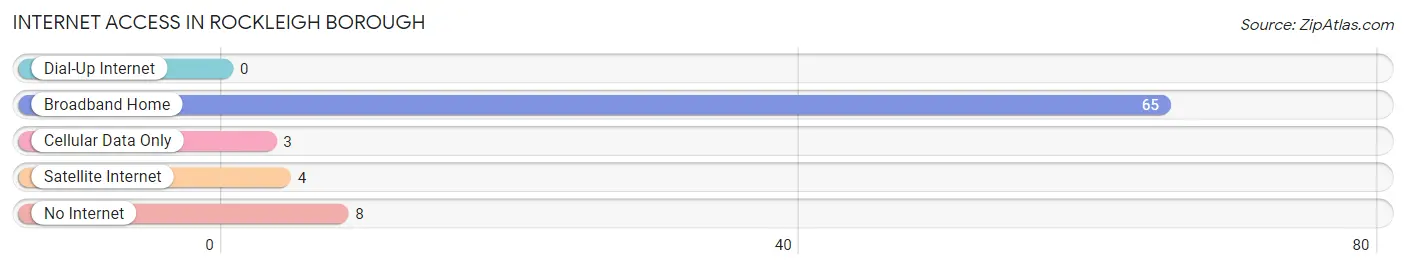
| Internet Type | # Households | % Households |
| Dial-Up Internet | 0 | 0.0% |
| Broadband Home | 65 | 83.3% |
| Cellular Data Only | 3 | 3.8% |
| Satellite Internet | 4 | 5.1% |
| No Internet | 8 | 10.3% |
| Total | 78 | 100.0% |
Rockleigh borough Summary
Rockleigh Borough is a small borough located in Bergen County, New Jersey. It is situated in the northeastern part of the state, just west of the Hudson River and north of the Hackensack River. The borough is bordered by the towns of Alpine, Closter, and Northvale. As of the 2010 United States Census, the borough had a total population of 531.
Geography
Rockleigh Borough is located at 40°57'45" North, 73°59'45" West (40.9625, -73.9958). It has a total area of 0.6 square miles, all of which is land. The borough is located in the Pascack Valley, which is part of the larger New York metropolitan area.
The borough is located in a hilly area, with elevations ranging from about 200 to 400 feet above sea level. The highest point in the borough is located at the intersection of Rockleigh Road and Grand Avenue, at an elevation of about 400 feet. The borough is located in the Hackensack River watershed.
Demographics
As of the 2010 United States Census, there were 531 people, 181 households, and 149 families residing in the borough. The population density was 886.7 people per square mile. There were 191 housing units at an average density of 315.7 per square mile. The racial makeup of the borough was 94.2% White, 0.6% African American, 0.2% Native American, 3.3% Asian, 0.2% from other races, and 1.5% from two or more races. Hispanic or Latino of any race were 4.2% of the population.
There were 181 households, out of which 37.6% had children under the age of 18 living with them, 68.5% were married couples living together, 8.3% had a female householder with no husband present, and 19.9% were non-families. 16.0% of all households were made up of individuals, and 8.3% had someone living alone who was 65 years of age or older. The average household size was 2.93 and the average family size was 3.27.
In the borough, the population was spread out, with 25.7% under the age of 18, 5.7% from 18 to 24, 22.2% from 25 to 44, 32.2% from 45 to 64, and 14.2% who were 65 years of age or older. The median age was 42 years. For every 100 females, there were 97.7 males. For every 100 females age 18 and over, there were 94.3 males.
The median income for a household in the borough was $107,917, and the median income for a family was $118,750. Males had a median income of $76,250 versus $50,000 for females. The per capita income for the borough was $50,945. About 1.2% of families and 1.7% of the population were below the poverty line, including 0.8% of those under age 18 and none of those age 65 or over.
Economy
Rockleigh Borough is a small, affluent community with a strong economy. The borough is home to several businesses, including a number of professional offices, a bank, a pharmacy, a gas station, and a few restaurants. The borough also has a small industrial park, which is home to a few small businesses.
The borough is also home to a number of large corporations, including the headquarters of the pharmaceutical company Merck & Co., the financial services company Prudential Financial, and the telecommunications company Verizon.
The borough is served by the Rockleigh Public School District, which consists of two elementary schools, a middle school, and a high school. The district also operates a number of special education programs.
Conclusion
Rockleigh Borough is a small, affluent borough located in Bergen County, New Jersey. It is situated in the northeastern part of the state, just west of the Hudson River and north of the Hackensack River. The borough has a total population of 531, and is home to several businesses, including a number of professional offices, a bank, a pharmacy, a gas station, and a few restaurants. The borough is also home to a number of large corporations, including the headquarters of the pharmaceutical company Merck & Co., the financial services company Prudential Financial, and the telecommunications company Verizon. The borough is served by the Rockleigh Public School District, which consists of two elementary schools, a middle school, and a high school. The district also operates a number of special education programs.
Common Questions
What is Per Capita Income in Rockleigh borough?
Per Capita income in Rockleigh borough is $61,123.
What is the Median Family Income in Rockleigh borough?
Median Family Income in Rockleigh borough is $226,250.
What is the Median Household income in Rockleigh borough?
Median Household Income in Rockleigh borough is $206,250.
What is Income or Wage Gap in Rockleigh borough?
Income or Wage Gap in Rockleigh borough is 55.4%.
Women in Rockleigh borough earn 44.6 cents for every dollar earned by a man.
What is Inequality or Gini Index in Rockleigh borough?
Inequality or Gini Index in Rockleigh borough is 0.55.
What is the Total Population of Rockleigh borough?
Total Population of Rockleigh borough is 567.
What is the Total Male Population of Rockleigh borough?
Total Male Population of Rockleigh borough is 206.
What is the Total Female Population of Rockleigh borough?
Total Female Population of Rockleigh borough is 361.
What is the Ratio of Males per 100 Females in Rockleigh borough?
There are 57.06 Males per 100 Females in Rockleigh borough.
What is the Ratio of Females per 100 Males in Rockleigh borough?
There are 175.24 Females per 100 Males in Rockleigh borough.
What is the Median Population Age in Rockleigh borough?
Median Population Age in Rockleigh borough is 68.5 Years.
What is the Average Family Size in Rockleigh borough
Average Family Size in Rockleigh borough is 3.3 People.
What is the Average Household Size in Rockleigh borough
Average Household Size in Rockleigh borough is 3.4 People.
How Large is the Labor Force in Rockleigh borough?
There are 121 People in the Labor Forcein in Rockleigh borough.
What is the Percentage of People in the Labor Force in Rockleigh borough?
23.2% of People are in the Labor Force in Rockleigh borough.
What is the Unemployment Rate in Rockleigh borough?
Unemployment Rate in Rockleigh borough is 0.8%.