Ridgewood, NJ Map & Demographics
Ridgewood Map
Ridgewood Overview
$93,733
PER CAPITA INCOME
$244,006
AVG FAMILY INCOME
$211,224
AVG HOUSEHOLD INCOME
51.9%
WAGE / INCOME GAP [ % ]
48.1¢/ $1
WAGE / INCOME GAP [ $ ]
0.45
INEQUALITY / GINI INDEX
26,043
TOTAL POPULATION
13,060
MALE POPULATION
12,983
FEMALE POPULATION
100.59
MALES / 100 FEMALES
99.41
FEMALES / 100 MALES
40.7
MEDIAN AGE
3.4
AVG FAMILY SIZE
3.0
AVG HOUSEHOLD SIZE
12,917
LABOR FORCE [ PEOPLE ]
65.7%
PERCENT IN LABOR FORCE
3.8%
UNEMPLOYMENT RATE
Ridgewood Zip Codes
Ridgewood Area Codes
Income in Ridgewood
Income Overview in Ridgewood
Per Capita Income in Ridgewood is $93,733, while median incomes of families and households are $244,006 and $211,224 respectively.
| Characteristic | Number | Measure |
| Per Capita Income | 26,043 | $93,733 |
| Median Family Income | 6,944 | $244,006 |
| Mean Family Income | 6,944 | $314,207 |
| Median Household Income | 8,692 | $211,224 |
| Mean Household Income | 8,692 | $277,428 |
| Income Deficit | 6,944 | $0 |
| Wage / Income Gap (%) | 26,043 | 51.93% |
| Wage / Income Gap ($) | 26,043 | 48.07¢ per $1 |
| Gini / Inequality Index | 26,043 | 0.45 |
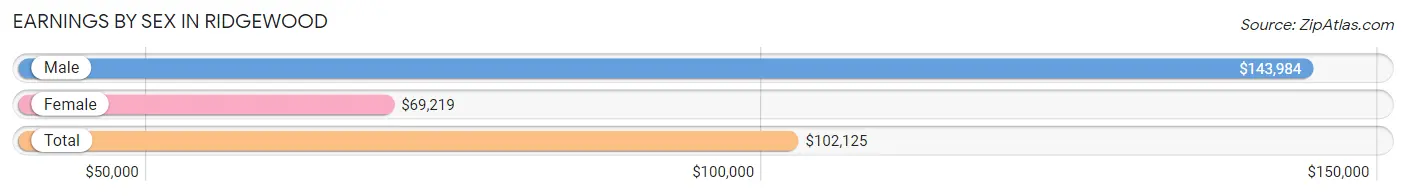
Earnings by Sex in Ridgewood
Average Earnings in Ridgewood are $102,125, $143,984 for men and $69,219 for women, a difference of 51.9%.
| Sex | Number | Average Earnings |
| Male | 7,795 (57.2%) | $143,984 |
| Female | 5,823 (42.8%) | $69,219 |
| Total | 13,618 (100.0%) | $102,125 |
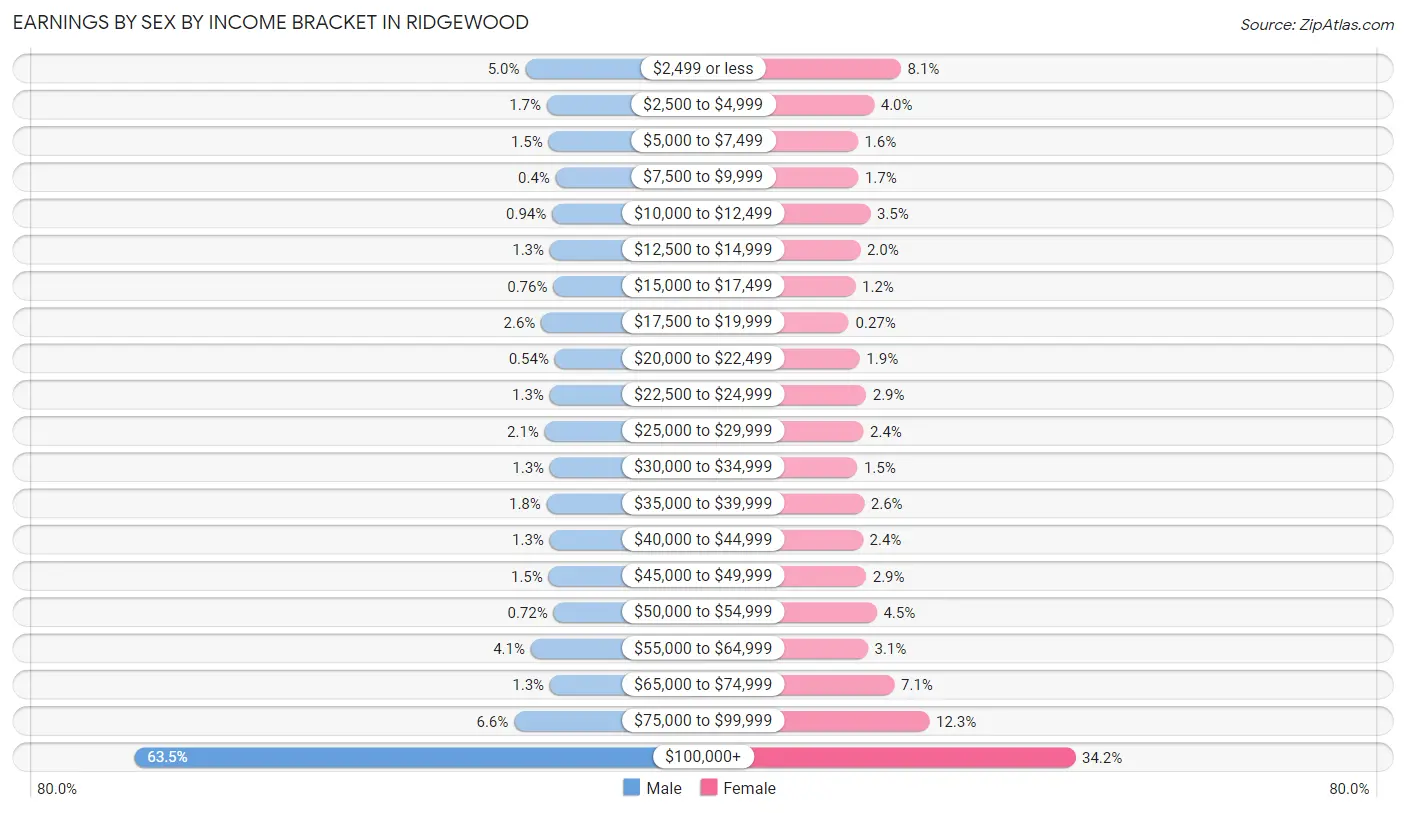
Earnings by Sex by Income Bracket in Ridgewood
The most common earnings brackets in Ridgewood are $100,000+ for men (4,953 | 63.5%) and $100,000+ for women (1,992 | 34.2%).
| Income | Male | Female |
| $2,499 or less | 386 (5.0%) | 470 (8.1%) |
| $2,500 to $4,999 | 134 (1.7%) | 235 (4.0%) |
| $5,000 to $7,499 | 114 (1.5%) | 93 (1.6%) |
| $7,500 to $9,999 | 31 (0.4%) | 97 (1.7%) |
| $10,000 to $12,499 | 73 (0.9%) | 202 (3.5%) |
| $12,500 to $14,999 | 99 (1.3%) | 115 (2.0%) |
| $15,000 to $17,499 | 59 (0.8%) | 72 (1.2%) |
| $17,500 to $19,999 | 200 (2.6%) | 16 (0.3%) |
| $20,000 to $22,499 | 42 (0.5%) | 110 (1.9%) |
| $22,500 to $24,999 | 101 (1.3%) | 166 (2.9%) |
| $25,000 to $29,999 | 160 (2.1%) | 142 (2.4%) |
| $30,000 to $34,999 | 98 (1.3%) | 89 (1.5%) |
| $35,000 to $39,999 | 137 (1.8%) | 149 (2.6%) |
| $40,000 to $44,999 | 101 (1.3%) | 138 (2.4%) |
| $45,000 to $49,999 | 114 (1.5%) | 166 (2.9%) |
| $50,000 to $54,999 | 56 (0.7%) | 259 (4.4%) |
| $55,000 to $64,999 | 322 (4.1%) | 181 (3.1%) |
| $65,000 to $74,999 | 98 (1.3%) | 413 (7.1%) |
| $75,000 to $99,999 | 517 (6.6%) | 718 (12.3%) |
| $100,000+ | 4,953 (63.5%) | 1,992 (34.2%) |
| Total | 7,795 (100.0%) | 5,823 (100.0%) |
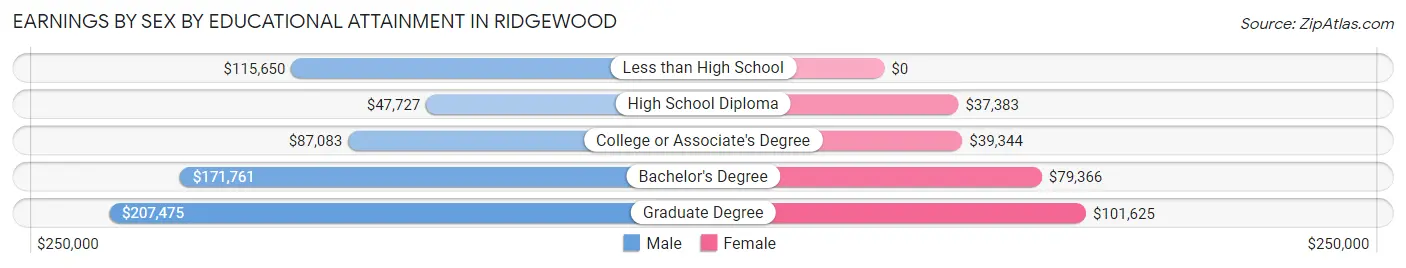
Earnings by Sex by Educational Attainment in Ridgewood
Average earnings in Ridgewood are $170,021 for men and $79,728 for women, a difference of 53.1%. Men with an educational attainment of graduate degree enjoy the highest average annual earnings of $207,475, while those with high school diploma education earn the least with $47,727. Women with an educational attainment of graduate degree earn the most with the average annual earnings of $101,625, while those with high school diploma education have the smallest earnings of $37,383.
| Educational Attainment | Male Income | Female Income |
| Less than High School | $115,650 | $0 |
| High School Diploma | $47,727 | $37,383 |
| College or Associate's Degree | $87,083 | $39,344 |
| Bachelor's Degree | $171,761 | $79,366 |
| Graduate Degree | $207,475 | $101,625 |
| Total | $170,021 | $79,728 |
Family Income in Ridgewood
Family Income Brackets in Ridgewood
According to the Ridgewood family income data, there are 4,340 families falling into the $200,000+ income range, which is the most common income bracket and makes up 62.5% of all families. Conversely, the $10,000 to $14,999 income bracket is the least frequent group with only 7 families (0.1%) belonging to this category.
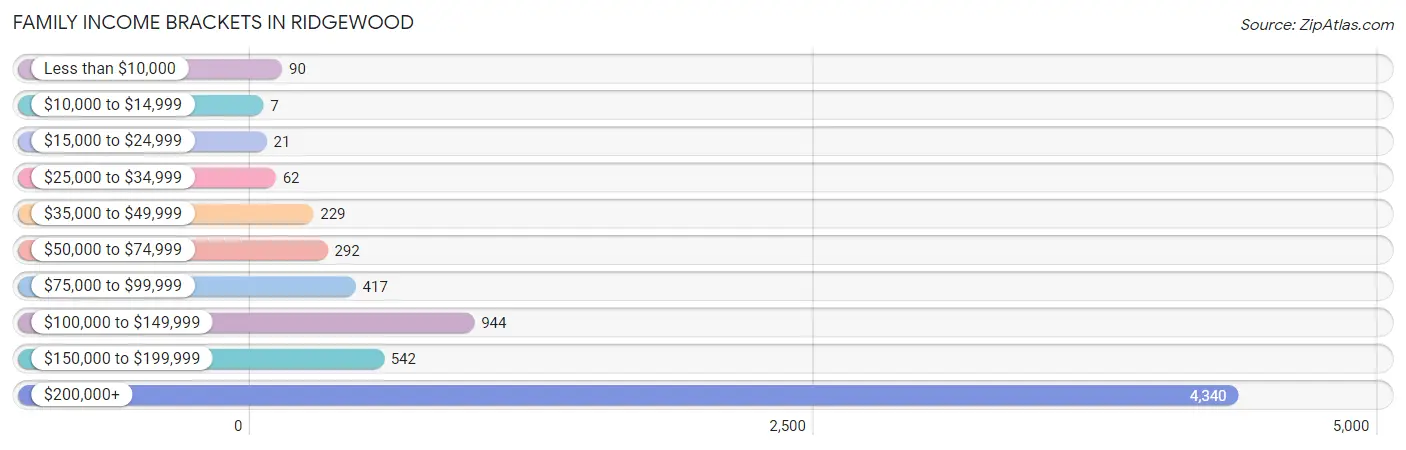
| Income Bracket | # Families | % Families |
| Less than $10,000 | 90 | 1.3% |
| $10,000 to $14,999 | 7 | 0.1% |
| $15,000 to $24,999 | 21 | 0.3% |
| $25,000 to $34,999 | 62 | 0.9% |
| $35,000 to $49,999 | 229 | 3.3% |
| $50,000 to $74,999 | 292 | 4.2% |
| $75,000 to $99,999 | 417 | 6.0% |
| $100,000 to $149,999 | 944 | 13.6% |
| $150,000 to $199,999 | 542 | 7.8% |
| $200,000+ | 4,340 | 62.5% |
Family Income by Famaliy Size in Ridgewood
4-person families (1,984 | 28.6%) account for the highest median family income in Ridgewood with $250,001 per family, while 2-person families (2,542 | 36.6%) have the highest median income of $89,853 per family member.
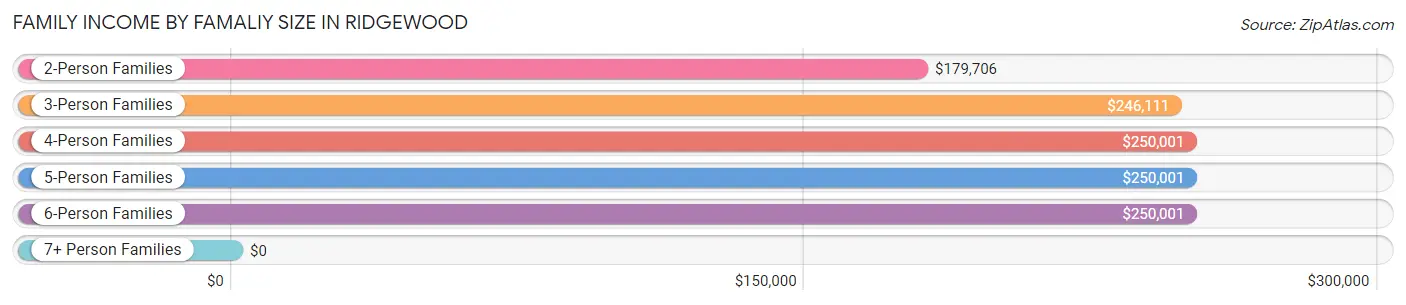
| Income Bracket | # Families | Median Income |
| 2-Person Families | 2,542 (36.6%) | $179,706 |
| 3-Person Families | 1,374 (19.8%) | $246,111 |
| 4-Person Families | 1,984 (28.6%) | $250,001 |
| 5-Person Families | 740 (10.7%) | $250,001 |
| 6-Person Families | 276 (4.0%) | $250,001 |
| 7+ Person Families | 28 (0.4%) | $0 |
| Total | 6,944 (100.0%) | $244,006 |
Family Income by Number of Earners in Ridgewood
The median family income in Ridgewood is $244,006, with families comprising 2 earners (3,071) having the highest median family income of $250,001, while families with no earners (608) have the lowest median family income of $88,587, accounting for 44.2% and 8.8% of families, respectively.
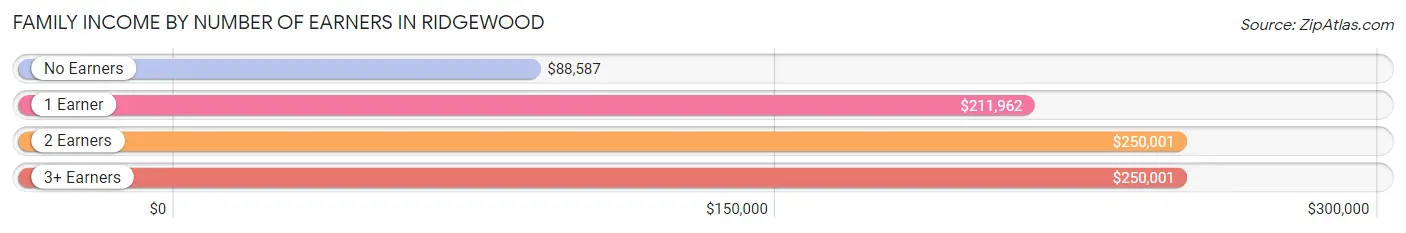
| Number of Earners | # Families | Median Income |
| No Earners | 608 (8.8%) | $88,587 |
| 1 Earner | 2,398 (34.5%) | $211,962 |
| 2 Earners | 3,071 (44.2%) | $250,001 |
| 3+ Earners | 867 (12.5%) | $250,001 |
| Total | 6,944 (100.0%) | $244,006 |
Household Income in Ridgewood
Household Income Brackets in Ridgewood
With 4,572 households falling in the category, the $200,000+ income range is the most frequent in Ridgewood, accounting for 52.6% of all households. In contrast, only 52 households (0.6%) fall into the $10,000 to $14,999 income bracket, making it the least populous group.
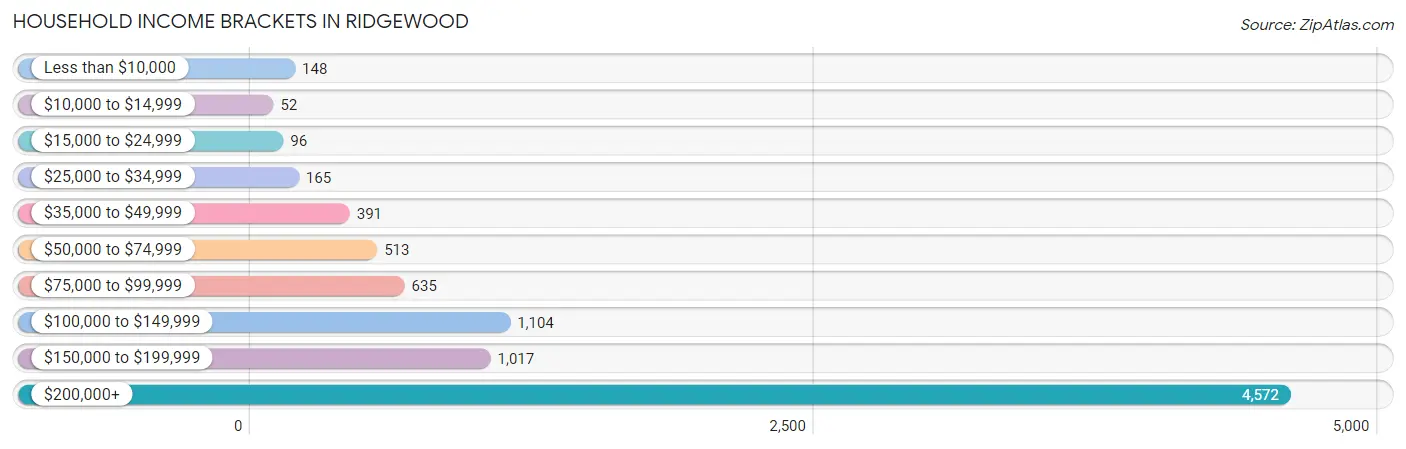
| Income Bracket | # Households | % Households |
| Less than $10,000 | 148 | 1.7% |
| $10,000 to $14,999 | 52 | 0.6% |
| $15,000 to $24,999 | 96 | 1.1% |
| $25,000 to $34,999 | 165 | 1.9% |
| $35,000 to $49,999 | 391 | 4.5% |
| $50,000 to $74,999 | 513 | 5.9% |
| $75,000 to $99,999 | 635 | 7.3% |
| $100,000 to $149,999 | 1,104 | 12.7% |
| $150,000 to $199,999 | 1,017 | 11.7% |
| $200,000+ | 4,572 | 52.6% |
Household Income by Householder Age in Ridgewood
The median household income in Ridgewood is $211,224, with the highest median household income of $240,625 found in the 25 to 44 years age bracket for the primary householder. A total of 2,240 households (25.8%) fall into this category. Meanwhile, the 15 to 24 years age bracket for the primary householder has the lowest median household income of $0, with 31 households (0.4%) in this group.
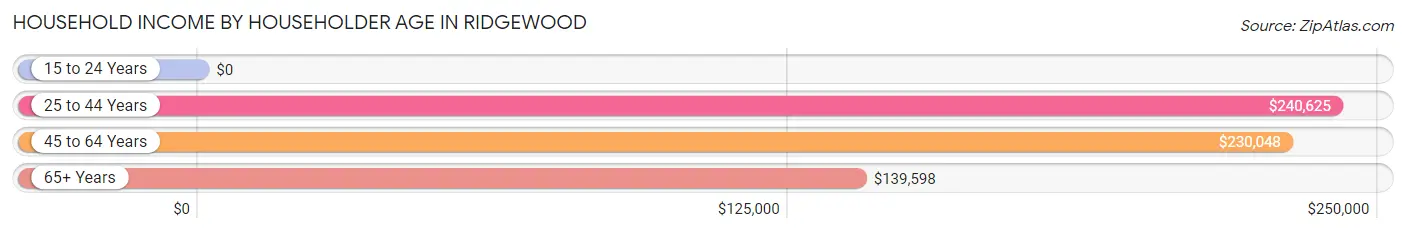
| Income Bracket | # Households | Median Income |
| 15 to 24 Years | 31 (0.4%) | $0 |
| 25 to 44 Years | 2,240 (25.8%) | $240,625 |
| 45 to 64 Years | 4,516 (52.0%) | $230,048 |
| 65+ Years | 1,905 (21.9%) | $139,598 |
| Total | 8,692 (100.0%) | $211,224 |
Poverty in Ridgewood
Income Below Poverty by Sex and Age in Ridgewood
With 1.9% poverty level for males and 2.9% for females among the residents of Ridgewood, 75 year old and over males and 75 year old and over females are the most vulnerable to poverty, with 48 males (6.8%) and 97 females (12.8%) in their respective age groups living below the poverty level.
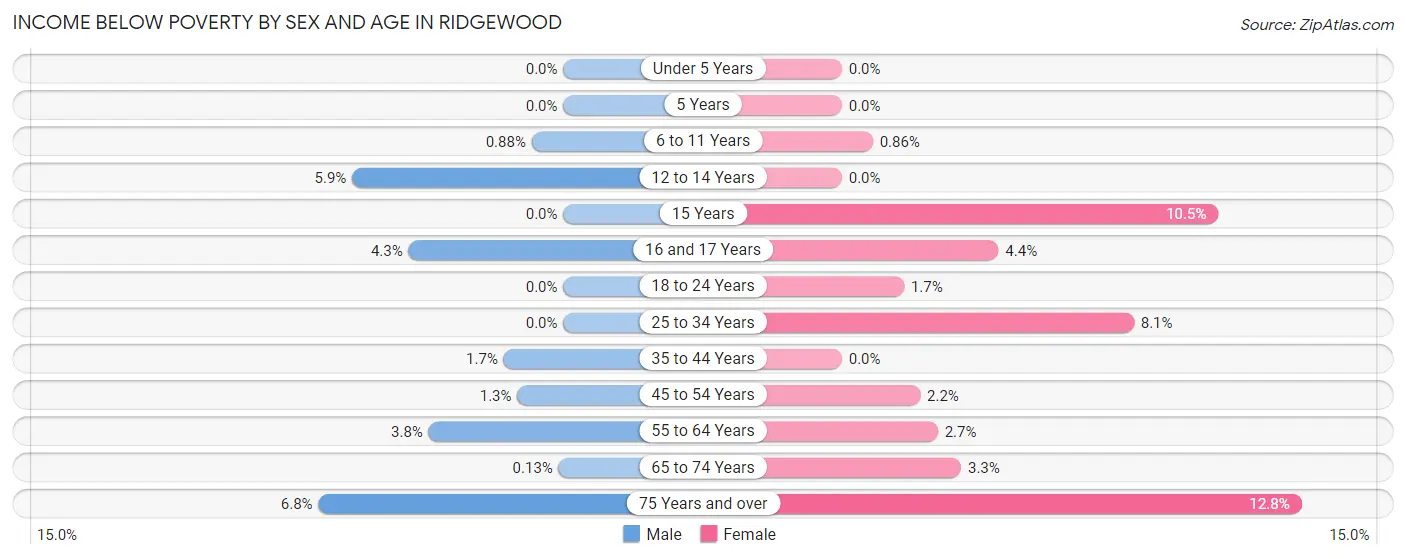
| Age Bracket | Male | Female |
| Under 5 Years | 0 (0.0%) | 0 (0.0%) |
| 5 Years | 0 (0.0%) | 0 (0.0%) |
| 6 to 11 Years | 12 (0.9%) | 10 (0.9%) |
| 12 to 14 Years | 36 (5.9%) | 0 (0.0%) |
| 15 Years | 0 (0.0%) | 22 (10.5%) |
| 16 and 17 Years | 26 (4.3%) | 22 (4.4%) |
| 18 to 24 Years | 0 (0.0%) | 17 (1.7%) |
| 25 to 34 Years | 0 (0.0%) | 75 (8.1%) |
| 35 to 44 Years | 25 (1.7%) | 0 (0.0%) |
| 45 to 54 Years | 33 (1.3%) | 51 (2.2%) |
| 55 to 64 Years | 64 (3.7%) | 43 (2.7%) |
| 65 to 74 Years | 1 (0.1%) | 36 (3.3%) |
| 75 Years and over | 48 (6.8%) | 97 (12.8%) |
| Total | 245 (1.9%) | 373 (2.9%) |
Income Above Poverty by Sex and Age in Ridgewood
According to the poverty statistics in Ridgewood, males aged under 5 years and females aged under 5 years are the age groups that are most secure financially, with 100.0% of males and 100.0% of females in these age groups living above the poverty line.
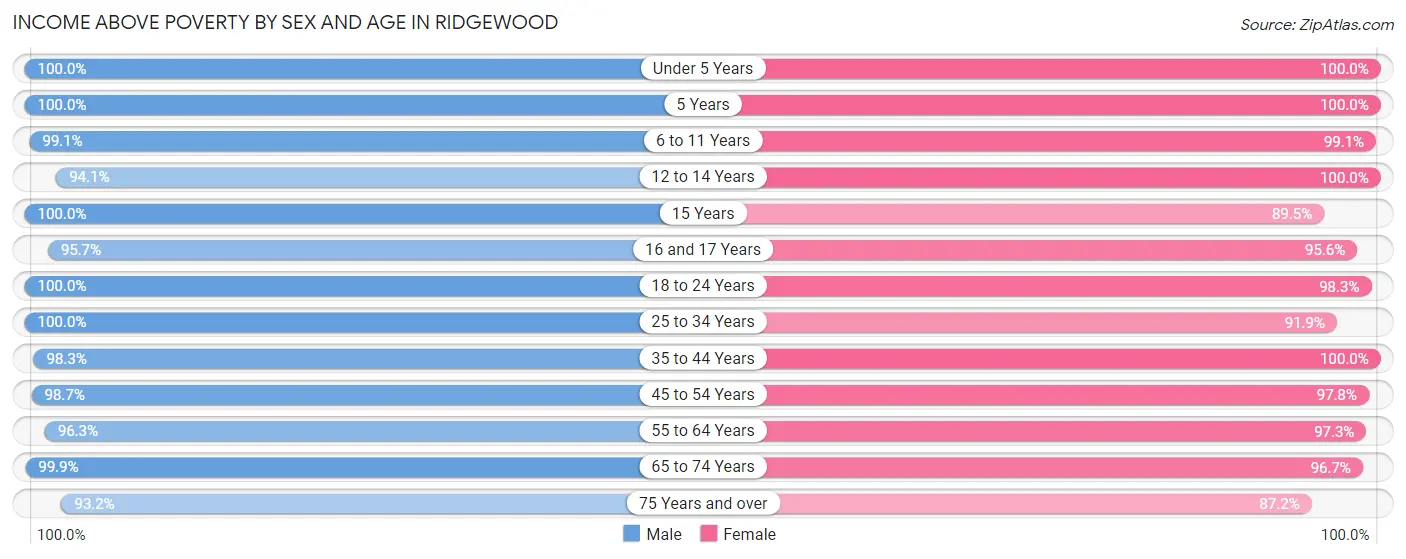
| Age Bracket | Male | Female |
| Under 5 Years | 866 (100.0%) | 629 (100.0%) |
| 5 Years | 295 (100.0%) | 147 (100.0%) |
| 6 to 11 Years | 1,353 (99.1%) | 1,154 (99.1%) |
| 12 to 14 Years | 576 (94.1%) | 884 (100.0%) |
| 15 Years | 209 (100.0%) | 188 (89.5%) |
| 16 and 17 Years | 577 (95.7%) | 483 (95.6%) |
| 18 to 24 Years | 844 (100.0%) | 963 (98.3%) |
| 25 to 34 Years | 912 (100.0%) | 847 (91.9%) |
| 35 to 44 Years | 1,485 (98.3%) | 1,676 (100.0%) |
| 45 to 54 Years | 2,542 (98.7%) | 2,293 (97.8%) |
| 55 to 64 Years | 1,643 (96.3%) | 1,568 (97.3%) |
| 65 to 74 Years | 772 (99.9%) | 1,047 (96.7%) |
| 75 Years and over | 656 (93.2%) | 661 (87.2%) |
| Total | 12,730 (98.1%) | 12,540 (97.1%) |
Income Below Poverty Among Married-Couple Families in Ridgewood
The poverty statistics for married-couple families in Ridgewood show that 0.1% or 8 of the total 5,960 families live below the poverty line. Families with 1 or 2 children have the highest poverty rate of 0.3%, comprising of 8 families. On the other hand, families with no children have the lowest poverty rate of 0.0%, which includes 0 families.
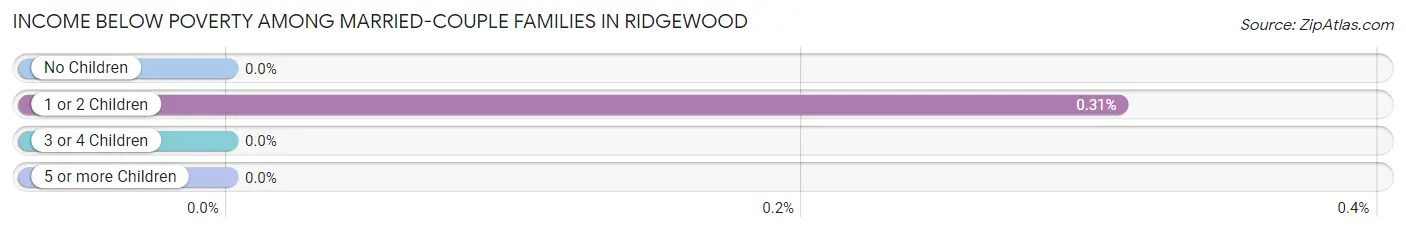
| Children | Above Poverty | Below Poverty |
| No Children | 2,623 (100.0%) | 0 (0.0%) |
| 1 or 2 Children | 2,538 (99.7%) | 8 (0.3%) |
| 3 or 4 Children | 782 (100.0%) | 0 (0.0%) |
| 5 or more Children | 9 (100.0%) | 0 (0.0%) |
| Total | 5,952 (99.9%) | 8 (0.1%) |
Income Below Poverty Among Single-Parent Households in Ridgewood
According to the poverty data in Ridgewood, 8.9% or 18 single-father households and 10.5% or 82 single-mother households are living below the poverty line. Among single-father households, those with 1 or 2 children have the highest poverty rate, with 18 households (25.4%) experiencing poverty. Likewise, among single-mother households, those with 3 or 4 children have the highest poverty rate, with 10 households (27.8%) falling below the poverty line.
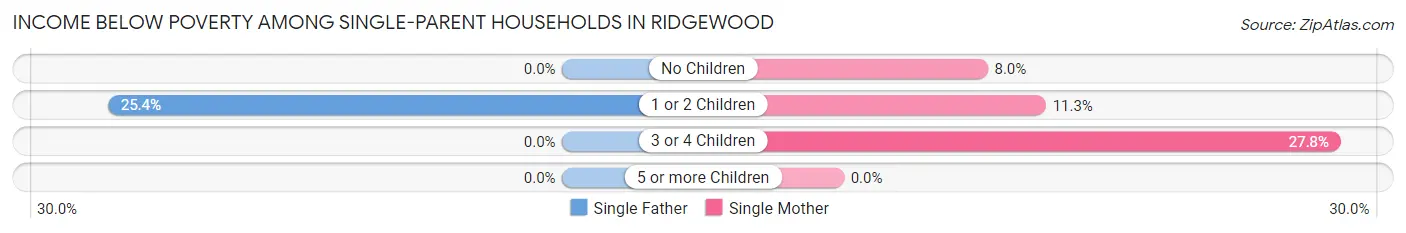
| Children | Single Father | Single Mother |
| No Children | 0 (0.0%) | 30 (8.0%) |
| 1 or 2 Children | 18 (25.4%) | 42 (11.3%) |
| 3 or 4 Children | 0 (0.0%) | 10 (27.8%) |
| 5 or more Children | 0 (0.0%) | 0 (0.0%) |
| Total | 18 (8.9%) | 82 (10.5%) |
Income Below Poverty Among Married-Couple vs Single-Parent Households in Ridgewood
The poverty data for Ridgewood shows that 8 of the married-couple family households (0.1%) and 100 of the single-parent households (10.2%) are living below the poverty level. Within the married-couple family households, those with 1 or 2 children have the highest poverty rate, with 8 households (0.3%) falling below the poverty line. Among the single-parent households, those with 3 or 4 children have the highest poverty rate, with 10 household (15.9%) living below poverty.
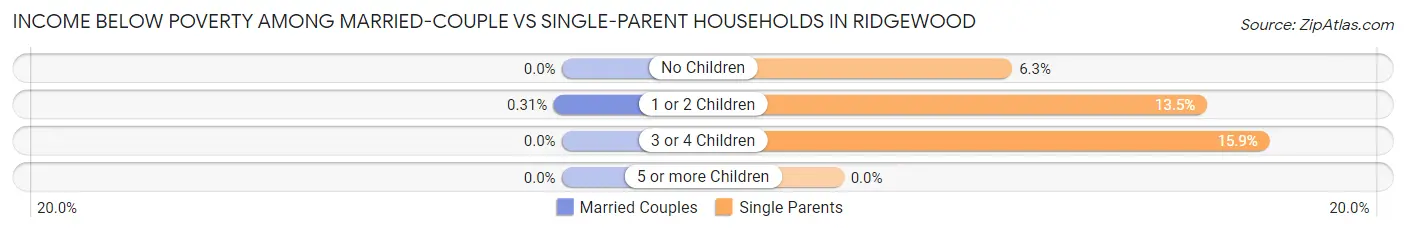
| Children | Married-Couple Families | Single-Parent Households |
| No Children | 0 (0.0%) | 30 (6.3%) |
| 1 or 2 Children | 8 (0.3%) | 60 (13.5%) |
| 3 or 4 Children | 0 (0.0%) | 10 (15.9%) |
| 5 or more Children | 0 (0.0%) | 0 (0.0%) |
| Total | 8 (0.1%) | 100 (10.2%) |
Race in Ridgewood
The most populous races in Ridgewood are White / Caucasian (19,228 | 73.8%), Asian (4,027 | 15.5%), and Hispanic or Latino (2,087 | 8.0%).
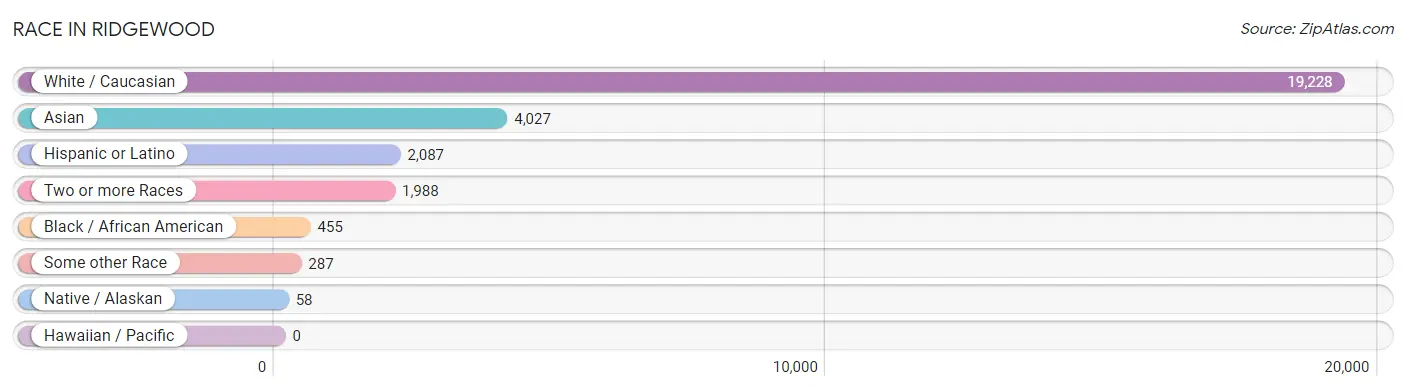
| Race | # Population | % Population |
| Asian | 4,027 | 15.5% |
| Black / African American | 455 | 1.8% |
| Hawaiian / Pacific | 0 | 0.0% |
| Hispanic or Latino | 2,087 | 8.0% |
| Native / Alaskan | 58 | 0.2% |
| White / Caucasian | 19,228 | 73.8% |
| Two or more Races | 1,988 | 7.6% |
| Some other Race | 287 | 1.1% |
| Total | 26,043 | 100.0% |
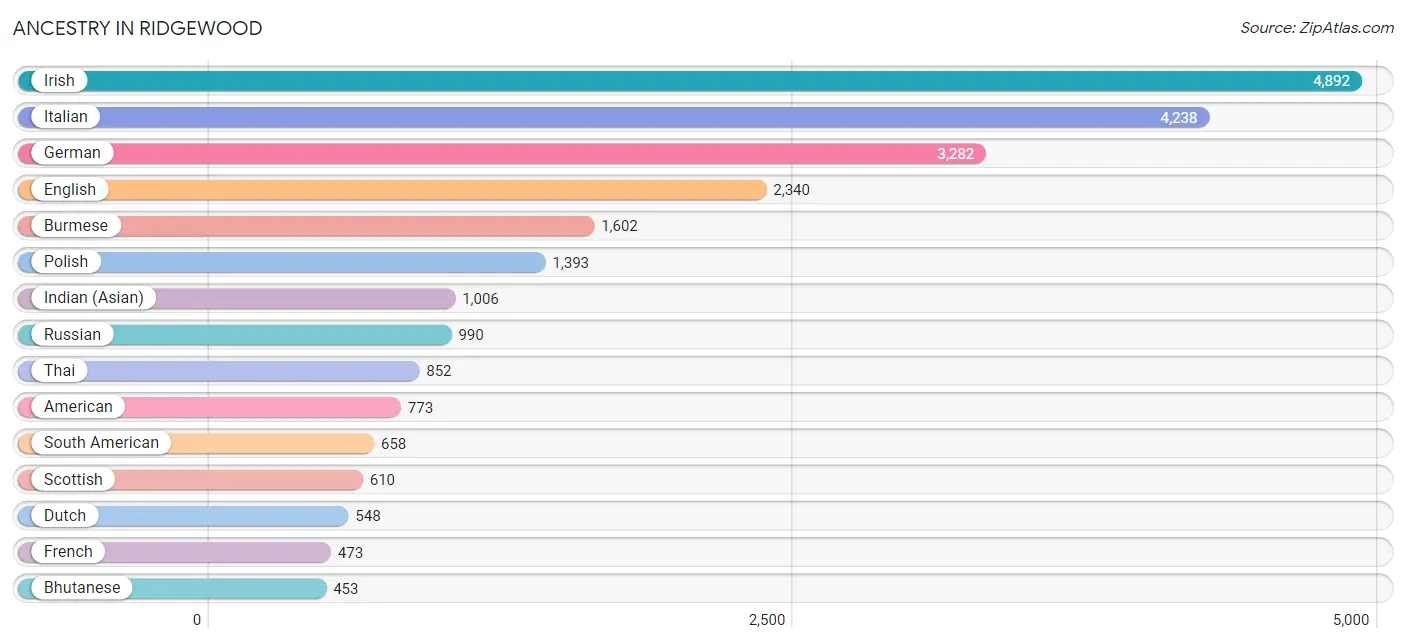
Ancestry in Ridgewood
The most populous ancestries reported in Ridgewood are Irish (4,892 | 18.8%), Italian (4,238 | 16.3%), German (3,282 | 12.6%), English (2,340 | 9.0%), and Burmese (1,602 | 6.1%), together accounting for 62.8% of all Ridgewood residents.
| Ancestry | # Population | % Population |
| African | 5 | 0.0% |
| Albanian | 41 | 0.2% |
| American | 773 | 3.0% |
| Arab | 417 | 1.6% |
| Argentinean | 157 | 0.6% |
| Armenian | 274 | 1.1% |
| Australian | 22 | 0.1% |
| Austrian | 178 | 0.7% |
| Basque | 15 | 0.1% |
| Belgian | 8 | 0.0% |
| Bhutanese | 453 | 1.7% |
| Bolivian | 54 | 0.2% |
| Brazilian | 38 | 0.2% |
| British | 310 | 1.2% |
| Bulgarian | 143 | 0.5% |
| Burmese | 1,602 | 6.1% |
| Canadian | 298 | 1.1% |
| Celtic | 9 | 0.0% |
| Central American | 109 | 0.4% |
| Cherokee | 2 | 0.0% |
| Cheyenne | 41 | 0.2% |
| Choctaw | 79 | 0.3% |
| Colombian | 157 | 0.6% |
| Croatian | 64 | 0.3% |
| Cuban | 381 | 1.5% |
| Czech | 65 | 0.3% |
| Czechoslovakian | 36 | 0.1% |
| Danish | 20 | 0.1% |
| Dutch | 548 | 2.1% |
| Eastern European | 421 | 1.6% |
| Ecuadorian | 102 | 0.4% |
| Egyptian | 4 | 0.0% |
| English | 2,340 | 9.0% |
| European | 354 | 1.4% |
| Filipino | 62 | 0.2% |
| Finnish | 67 | 0.3% |
| French | 473 | 1.8% |
| French Canadian | 69 | 0.3% |
| German | 3,282 | 12.6% |
| Ghanaian | 169 | 0.6% |
| Greek | 399 | 1.5% |
| Guamanian / Chamorro | 12 | 0.1% |
| Guatemalan | 7 | 0.0% |
| Guyanese | 14 | 0.1% |
| Haitian | 9 | 0.0% |
| Hungarian | 78 | 0.3% |
| Indian (Asian) | 1,006 | 3.9% |
| Iranian | 91 | 0.4% |
| Irish | 4,892 | 18.8% |
| Israeli | 14 | 0.1% |
| Italian | 4,238 | 16.3% |
| Jamaican | 65 | 0.3% |
| Japanese | 24 | 0.1% |
| Korean | 175 | 0.7% |
| Latvian | 26 | 0.1% |
| Lebanese | 385 | 1.5% |
| Lithuanian | 89 | 0.3% |
| Maltese | 16 | 0.1% |
| Mexican | 357 | 1.4% |
| Mexican American Indian | 34 | 0.1% |
| Native Hawaiian | 9 | 0.0% |
| Northern European | 19 | 0.1% |
| Norwegian | 277 | 1.1% |
| Okinawan | 26 | 0.1% |
| Pakistani | 83 | 0.3% |
| Palestinian | 5 | 0.0% |
| Panamanian | 27 | 0.1% |
| Peruvian | 133 | 0.5% |
| Polish | 1,393 | 5.3% |
| Portuguese | 60 | 0.2% |
| Puerto Rican | 392 | 1.5% |
| Romanian | 72 | 0.3% |
| Russian | 990 | 3.8% |
| Salvadoran | 75 | 0.3% |
| Scandinavian | 27 | 0.1% |
| Scotch-Irish | 136 | 0.5% |
| Scottish | 610 | 2.3% |
| Serbian | 75 | 0.3% |
| Sierra Leonean | 10 | 0.0% |
| Slavic | 20 | 0.1% |
| Slovak | 27 | 0.1% |
| Slovene | 28 | 0.1% |
| South American | 658 | 2.5% |
| South American Indian | 9 | 0.0% |
| Spaniard | 61 | 0.2% |
| Spanish | 79 | 0.3% |
| Sri Lankan | 100 | 0.4% |
| Subsaharan African | 184 | 0.7% |
| Swedish | 256 | 1.0% |
| Swiss | 50 | 0.2% |
| Syrian | 23 | 0.1% |
| Thai | 852 | 3.3% |
| Turkish | 23 | 0.1% |
| Ukrainian | 414 | 1.6% |
| Venezuelan | 55 | 0.2% |
| Welsh | 58 | 0.2% |
| West Indian | 12 | 0.1% | View All 97 Rows |
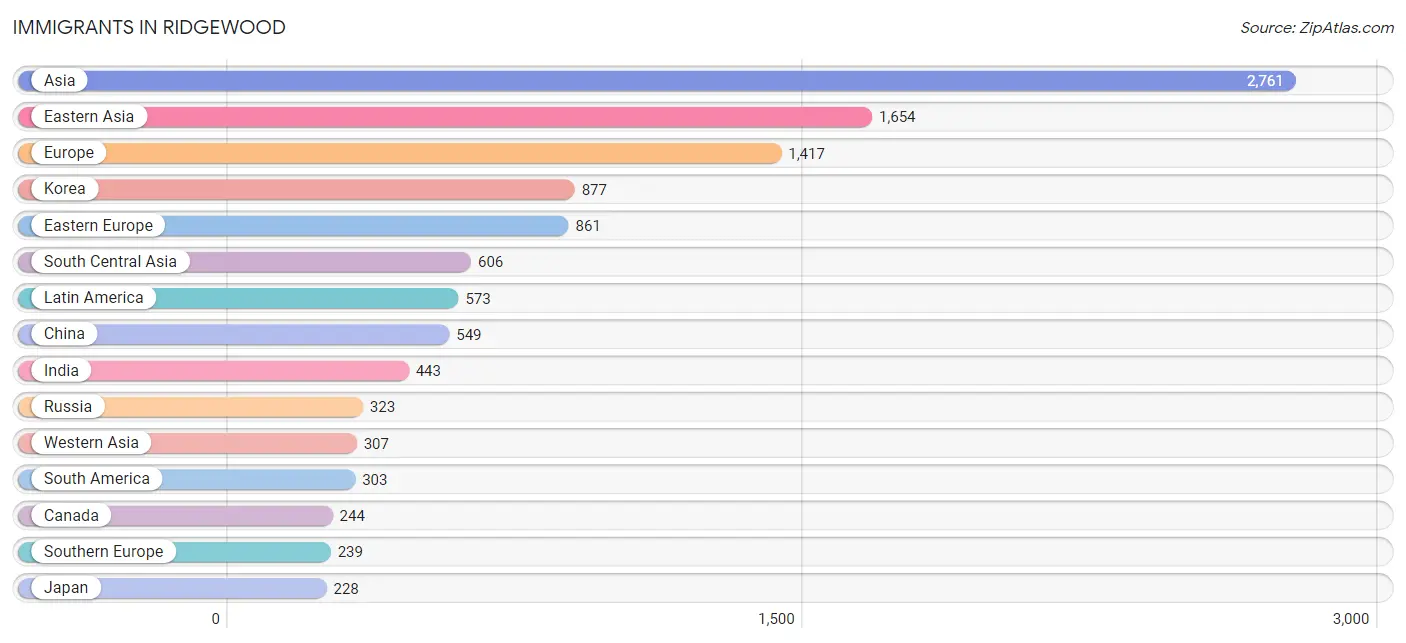
Immigrants in Ridgewood
The most numerous immigrant groups reported in Ridgewood came from Asia (2,761 | 10.6%), Eastern Asia (1,654 | 6.4%), Europe (1,417 | 5.4%), Korea (877 | 3.4%), and Eastern Europe (861 | 3.3%), together accounting for 29.1% of all Ridgewood residents.
| Immigration Origin | # Population | % Population |
| Africa | 100 | 0.4% |
| Albania | 24 | 0.1% |
| Argentina | 99 | 0.4% |
| Armenia | 12 | 0.1% |
| Asia | 2,761 | 10.6% |
| Australia | 11 | 0.0% |
| Austria | 42 | 0.2% |
| Bolivia | 26 | 0.1% |
| Brazil | 51 | 0.2% |
| Bulgaria | 45 | 0.2% |
| Canada | 244 | 0.9% |
| Caribbean | 181 | 0.7% |
| Central America | 89 | 0.3% |
| China | 549 | 2.1% |
| Colombia | 33 | 0.1% |
| Cuba | 74 | 0.3% |
| Dominica | 12 | 0.1% |
| Dominican Republic | 3 | 0.0% |
| Eastern Asia | 1,654 | 6.4% |
| Eastern Europe | 861 | 3.3% |
| Egypt | 16 | 0.1% |
| El Salvador | 33 | 0.1% |
| England | 48 | 0.2% |
| Europe | 1,417 | 5.4% |
| France | 17 | 0.1% |
| Germany | 8 | 0.0% |
| Ghana | 66 | 0.3% |
| Greece | 24 | 0.1% |
| Haiti | 33 | 0.1% |
| Hong Kong | 59 | 0.2% |
| Hungary | 30 | 0.1% |
| India | 443 | 1.7% |
| Indonesia | 6 | 0.0% |
| Iran | 42 | 0.2% |
| Ireland | 35 | 0.1% |
| Israel | 27 | 0.1% |
| Italy | 189 | 0.7% |
| Jamaica | 59 | 0.2% |
| Japan | 228 | 0.9% |
| Korea | 877 | 3.4% |
| Latin America | 573 | 2.2% |
| Lebanon | 160 | 0.6% |
| Malaysia | 24 | 0.1% |
| Mexico | 56 | 0.2% |
| Middle Africa | 18 | 0.1% |
| Moldova | 8 | 0.0% |
| Netherlands | 55 | 0.2% |
| Northern Africa | 16 | 0.1% |
| Northern Europe | 195 | 0.7% |
| Oceania | 11 | 0.0% |
| Pakistan | 95 | 0.4% |
| Peru | 85 | 0.3% |
| Philippines | 64 | 0.3% |
| Poland | 125 | 0.5% |
| Portugal | 18 | 0.1% |
| Romania | 40 | 0.2% |
| Russia | 323 | 1.2% |
| Serbia | 14 | 0.1% |
| Singapore | 20 | 0.1% |
| South America | 303 | 1.2% |
| South Central Asia | 606 | 2.3% |
| South Eastern Asia | 189 | 0.7% |
| Southern Europe | 239 | 0.9% |
| Spain | 8 | 0.0% |
| Sri Lanka | 26 | 0.1% |
| Syria | 6 | 0.0% |
| Taiwan | 80 | 0.3% |
| Thailand | 40 | 0.2% |
| Turkey | 73 | 0.3% |
| Ukraine | 200 | 0.8% |
| Venezuela | 9 | 0.0% |
| Vietnam | 35 | 0.1% |
| Western Africa | 66 | 0.3% |
| Western Asia | 307 | 1.2% |
| Western Europe | 122 | 0.5% | View All 75 Rows |
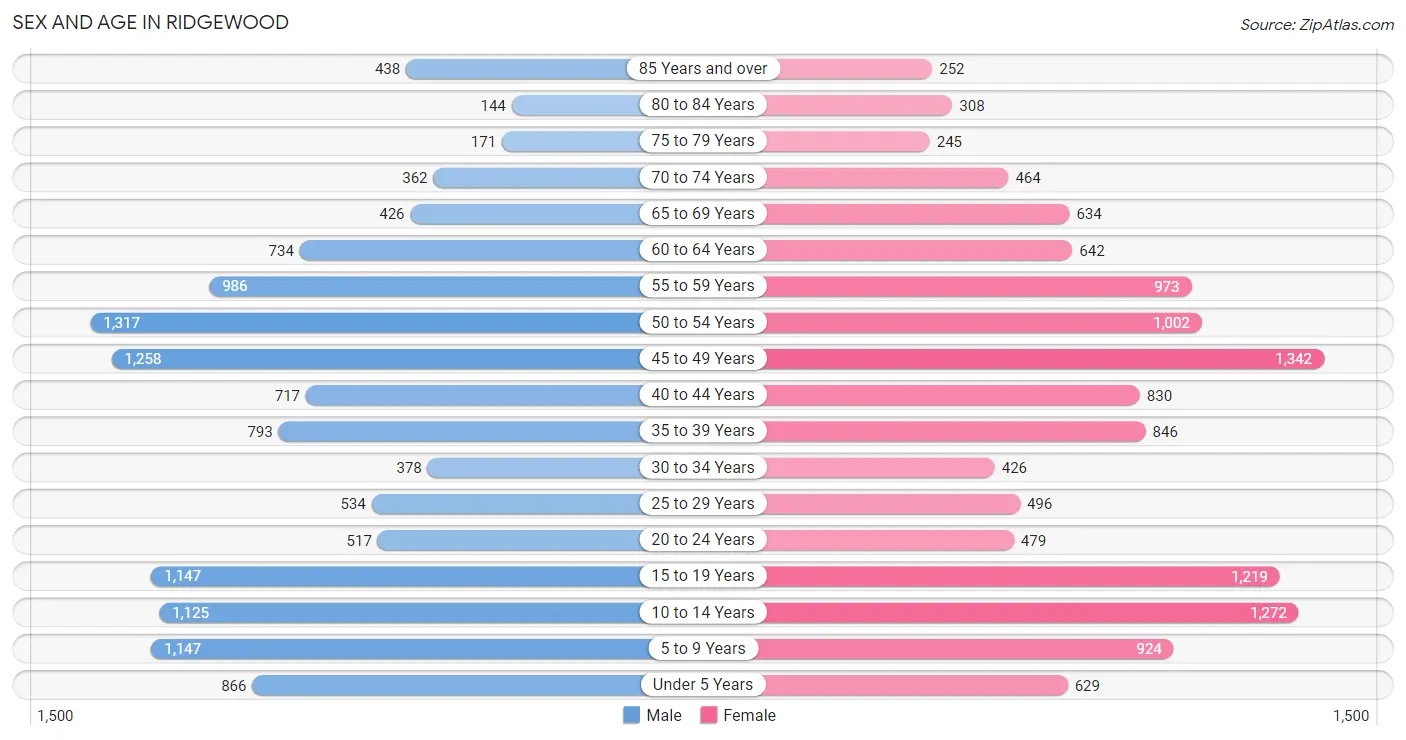
Sex and Age in Ridgewood
Sex and Age in Ridgewood
The most populous age groups in Ridgewood are 50 to 54 Years (1,317 | 10.1%) for men and 45 to 49 Years (1,342 | 10.3%) for women.
| Age Bracket | Male | Female |
| Under 5 Years | 866 (6.6%) | 629 (4.8%) |
| 5 to 9 Years | 1,147 (8.8%) | 924 (7.1%) |
| 10 to 14 Years | 1,125 (8.6%) | 1,272 (9.8%) |
| 15 to 19 Years | 1,147 (8.8%) | 1,219 (9.4%) |
| 20 to 24 Years | 517 (4.0%) | 479 (3.7%) |
| 25 to 29 Years | 534 (4.1%) | 496 (3.8%) |
| 30 to 34 Years | 378 (2.9%) | 426 (3.3%) |
| 35 to 39 Years | 793 (6.1%) | 846 (6.5%) |
| 40 to 44 Years | 717 (5.5%) | 830 (6.4%) |
| 45 to 49 Years | 1,258 (9.6%) | 1,342 (10.3%) |
| 50 to 54 Years | 1,317 (10.1%) | 1,002 (7.7%) |
| 55 to 59 Years | 986 (7.5%) | 973 (7.5%) |
| 60 to 64 Years | 734 (5.6%) | 642 (4.9%) |
| 65 to 69 Years | 426 (3.3%) | 634 (4.9%) |
| 70 to 74 Years | 362 (2.8%) | 464 (3.6%) |
| 75 to 79 Years | 171 (1.3%) | 245 (1.9%) |
| 80 to 84 Years | 144 (1.1%) | 308 (2.4%) |
| 85 Years and over | 438 (3.4%) | 252 (1.9%) |
| Total | 13,060 (100.0%) | 12,983 (100.0%) |
Families and Households in Ridgewood
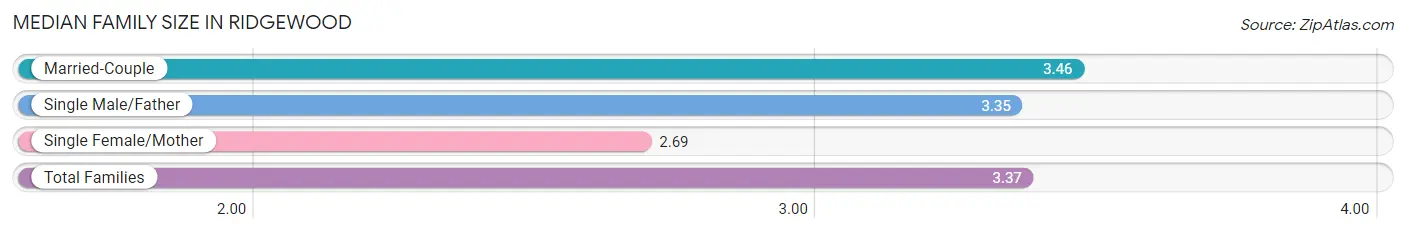
Median Family Size in Ridgewood
The median family size in Ridgewood is 3.37 persons per family, with married-couple families (5,960 | 85.8%) accounting for the largest median family size of 3.46 persons per family. On the other hand, single female/mother families (781 | 11.3%) represent the smallest median family size with 2.69 persons per family.
| Family Type | # Families | Family Size |
| Married-Couple | 5,960 (85.8%) | 3.46 |
| Single Male/Father | 203 (2.9%) | 3.35 |
| Single Female/Mother | 781 (11.3%) | 2.69 |
| Total Families | 6,944 (100.0%) | 3.37 |
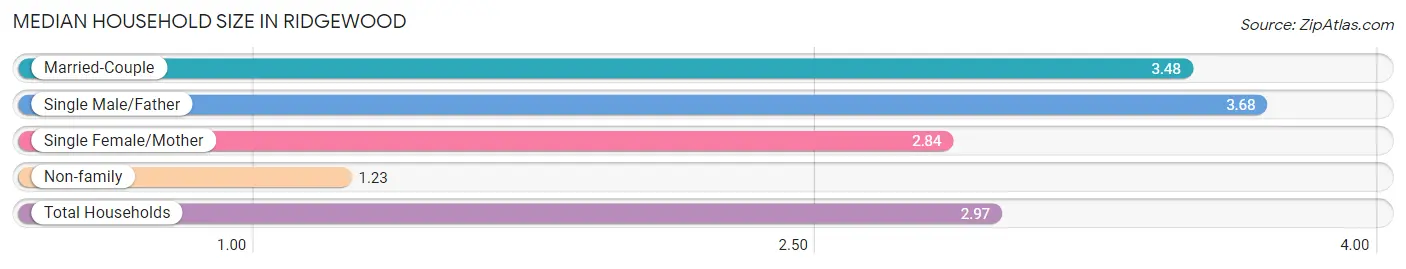
Median Household Size in Ridgewood
The median household size in Ridgewood is 2.97 persons per household, with single male/father households (203 | 2.3%) accounting for the largest median household size of 3.68 persons per household. non-family households (1,748 | 20.1%) represent the smallest median household size with 1.23 persons per household.
| Household Type | # Households | Household Size |
| Married-Couple | 5,960 (68.6%) | 3.48 |
| Single Male/Father | 203 (2.3%) | 3.68 |
| Single Female/Mother | 781 (9.0%) | 2.84 |
| Non-family | 1,748 (20.1%) | 1.23 |
| Total Households | 8,692 (100.0%) | 2.97 |
Household Size by Marriage Status in Ridgewood
Out of a total of 8,692 households in Ridgewood, 6,944 (79.9%) are family households, while 1,748 (20.1%) are nonfamily households. The most numerous type of family households are 2-person households, comprising 2,432, and the most common type of nonfamily households are 1-person households, comprising 1,378.
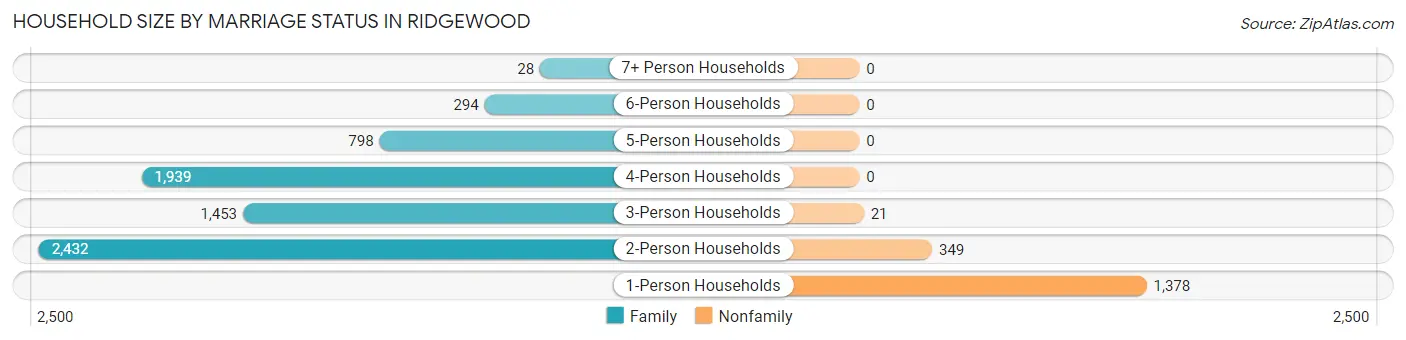
| Household Size | Family Households | Nonfamily Households |
| 1-Person Households | - | 1,378 (15.9%) |
| 2-Person Households | 2,432 (28.0%) | 349 (4.0%) |
| 3-Person Households | 1,453 (16.7%) | 21 (0.2%) |
| 4-Person Households | 1,939 (22.3%) | 0 (0.0%) |
| 5-Person Households | 798 (9.2%) | 0 (0.0%) |
| 6-Person Households | 294 (3.4%) | 0 (0.0%) |
| 7+ Person Households | 28 (0.3%) | 0 (0.0%) |
| Total | 6,944 (79.9%) | 1,748 (20.1%) |
Female Fertility in Ridgewood
Fertility by Age in Ridgewood
Average fertility rate in Ridgewood is 26.0 births per 1,000 women. Women in the age bracket of 20 to 34 years have the highest fertility rate with 36.0 births per 1,000 women. Women in the age bracket of 35 to 50 years acount for 67.7% of all women with births.
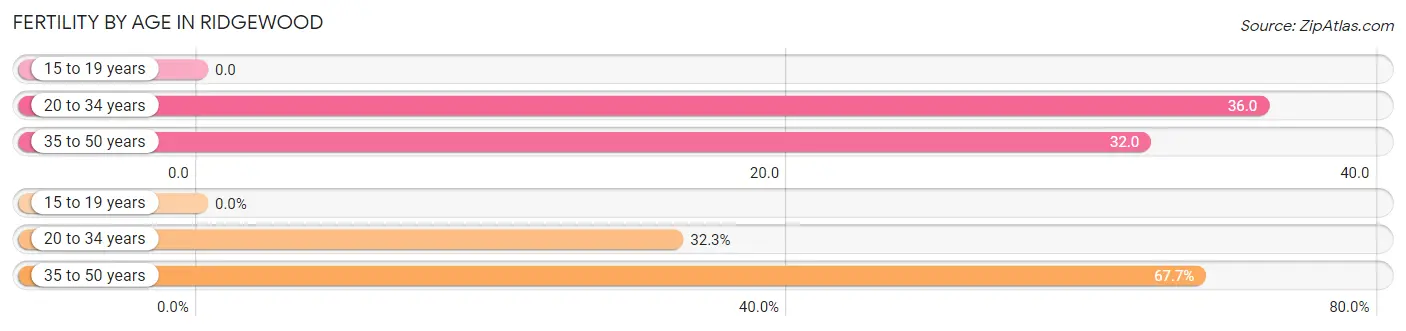
| Age Bracket | Women with Births | Births / 1,000 Women |
| 15 to 19 years | 0 (0.0%) | 0.0 |
| 20 to 34 years | 50 (32.3%) | 36.0 |
| 35 to 50 years | 105 (67.7%) | 32.0 |
| Total | 155 (100.0%) | 26.0 |
Fertility by Age by Marriage Status in Ridgewood
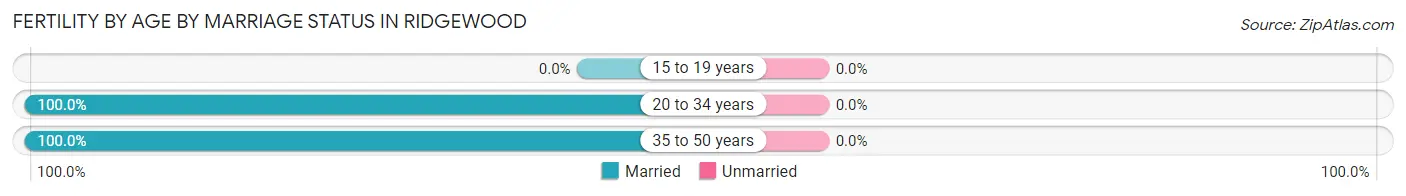
| Age Bracket | Married | Unmarried |
| 15 to 19 years | 0 (0.0%) | 0 (0.0%) |
| 20 to 34 years | 50 (100.0%) | 0 (0.0%) |
| 35 to 50 years | 105 (100.0%) | 0 (0.0%) |
| Total | 155 (100.0%) | 0 (0.0%) |
Fertility by Education in Ridgewood
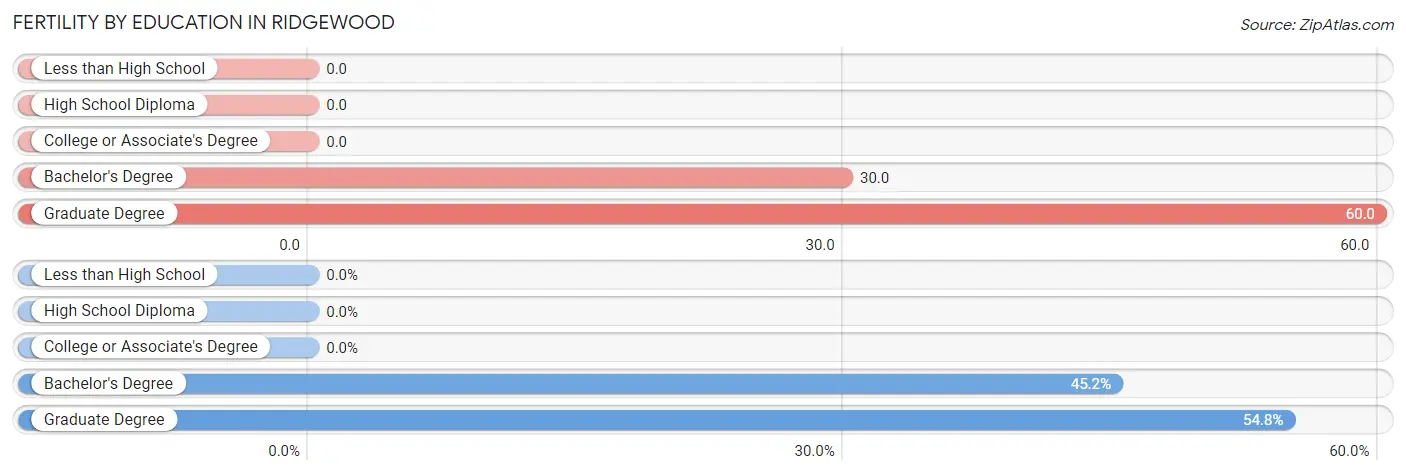
| Educational Attainment | Women with Births | Births / 1,000 Women |
| Less than High School | 0 (0.0%) | 0.0 |
| High School Diploma | 0 (0.0%) | 0.0 |
| College or Associate's Degree | 0 (0.0%) | 0.0 |
| Bachelor's Degree | 70 (45.2%) | 30.0 |
| Graduate Degree | 85 (54.8%) | 60.0 |
| Total | 155 (100.0%) | 26.0 |
Fertility by Education by Marriage Status in Ridgewood
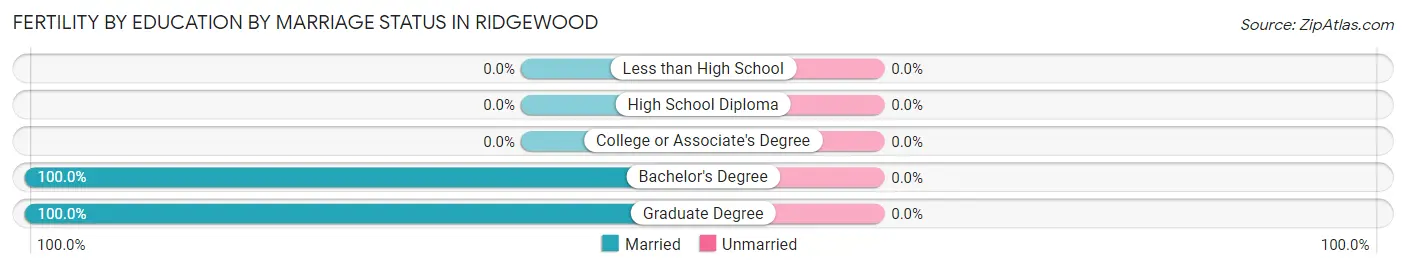
| Educational Attainment | Married | Unmarried |
| Less than High School | 0 (0.0%) | 0 (0.0%) |
| High School Diploma | 0 (0.0%) | 0 (0.0%) |
| College or Associate's Degree | 0 (0.0%) | 0 (0.0%) |
| Bachelor's Degree | 70 (100.0%) | 0 (0.0%) |
| Graduate Degree | 85 (100.0%) | 0 (0.0%) |
| Total | 155 (100.0%) | 0 (0.0%) |
Employment Characteristics in Ridgewood
Employment by Class of Employer in Ridgewood
Among the 12,152 employed individuals in Ridgewood, private company employees (8,442 | 69.5%), local government employees (1,181 | 9.7%), and not-for-profit organizations (978 | 8.1%) make up the most common classes of employment.
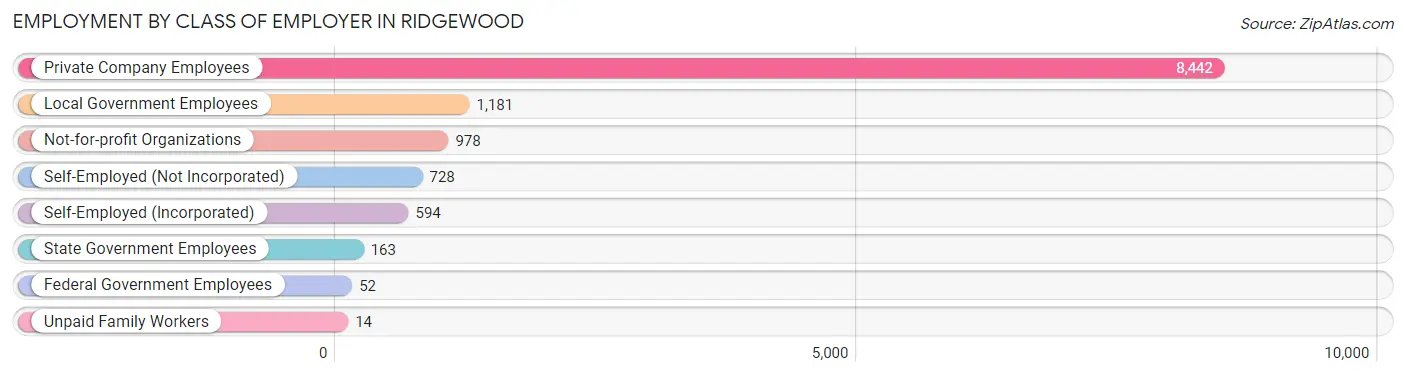
| Employer Class | # Employees | % Employees |
| Private Company Employees | 8,442 | 69.5% |
| Self-Employed (Incorporated) | 594 | 4.9% |
| Self-Employed (Not Incorporated) | 728 | 6.0% |
| Not-for-profit Organizations | 978 | 8.1% |
| Local Government Employees | 1,181 | 9.7% |
| State Government Employees | 163 | 1.3% |
| Federal Government Employees | 52 | 0.4% |
| Unpaid Family Workers | 14 | 0.1% |
| Total | 12,152 | 100.0% |
Employment Status by Age in Ridgewood
According to the labor force statistics for Ridgewood, out of the total population over 16 years of age (19,661), 65.7% or 12,917 individuals are in the labor force, with 3.8% or 491 of them unemployed. The age group with the highest labor force participation rate is 30 to 34 years, with 87.4% or 703 individuals in the labor force. Within the labor force, the 20 to 24 years age range has the highest percentage of unemployed individuals, with 11.8% or 74 of them being unemployed.
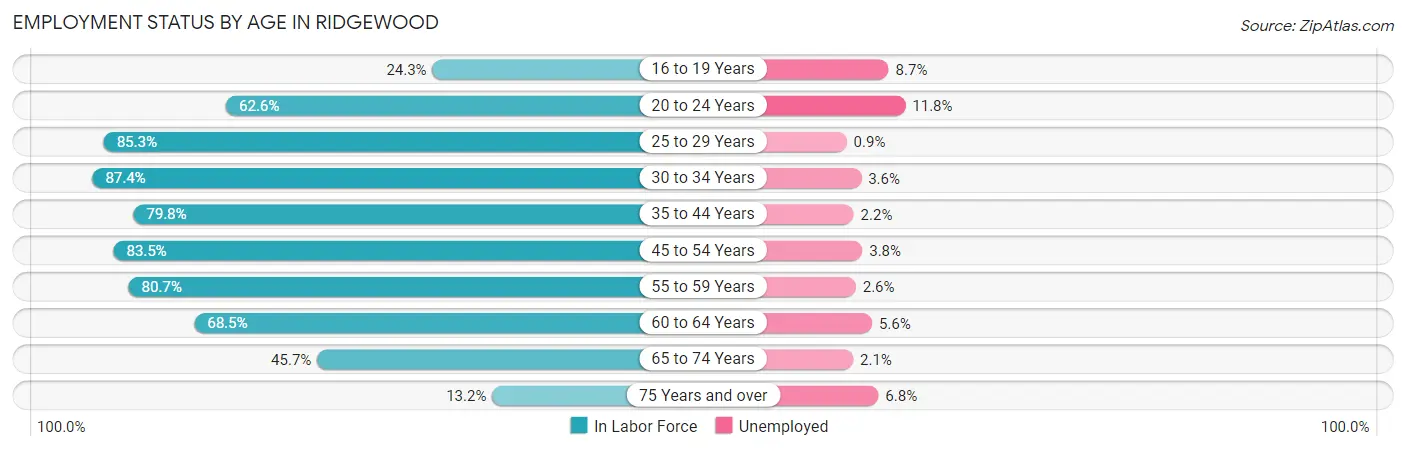
| Age Bracket | In Labor Force | Unemployed |
| 16 to 19 Years | 473 (24.3%) | 41 (8.7%) |
| 20 to 24 Years | 623 (62.6%) | 74 (11.8%) |
| 25 to 29 Years | 879 (85.3%) | 8 (0.9%) |
| 30 to 34 Years | 703 (87.4%) | 25 (3.6%) |
| 35 to 44 Years | 2,542 (79.8%) | 56 (2.2%) |
| 45 to 54 Years | 4,107 (83.5%) | 156 (3.8%) |
| 55 to 59 Years | 1,581 (80.7%) | 41 (2.6%) |
| 60 to 64 Years | 943 (68.5%) | 53 (5.6%) |
| 65 to 74 Years | 862 (45.7%) | 18 (2.1%) |
| 75 Years and over | 206 (13.2%) | 14 (6.8%) |
| Total | 12,917 (65.7%) | 491 (3.8%) |
Employment Status by Educational Attainment in Ridgewood
According to labor force statistics for Ridgewood, 81.0% of individuals (10,752) out of the total population between 25 and 64 years of age (13,274) are in the labor force, with 3.2% or 344 of them being unemployed. The group with the highest labor force participation rate are those with the educational attainment of bachelor's degree or higher, with 83.0% or 8,922 individuals in the labor force. Within the labor force, individuals with high school diploma education have the highest percentage of unemployment, with 8.3% or 59 of them being unemployed.
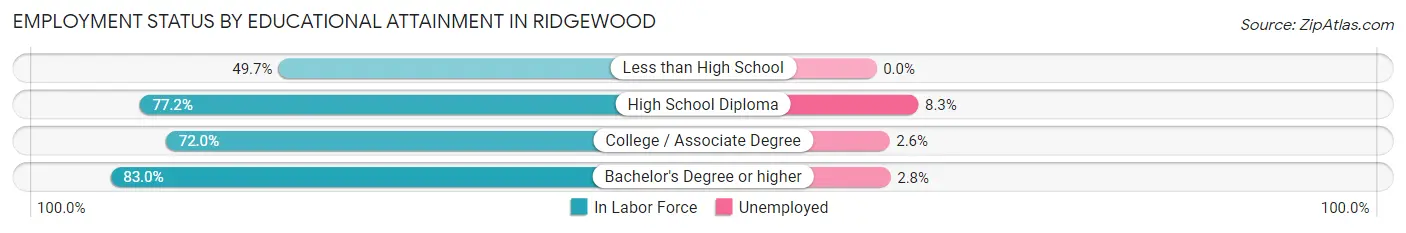
| Educational Attainment | In Labor Force | Unemployed |
| Less than High School | 84 (49.7%) | 0 (0.0%) |
| High School Diploma | 708 (77.2%) | 76 (8.3%) |
| College / Associate Degree | 1,035 (72.0%) | 37 (2.6%) |
| Bachelor's Degree or higher | 8,922 (83.0%) | 301 (2.8%) |
| Total | 10,752 (81.0%) | 425 (3.2%) |
Employment Occupations by Sex in Ridgewood
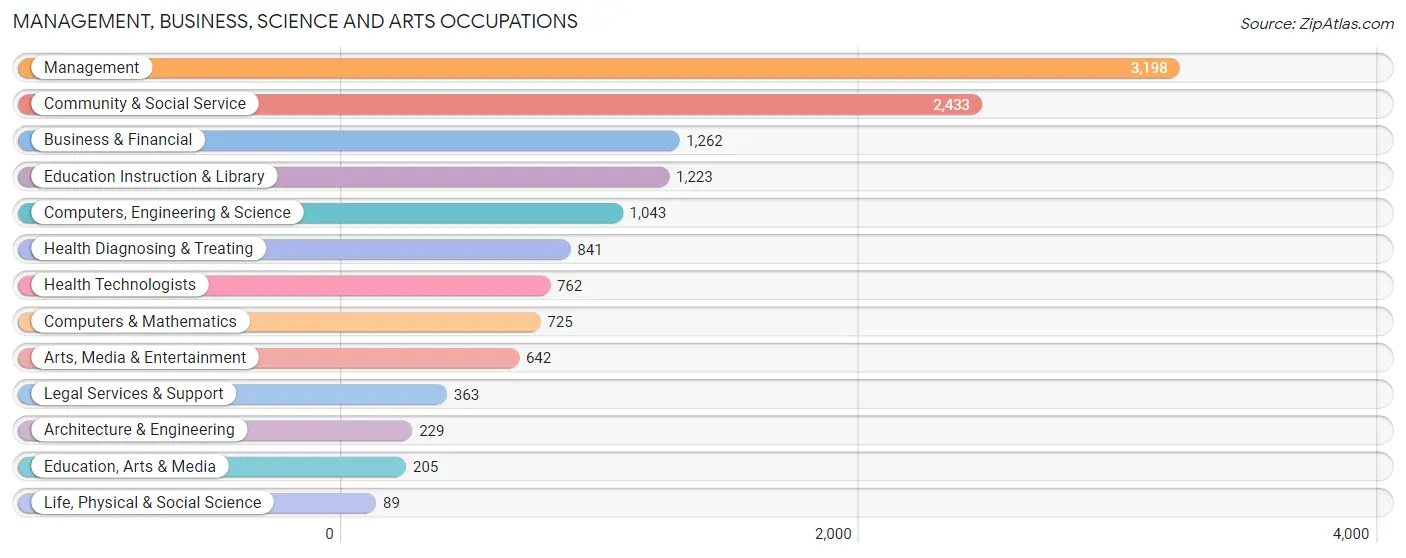
Management, Business, Science and Arts Occupations
The most common Management, Business, Science and Arts occupations in Ridgewood are Management (3,198 | 25.7%), Community & Social Service (2,433 | 19.6%), Business & Financial (1,262 | 10.2%), Education Instruction & Library (1,223 | 9.8%), and Computers, Engineering & Science (1,043 | 8.4%).
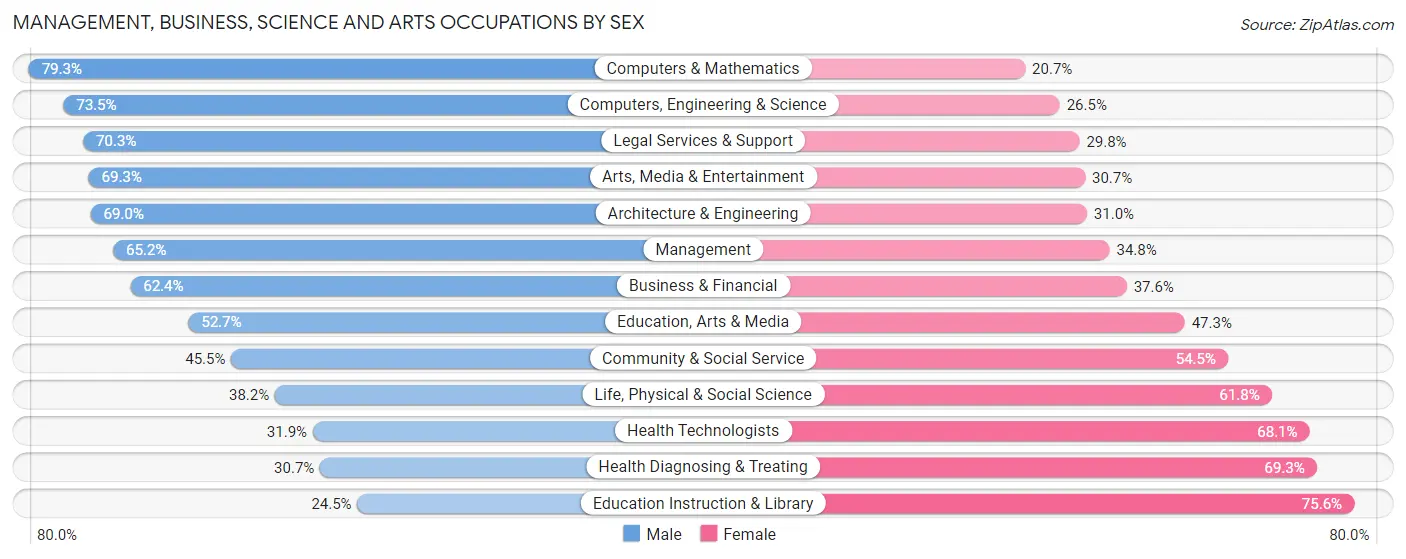
Management, Business, Science and Arts Occupations by Sex
Within the Management, Business, Science and Arts occupations in Ridgewood, the most male-oriented occupations are Computers & Mathematics (79.3%), Computers, Engineering & Science (73.5%), and Legal Services & Support (70.3%), while the most female-oriented occupations are Education Instruction & Library (75.5%), Health Diagnosing & Treating (69.3%), and Health Technologists (68.1%).
| Occupation | Male | Female |
| Management | 2,086 (65.2%) | 1,112 (34.8%) |
| Business & Financial | 787 (62.4%) | 475 (37.6%) |
| Computers, Engineering & Science | 767 (73.5%) | 276 (26.5%) |
| Computers & Mathematics | 575 (79.3%) | 150 (20.7%) |
| Architecture & Engineering | 158 (69.0%) | 71 (31.0%) |
| Life, Physical & Social Science | 34 (38.2%) | 55 (61.8%) |
| Community & Social Service | 1,107 (45.5%) | 1,326 (54.5%) |
| Education, Arts & Media | 108 (52.7%) | 97 (47.3%) |
| Legal Services & Support | 255 (70.3%) | 108 (29.7%) |
| Education Instruction & Library | 299 (24.4%) | 924 (75.5%) |
| Arts, Media & Entertainment | 445 (69.3%) | 197 (30.7%) |
| Health Diagnosing & Treating | 258 (30.7%) | 583 (69.3%) |
| Health Technologists | 243 (31.9%) | 519 (68.1%) |
| Total (Category) | 5,005 (57.0%) | 3,772 (43.0%) |
| Total (Overall) | 7,125 (57.3%) | 5,305 (42.7%) |
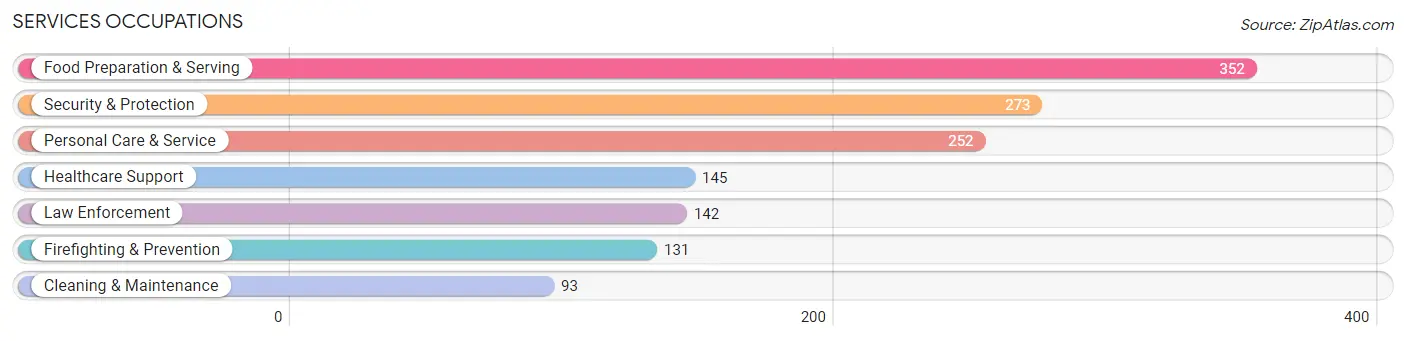
Services Occupations
The most common Services occupations in Ridgewood are Food Preparation & Serving (352 | 2.8%), Security & Protection (273 | 2.2%), Personal Care & Service (252 | 2.0%), Healthcare Support (145 | 1.2%), and Law Enforcement (142 | 1.1%).
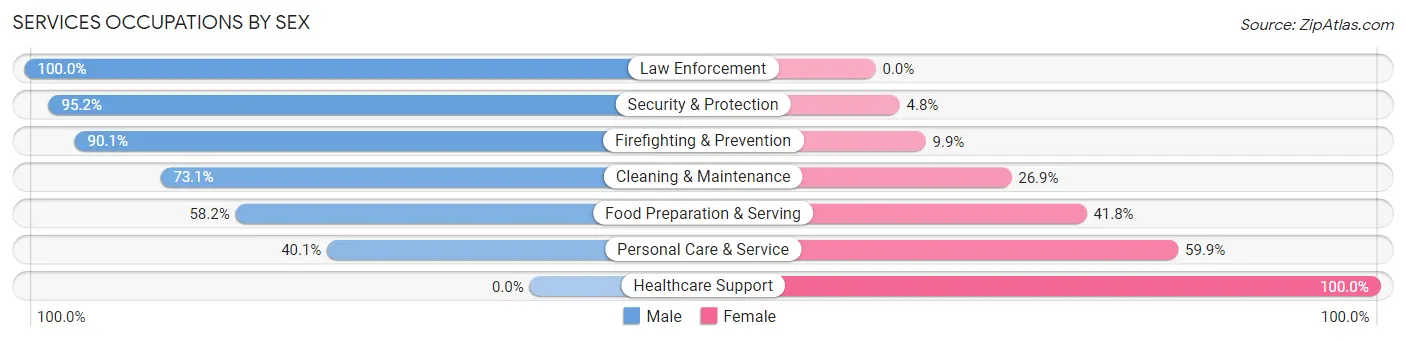
Services Occupations by Sex
Within the Services occupations in Ridgewood, the most male-oriented occupations are Law Enforcement (100.0%), Security & Protection (95.2%), and Firefighting & Prevention (90.1%), while the most female-oriented occupations are Healthcare Support (100.0%), Personal Care & Service (59.9%), and Food Preparation & Serving (41.8%).
| Occupation | Male | Female |
| Healthcare Support | 0 (0.0%) | 145 (100.0%) |
| Security & Protection | 260 (95.2%) | 13 (4.8%) |
| Firefighting & Prevention | 118 (90.1%) | 13 (9.9%) |
| Law Enforcement | 142 (100.0%) | 0 (0.0%) |
| Food Preparation & Serving | 205 (58.2%) | 147 (41.8%) |
| Cleaning & Maintenance | 68 (73.1%) | 25 (26.9%) |
| Personal Care & Service | 101 (40.1%) | 151 (59.9%) |
| Total (Category) | 634 (56.9%) | 481 (43.1%) |
| Total (Overall) | 7,125 (57.3%) | 5,305 (42.7%) |
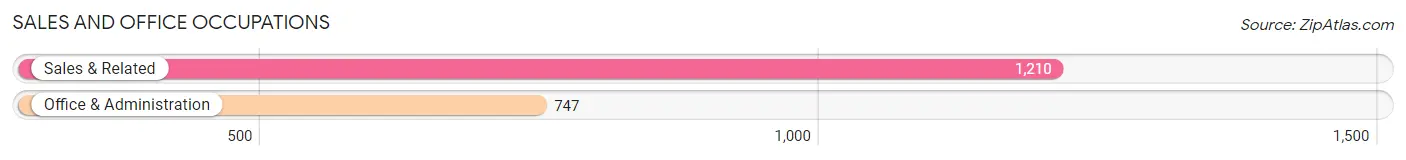
Sales and Office Occupations
The most common Sales and Office occupations in Ridgewood are Sales & Related (1,210 | 9.7%), and Office & Administration (747 | 6.0%).
Sales and Office Occupations by Sex
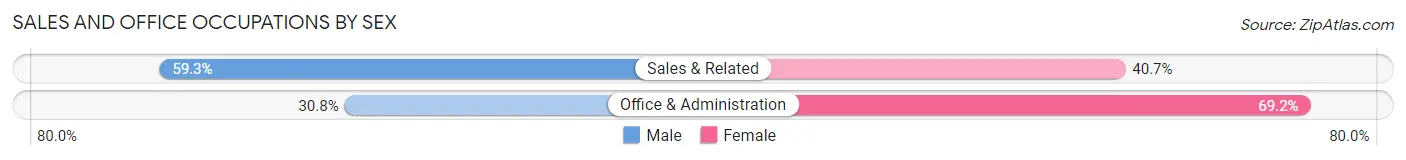
| Occupation | Male | Female |
| Sales & Related | 717 (59.3%) | 493 (40.7%) |
| Office & Administration | 230 (30.8%) | 517 (69.2%) |
| Total (Category) | 947 (48.4%) | 1,010 (51.6%) |
| Total (Overall) | 7,125 (57.3%) | 5,305 (42.7%) |
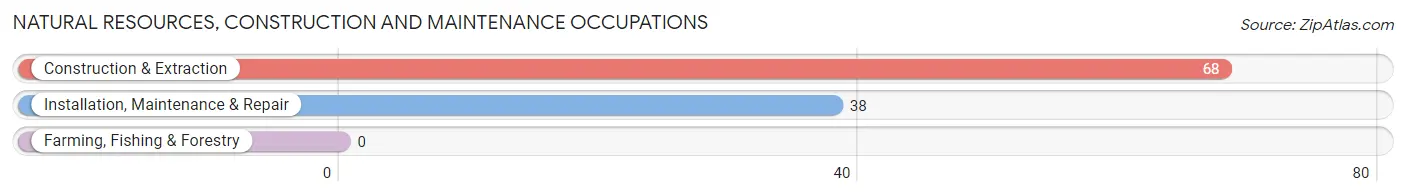
Natural Resources, Construction and Maintenance Occupations
The most common Natural Resources, Construction and Maintenance occupations in Ridgewood are Construction & Extraction (68 | 0.5%), and Installation, Maintenance & Repair (38 | 0.3%).
Natural Resources, Construction and Maintenance Occupations by Sex
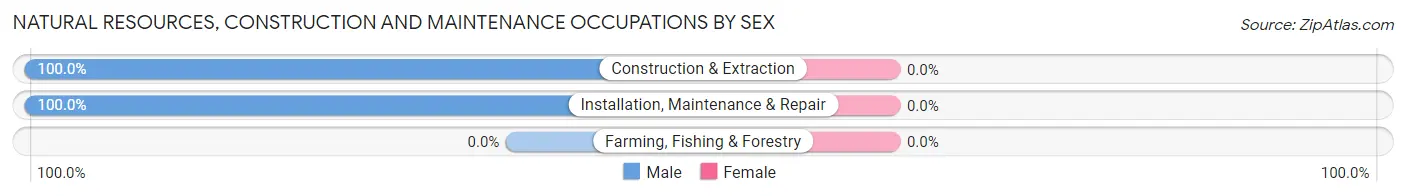
| Occupation | Male | Female |
| Farming, Fishing & Forestry | 0 (0.0%) | 0 (0.0%) |
| Construction & Extraction | 68 (100.0%) | 0 (0.0%) |
| Installation, Maintenance & Repair | 38 (100.0%) | 0 (0.0%) |
| Total (Category) | 106 (100.0%) | 0 (0.0%) |
| Total (Overall) | 7,125 (57.3%) | 5,305 (42.7%) |
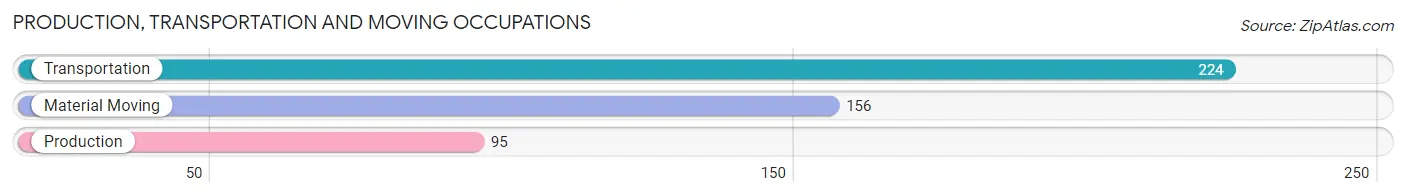
Production, Transportation and Moving Occupations
The most common Production, Transportation and Moving occupations in Ridgewood are Transportation (224 | 1.8%), Material Moving (156 | 1.3%), and Production (95 | 0.8%).
Production, Transportation and Moving Occupations by Sex
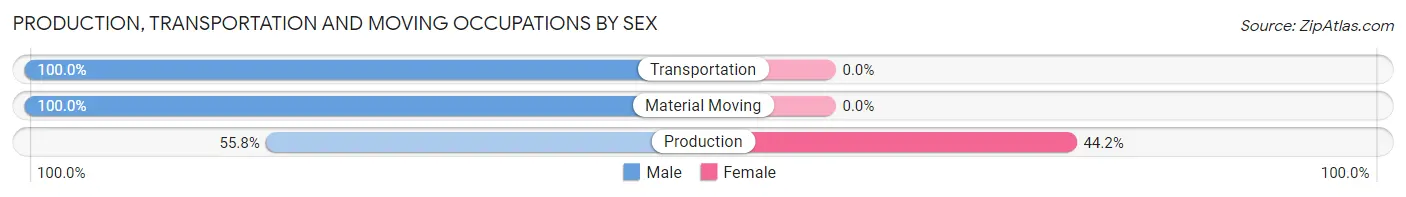
| Occupation | Male | Female |
| Production | 53 (55.8%) | 42 (44.2%) |
| Transportation | 224 (100.0%) | 0 (0.0%) |
| Material Moving | 156 (100.0%) | 0 (0.0%) |
| Total (Category) | 433 (91.2%) | 42 (8.8%) |
| Total (Overall) | 7,125 (57.3%) | 5,305 (42.7%) |
Employment Industries by Sex in Ridgewood
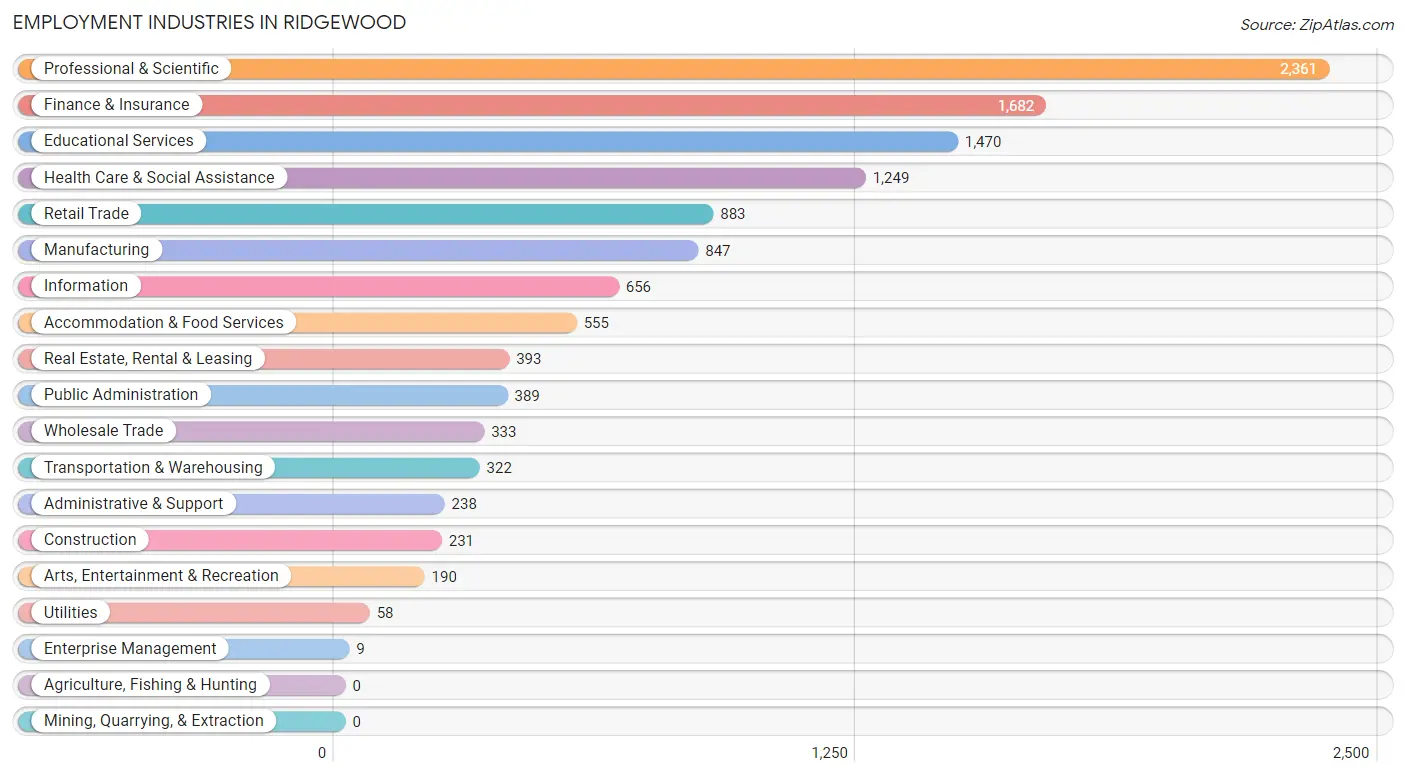
Employment Industries in Ridgewood
The major employment industries in Ridgewood include Professional & Scientific (2,361 | 19.0%), Finance & Insurance (1,682 | 13.5%), Educational Services (1,470 | 11.8%), Health Care & Social Assistance (1,249 | 10.1%), and Retail Trade (883 | 7.1%).
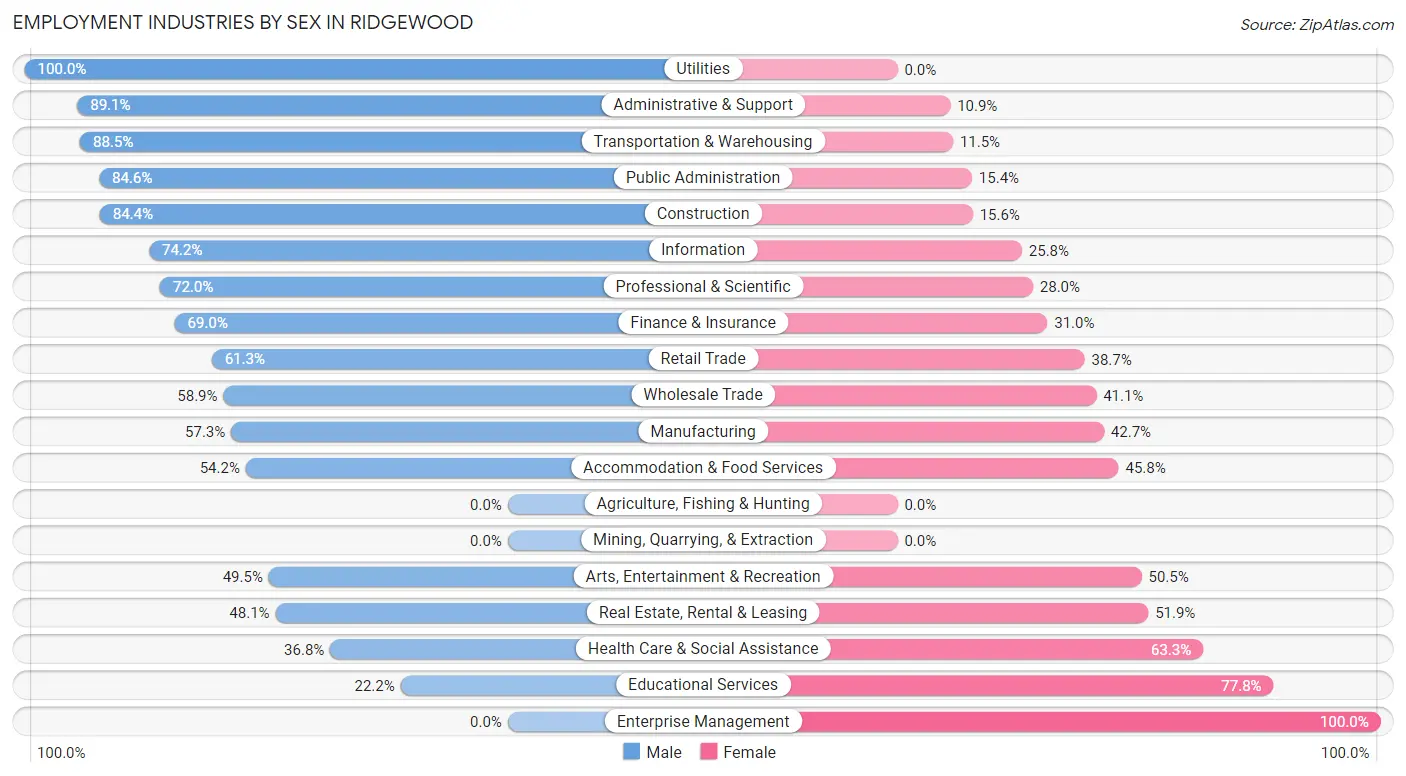
Employment Industries by Sex in Ridgewood
The Ridgewood industries that see more men than women are Utilities (100.0%), Administrative & Support (89.1%), and Transportation & Warehousing (88.5%), whereas the industries that tend to have a higher number of women are Enterprise Management (100.0%), Educational Services (77.8%), and Health Care & Social Assistance (63.2%).
| Industry | Male | Female |
| Agriculture, Fishing & Hunting | 0 (0.0%) | 0 (0.0%) |
| Mining, Quarrying, & Extraction | 0 (0.0%) | 0 (0.0%) |
| Construction | 195 (84.4%) | 36 (15.6%) |
| Manufacturing | 485 (57.3%) | 362 (42.7%) |
| Wholesale Trade | 196 (58.9%) | 137 (41.1%) |
| Retail Trade | 541 (61.3%) | 342 (38.7%) |
| Transportation & Warehousing | 285 (88.5%) | 37 (11.5%) |
| Utilities | 58 (100.0%) | 0 (0.0%) |
| Information | 487 (74.2%) | 169 (25.8%) |
| Finance & Insurance | 1,160 (69.0%) | 522 (31.0%) |
| Real Estate, Rental & Leasing | 189 (48.1%) | 204 (51.9%) |
| Professional & Scientific | 1,699 (72.0%) | 662 (28.0%) |
| Enterprise Management | 0 (0.0%) | 9 (100.0%) |
| Administrative & Support | 212 (89.1%) | 26 (10.9%) |
| Educational Services | 326 (22.2%) | 1,144 (77.8%) |
| Health Care & Social Assistance | 459 (36.7%) | 790 (63.2%) |
| Arts, Entertainment & Recreation | 94 (49.5%) | 96 (50.5%) |
| Accommodation & Food Services | 301 (54.2%) | 254 (45.8%) |
| Public Administration | 329 (84.6%) | 60 (15.4%) |
| Total | 7,125 (57.3%) | 5,305 (42.7%) |
Education in Ridgewood
School Enrollment in Ridgewood
The most common levels of schooling among the 8,423 students in Ridgewood are high school (2,135 | 25.4%), middle school (2,040 | 24.2%), and elementary school (1,597 | 19.0%).
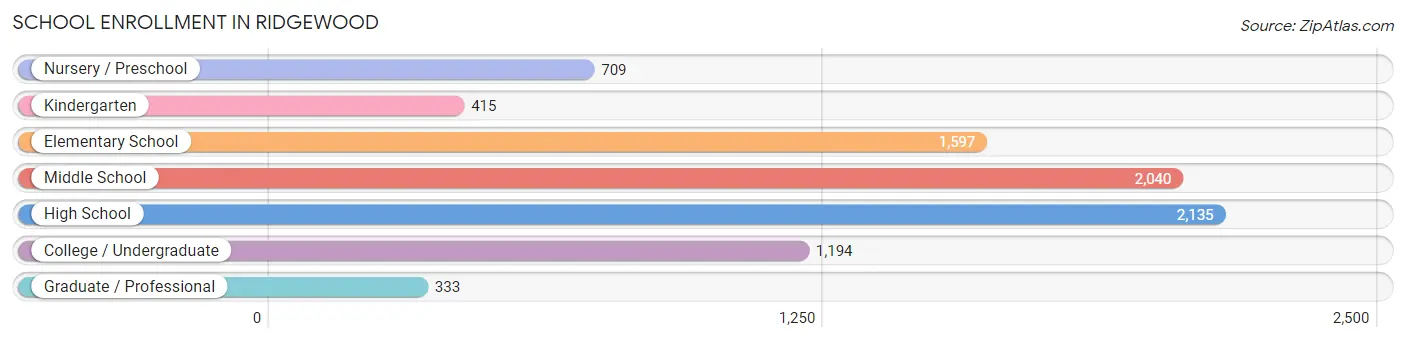
| School Level | # Students | % Students |
| Nursery / Preschool | 709 | 8.4% |
| Kindergarten | 415 | 4.9% |
| Elementary School | 1,597 | 19.0% |
| Middle School | 2,040 | 24.2% |
| High School | 2,135 | 25.4% |
| College / Undergraduate | 1,194 | 14.2% |
| Graduate / Professional | 333 | 4.0% |
| Total | 8,423 | 100.0% |
School Enrollment by Age by Funding Source in Ridgewood
Out of a total of 8,423 students who are enrolled in schools in Ridgewood, 1,777 (21.1%) attend a private institution, while the remaining 6,646 (78.9%) are enrolled in public schools. The age group of 3 to 4 year olds has the highest likelihood of being enrolled in private schools, with 343 (61.8% in the age bracket) enrolled. Conversely, the age group of 10 to 14 year olds has the lowest likelihood of being enrolled in a private school, with 2,172 (92.0% in the age bracket) attending a public institution.
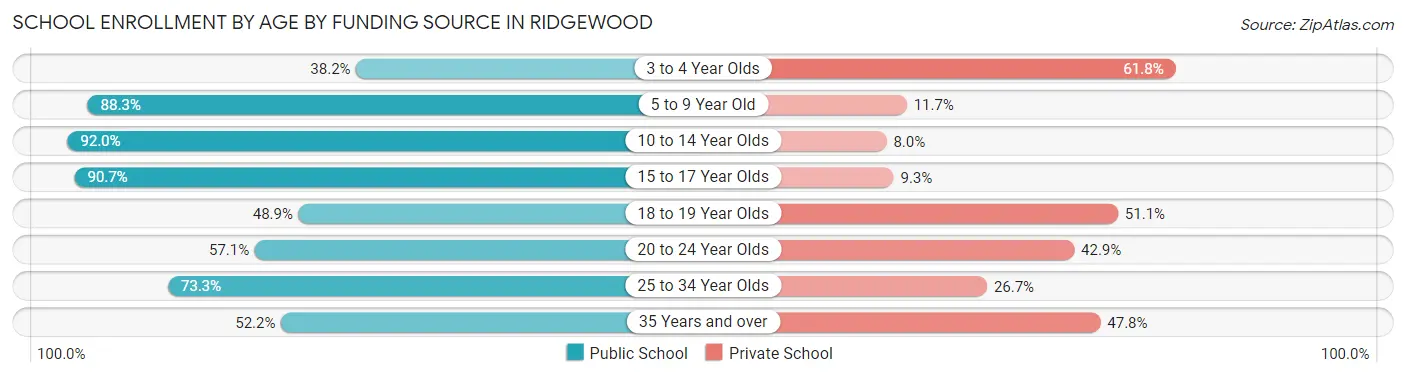
| Age Bracket | Public School | Private School |
| 3 to 4 Year Olds | 212 (38.2%) | 343 (61.8%) |
| 5 to 9 Year Old | 1,805 (88.3%) | 240 (11.7%) |
| 10 to 14 Year Olds | 2,172 (92.0%) | 188 (8.0%) |
| 15 to 17 Year Olds | 1,387 (90.7%) | 142 (9.3%) |
| 18 to 19 Year Olds | 409 (48.9%) | 427 (51.1%) |
| 20 to 24 Year Olds | 258 (57.1%) | 194 (42.9%) |
| 25 to 34 Year Olds | 239 (73.3%) | 87 (26.7%) |
| 35 Years and over | 167 (52.2%) | 153 (47.8%) |
| Total | 6,646 (78.9%) | 1,777 (21.1%) |
Educational Attainment by Field of Study in Ridgewood
Business (2,998 | 21.0%), social sciences (1,888 | 13.3%), literature & languages (1,192 | 8.4%), visual & performing arts (987 | 6.9%), and engineering (893 | 6.3%) are the most common fields of study among 14,242 individuals in Ridgewood who have obtained a bachelor's degree or higher.
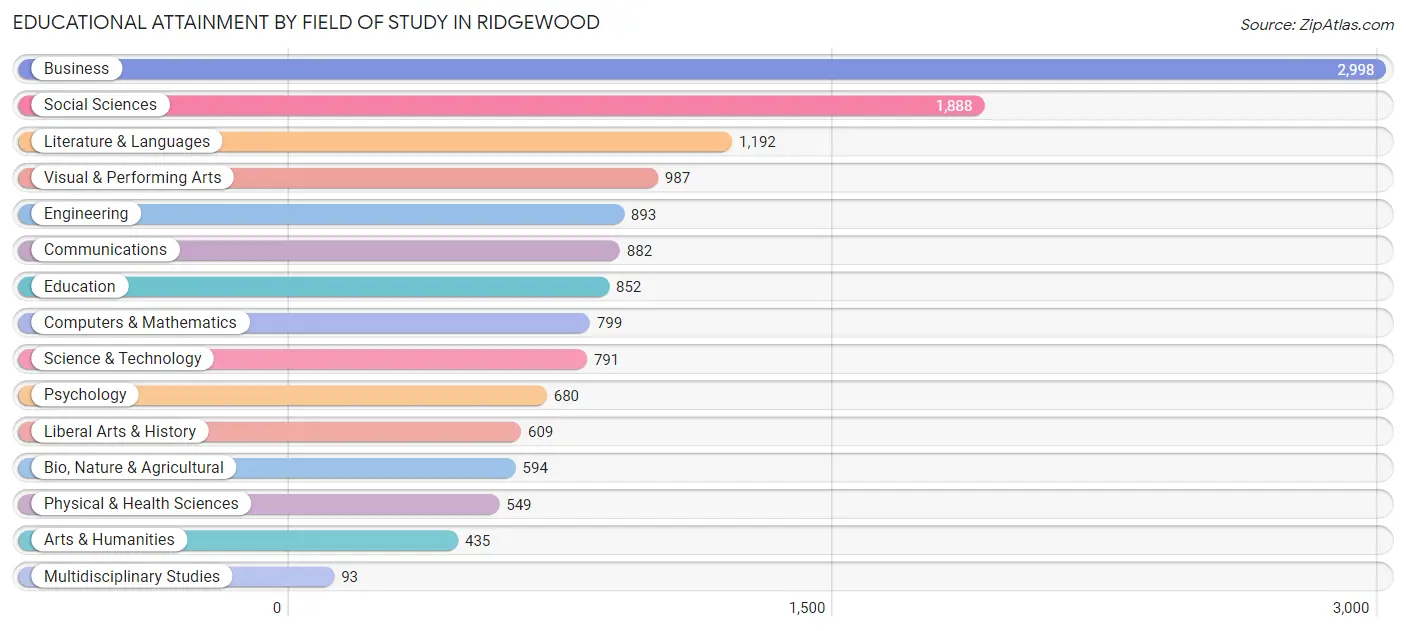
| Field of Study | # Graduates | % Graduates |
| Computers & Mathematics | 799 | 5.6% |
| Bio, Nature & Agricultural | 594 | 4.2% |
| Physical & Health Sciences | 549 | 3.8% |
| Psychology | 680 | 4.8% |
| Social Sciences | 1,888 | 13.3% |
| Engineering | 893 | 6.3% |
| Multidisciplinary Studies | 93 | 0.6% |
| Science & Technology | 791 | 5.6% |
| Business | 2,998 | 21.0% |
| Education | 852 | 6.0% |
| Literature & Languages | 1,192 | 8.4% |
| Liberal Arts & History | 609 | 4.3% |
| Visual & Performing Arts | 987 | 6.9% |
| Communications | 882 | 6.2% |
| Arts & Humanities | 435 | 3.0% |
| Total | 14,242 | 100.0% |
Transportation & Commute in Ridgewood
Vehicle Availability by Sex in Ridgewood
The most prevalent vehicle ownership categories in Ridgewood are males with 2 vehicles (3,422, accounting for 48.6%) and females with 2 vehicles (2,393, making up 67.0%).
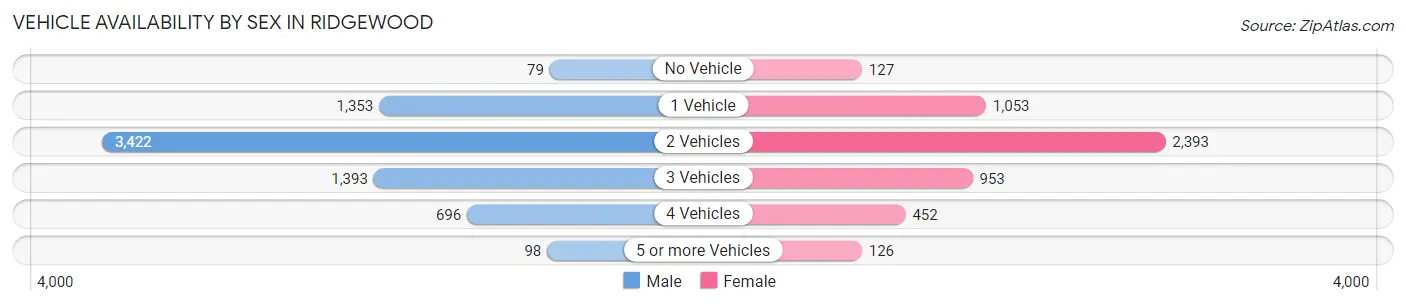
| Vehicles Available | Male | Female |
| No Vehicle | 79 (1.1%) | 127 (2.5%) |
| 1 Vehicle | 1,353 (19.2%) | 1,053 (20.6%) |
| 2 Vehicles | 3,422 (48.6%) | 2,393 (46.9%) |
| 3 Vehicles | 1,393 (19.8%) | 953 (18.7%) |
| 4 Vehicles | 696 (9.9%) | 452 (8.9%) |
| 5 or more Vehicles | 98 (1.4%) | 126 (2.5%) |
| Total | 7,041 (100.0%) | 5,104 (100.0%) |
Commute Time in Ridgewood
The most frequently occuring commute durations in Ridgewood are 60 to 89 minutes (1,701 commuters, 18.9%), 20 to 24 minutes (1,093 commuters, 12.1%), and 5 to 9 minutes (1,081 commuters, 12.0%).
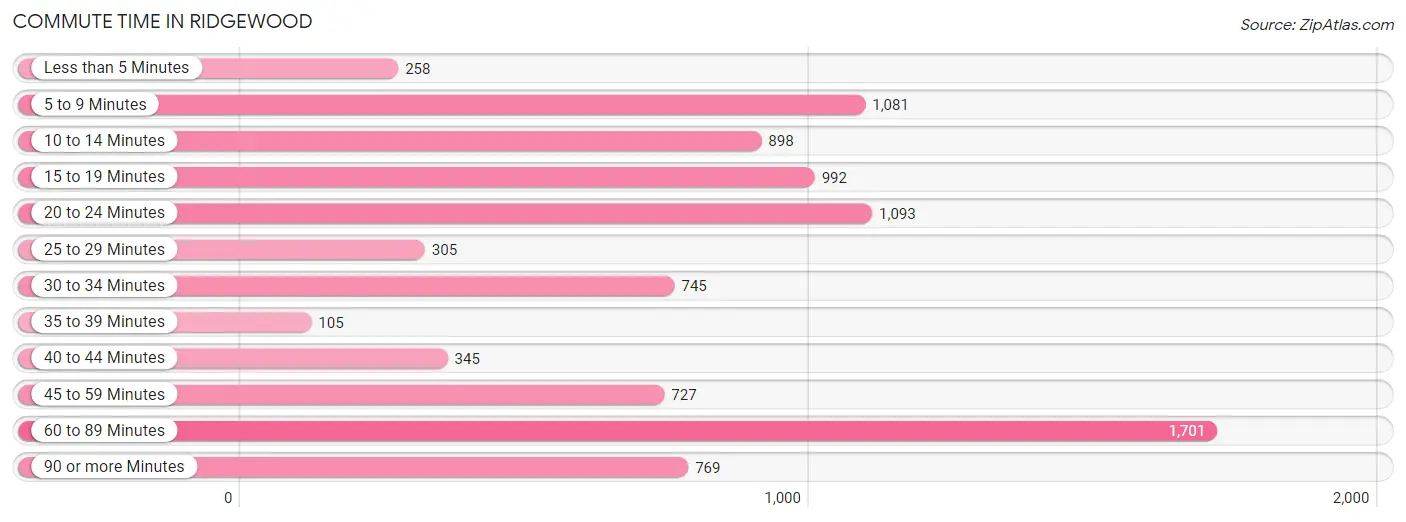
| Commute Time | # Commuters | % Commuters |
| Less than 5 Minutes | 258 | 2.9% |
| 5 to 9 Minutes | 1,081 | 12.0% |
| 10 to 14 Minutes | 898 | 10.0% |
| 15 to 19 Minutes | 992 | 11.0% |
| 20 to 24 Minutes | 1,093 | 12.1% |
| 25 to 29 Minutes | 305 | 3.4% |
| 30 to 34 Minutes | 745 | 8.3% |
| 35 to 39 Minutes | 105 | 1.2% |
| 40 to 44 Minutes | 345 | 3.8% |
| 45 to 59 Minutes | 727 | 8.1% |
| 60 to 89 Minutes | 1,701 | 18.9% |
| 90 or more Minutes | 769 | 8.5% |
Commute Time by Sex in Ridgewood
The most common commute times in Ridgewood are 60 to 89 minutes (1,215 commuters, 22.8%) for males and 5 to 9 minutes (647 commuters, 17.5%) for females.
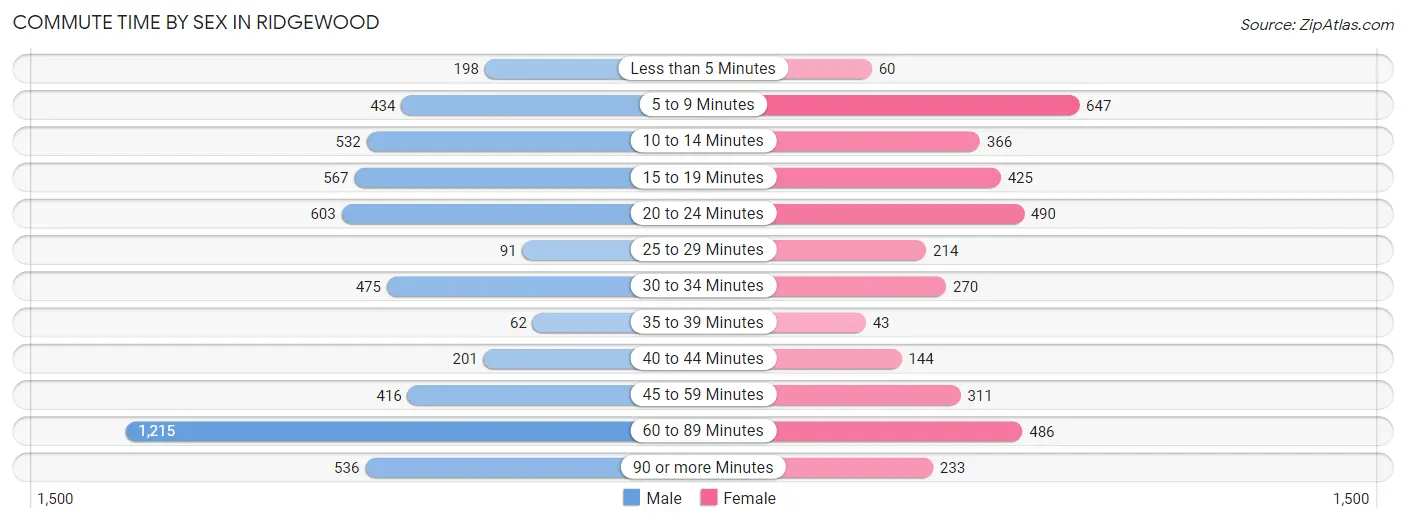
| Commute Time | Male | Female |
| Less than 5 Minutes | 198 (3.7%) | 60 (1.6%) |
| 5 to 9 Minutes | 434 (8.1%) | 647 (17.5%) |
| 10 to 14 Minutes | 532 (10.0%) | 366 (9.9%) |
| 15 to 19 Minutes | 567 (10.6%) | 425 (11.5%) |
| 20 to 24 Minutes | 603 (11.3%) | 490 (13.3%) |
| 25 to 29 Minutes | 91 (1.7%) | 214 (5.8%) |
| 30 to 34 Minutes | 475 (8.9%) | 270 (7.3%) |
| 35 to 39 Minutes | 62 (1.2%) | 43 (1.2%) |
| 40 to 44 Minutes | 201 (3.8%) | 144 (3.9%) |
| 45 to 59 Minutes | 416 (7.8%) | 311 (8.4%) |
| 60 to 89 Minutes | 1,215 (22.8%) | 486 (13.2%) |
| 90 or more Minutes | 536 (10.1%) | 233 (6.3%) |
Time of Departure to Work by Sex in Ridgewood
The most frequent times of departure to work in Ridgewood are 7:00 AM to 7:29 AM (1,010, 19.0%) for males and 8:00 AM to 8:29 AM (861, 23.3%) for females.
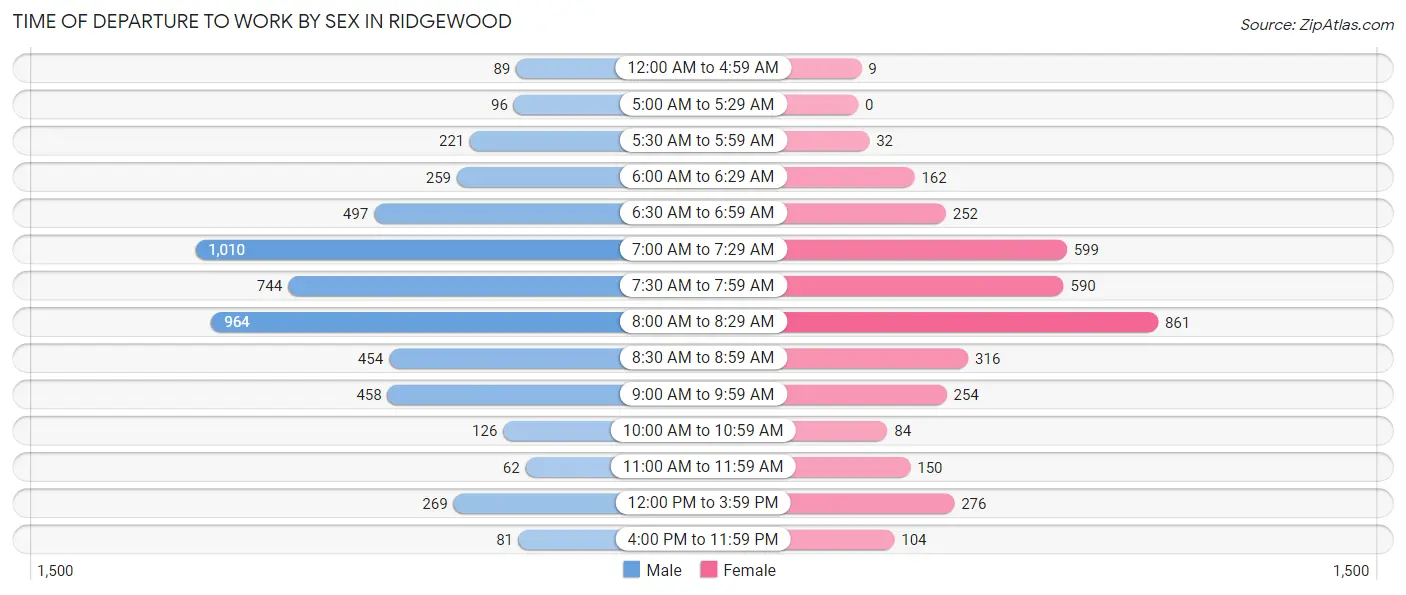
| Time of Departure | Male | Female |
| 12:00 AM to 4:59 AM | 89 (1.7%) | 9 (0.2%) |
| 5:00 AM to 5:29 AM | 96 (1.8%) | 0 (0.0%) |
| 5:30 AM to 5:59 AM | 221 (4.2%) | 32 (0.9%) |
| 6:00 AM to 6:29 AM | 259 (4.9%) | 162 (4.4%) |
| 6:30 AM to 6:59 AM | 497 (9.3%) | 252 (6.8%) |
| 7:00 AM to 7:29 AM | 1,010 (19.0%) | 599 (16.2%) |
| 7:30 AM to 7:59 AM | 744 (14.0%) | 590 (16.0%) |
| 8:00 AM to 8:29 AM | 964 (18.1%) | 861 (23.3%) |
| 8:30 AM to 8:59 AM | 454 (8.5%) | 316 (8.6%) |
| 9:00 AM to 9:59 AM | 458 (8.6%) | 254 (6.9%) |
| 10:00 AM to 10:59 AM | 126 (2.4%) | 84 (2.3%) |
| 11:00 AM to 11:59 AM | 62 (1.2%) | 150 (4.1%) |
| 12:00 PM to 3:59 PM | 269 (5.1%) | 276 (7.5%) |
| 4:00 PM to 11:59 PM | 81 (1.5%) | 104 (2.8%) |
| Total | 5,330 (100.0%) | 3,689 (100.0%) |
Housing Occupancy in Ridgewood
Occupancy by Ownership in Ridgewood
Of the total 8,692 dwellings in Ridgewood, owner-occupied units account for 7,217 (83.0%), while renter-occupied units make up 1,475 (17.0%).
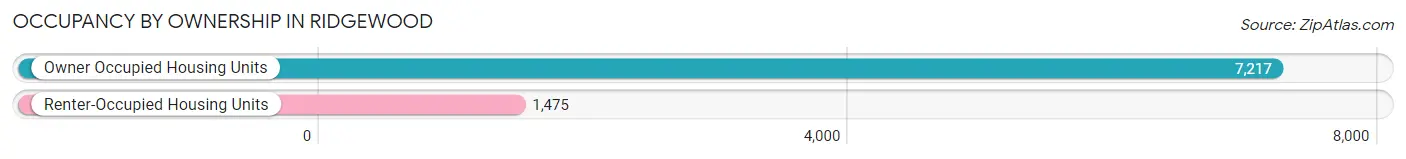
| Occupancy | # Housing Units | % Housing Units |
| Owner Occupied Housing Units | 7,217 | 83.0% |
| Renter-Occupied Housing Units | 1,475 | 17.0% |
| Total Occupied Housing Units | 8,692 | 100.0% |
Occupancy by Household Size in Ridgewood
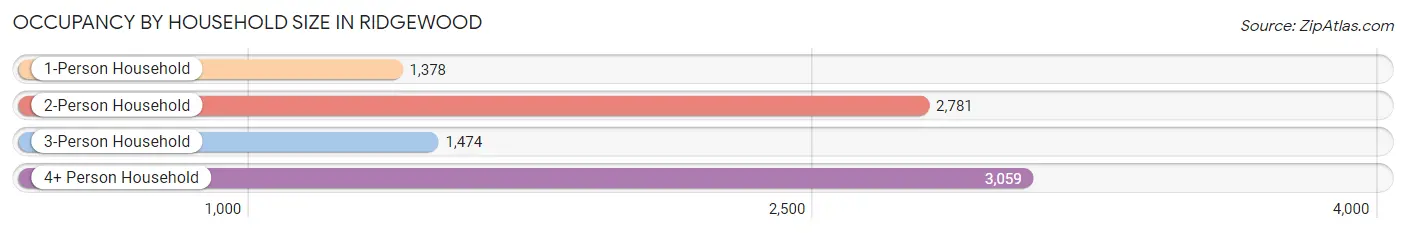
| Household Size | # Housing Units | % Housing Units |
| 1-Person Household | 1,378 | 15.9% |
| 2-Person Household | 2,781 | 32.0% |
| 3-Person Household | 1,474 | 17.0% |
| 4+ Person Household | 3,059 | 35.2% |
| Total Housing Units | 8,692 | 100.0% |
Occupancy by Ownership by Household Size in Ridgewood
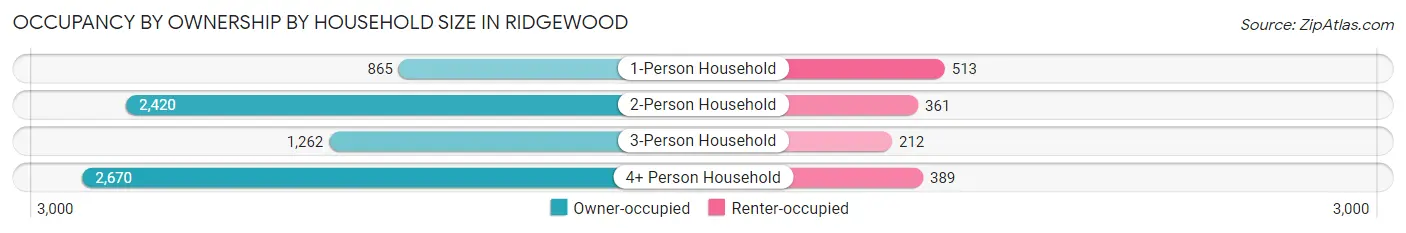
| Household Size | Owner-occupied | Renter-occupied |
| 1-Person Household | 865 (62.8%) | 513 (37.2%) |
| 2-Person Household | 2,420 (87.0%) | 361 (13.0%) |
| 3-Person Household | 1,262 (85.6%) | 212 (14.4%) |
| 4+ Person Household | 2,670 (87.3%) | 389 (12.7%) |
| Total Housing Units | 7,217 (83.0%) | 1,475 (17.0%) |
Occupancy by Educational Attainment in Ridgewood
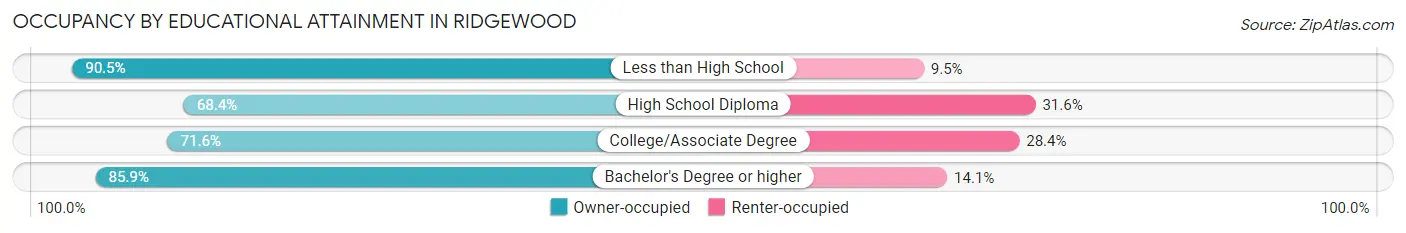
| Household Size | Owner-occupied | Renter-occupied |
| Less than High School | 67 (90.5%) | 7 (9.5%) |
| High School Diploma | 418 (68.4%) | 193 (31.6%) |
| College/Associate Degree | 745 (71.6%) | 295 (28.4%) |
| Bachelor's Degree or higher | 5,987 (85.9%) | 980 (14.1%) |
Occupancy by Age of Householder in Ridgewood
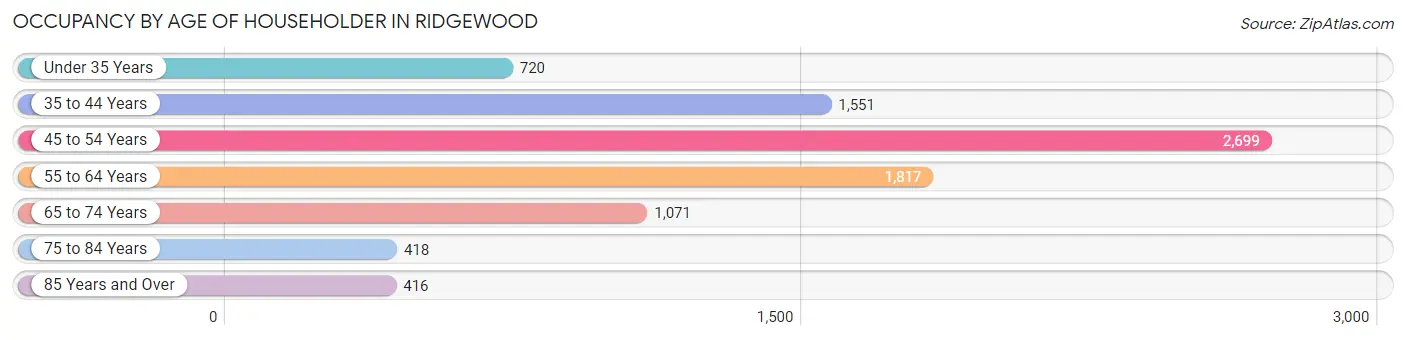
| Age Bracket | # Households | % Households |
| Under 35 Years | 720 | 8.3% |
| 35 to 44 Years | 1,551 | 17.8% |
| 45 to 54 Years | 2,699 | 31.0% |
| 55 to 64 Years | 1,817 | 20.9% |
| 65 to 74 Years | 1,071 | 12.3% |
| 75 to 84 Years | 418 | 4.8% |
| 85 Years and Over | 416 | 4.8% |
| Total | 8,692 | 100.0% |
Housing Finances in Ridgewood
Median Income by Occupancy in Ridgewood
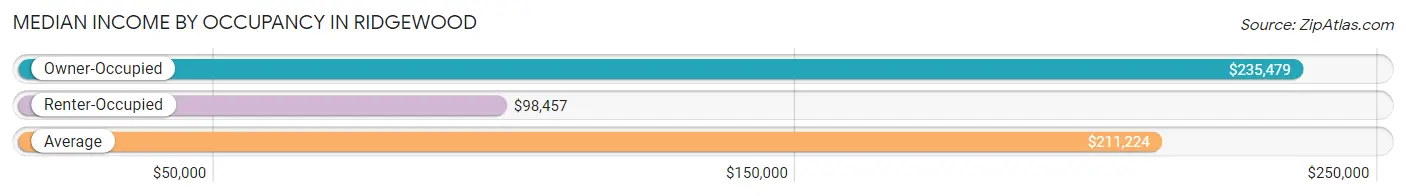
| Occupancy Type | # Households | Median Income |
| Owner-Occupied | 7,217 (83.0%) | $235,479 |
| Renter-Occupied | 1,475 (17.0%) | $98,457 |
| Average | 8,692 (100.0%) | $211,224 |
Occupancy by Householder Income Bracket in Ridgewood
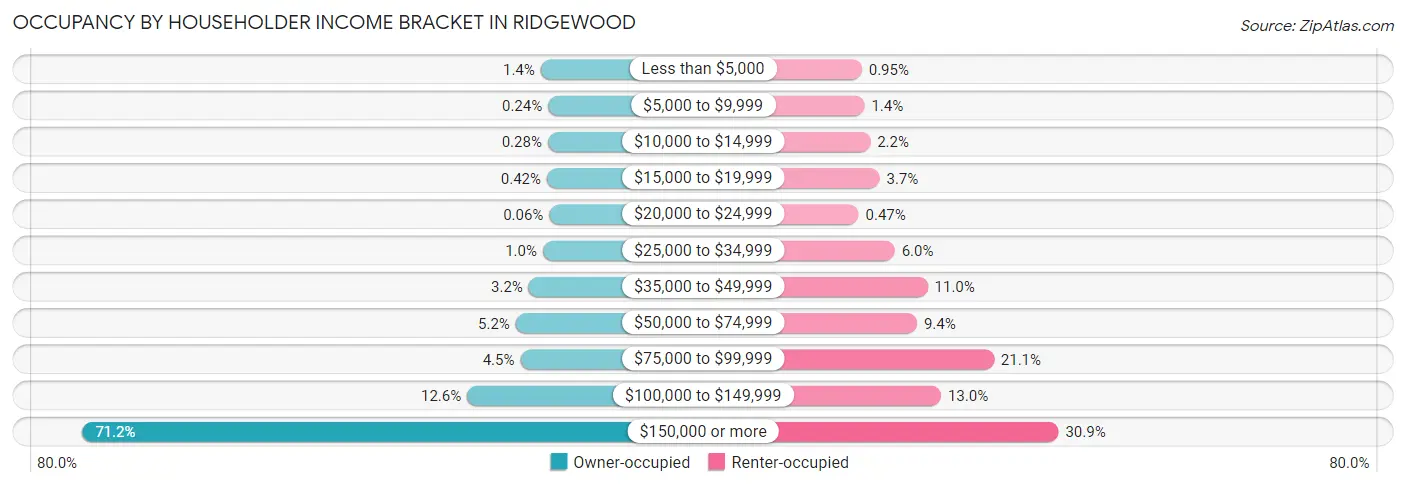
| Income Bracket | Owner-occupied | Renter-occupied |
| Less than $5,000 | 99 (1.4%) | 14 (0.9%) |
| $5,000 to $9,999 | 17 (0.2%) | 20 (1.4%) |
| $10,000 to $14,999 | 20 (0.3%) | 33 (2.2%) |
| $15,000 to $19,999 | 30 (0.4%) | 54 (3.7%) |
| $20,000 to $24,999 | 4 (0.1%) | 7 (0.5%) |
| $25,000 to $34,999 | 74 (1.0%) | 88 (6.0%) |
| $35,000 to $49,999 | 230 (3.2%) | 162 (11.0%) |
| $50,000 to $74,999 | 373 (5.2%) | 138 (9.4%) |
| $75,000 to $99,999 | 322 (4.5%) | 311 (21.1%) |
| $100,000 to $149,999 | 908 (12.6%) | 192 (13.0%) |
| $150,000 or more | 5,140 (71.2%) | 456 (30.9%) |
| Total | 7,217 (100.0%) | 1,475 (100.0%) |
Monthly Housing Cost Tiers in Ridgewood
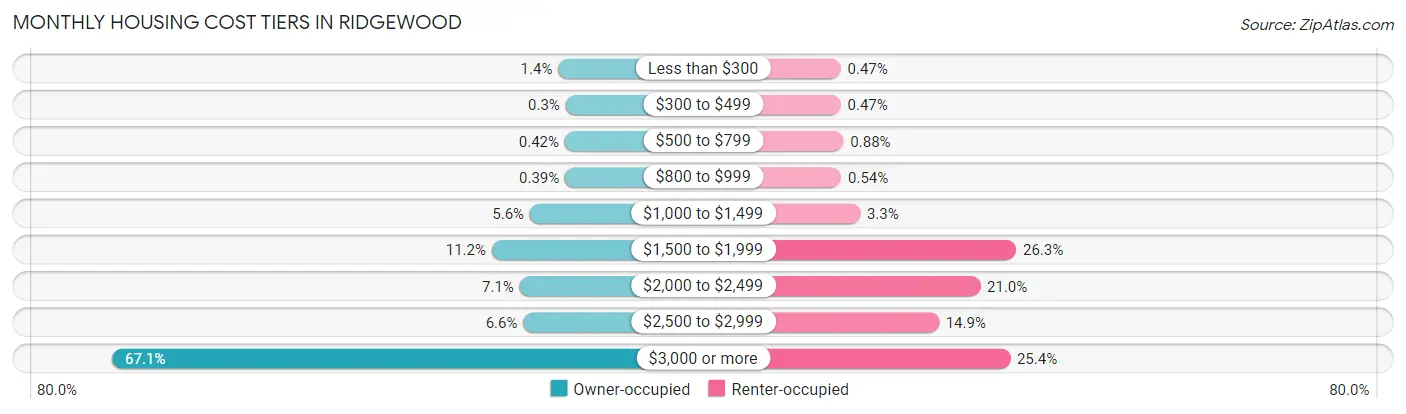
| Monthly Cost | Owner-occupied | Renter-occupied |
| Less than $300 | 101 (1.4%) | 7 (0.5%) |
| $300 to $499 | 22 (0.3%) | 7 (0.5%) |
| $500 to $799 | 30 (0.4%) | 13 (0.9%) |
| $800 to $999 | 28 (0.4%) | 8 (0.5%) |
| $1,000 to $1,499 | 402 (5.6%) | 49 (3.3%) |
| $1,500 to $1,999 | 807 (11.2%) | 388 (26.3%) |
| $2,000 to $2,499 | 511 (7.1%) | 310 (21.0%) |
| $2,500 to $2,999 | 473 (6.6%) | 220 (14.9%) |
| $3,000 or more | 4,843 (67.1%) | 375 (25.4%) |
| Total | 7,217 (100.0%) | 1,475 (100.0%) |
Physical Housing Characteristics in Ridgewood
Housing Structures in Ridgewood
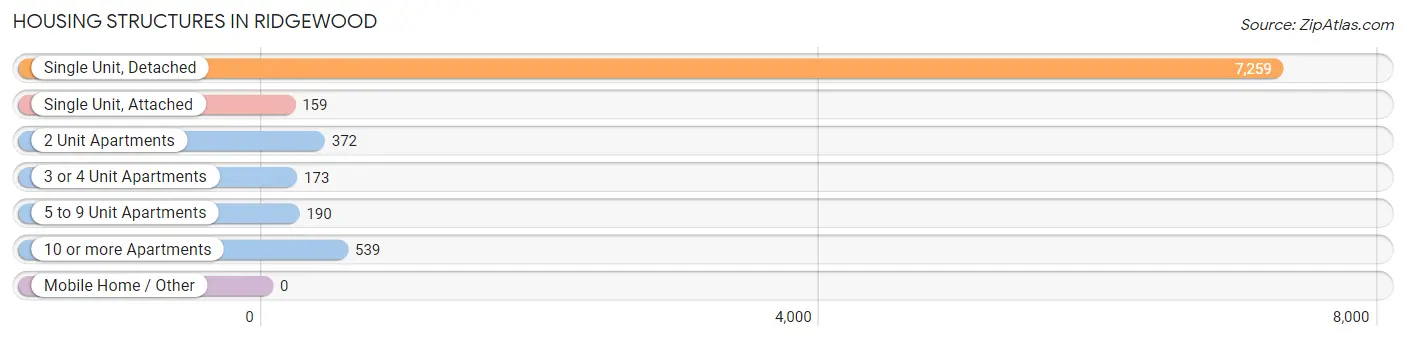
| Structure Type | # Housing Units | % Housing Units |
| Single Unit, Detached | 7,259 | 83.5% |
| Single Unit, Attached | 159 | 1.8% |
| 2 Unit Apartments | 372 | 4.3% |
| 3 or 4 Unit Apartments | 173 | 2.0% |
| 5 to 9 Unit Apartments | 190 | 2.2% |
| 10 or more Apartments | 539 | 6.2% |
| Mobile Home / Other | 0 | 0.0% |
| Total | 8,692 | 100.0% |
Housing Structures by Occupancy in Ridgewood
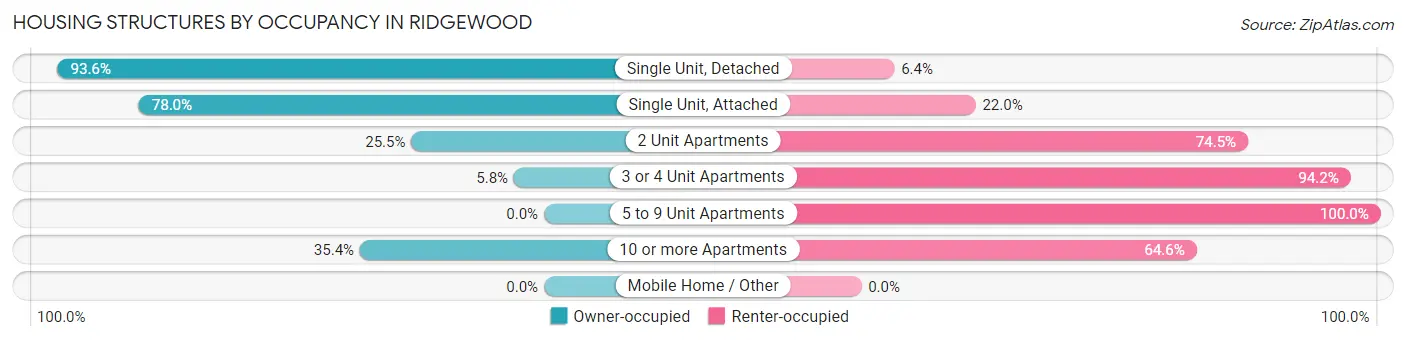
| Structure Type | Owner-occupied | Renter-occupied |
| Single Unit, Detached | 6,797 (93.6%) | 462 (6.4%) |
| Single Unit, Attached | 124 (78.0%) | 35 (22.0%) |
| 2 Unit Apartments | 95 (25.5%) | 277 (74.5%) |
| 3 or 4 Unit Apartments | 10 (5.8%) | 163 (94.2%) |
| 5 to 9 Unit Apartments | 0 (0.0%) | 190 (100.0%) |
| 10 or more Apartments | 191 (35.4%) | 348 (64.6%) |
| Mobile Home / Other | 0 (0.0%) | 0 (0.0%) |
| Total | 7,217 (83.0%) | 1,475 (17.0%) |
Housing Structures by Number of Rooms in Ridgewood
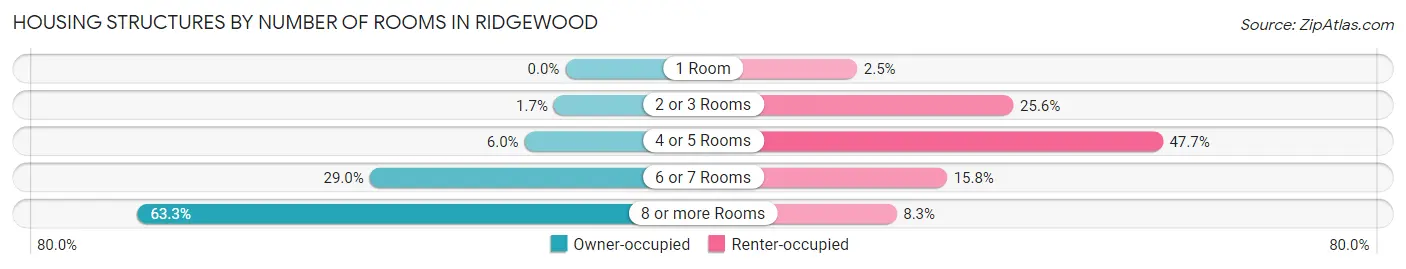
| Number of Rooms | Owner-occupied | Renter-occupied |
| 1 Room | 0 (0.0%) | 37 (2.5%) |
| 2 or 3 Rooms | 123 (1.7%) | 378 (25.6%) |
| 4 or 5 Rooms | 436 (6.0%) | 704 (47.7%) |
| 6 or 7 Rooms | 2,090 (29.0%) | 233 (15.8%) |
| 8 or more Rooms | 4,568 (63.3%) | 123 (8.3%) |
| Total | 7,217 (100.0%) | 1,475 (100.0%) |
Housing Structure by Heating Type in Ridgewood
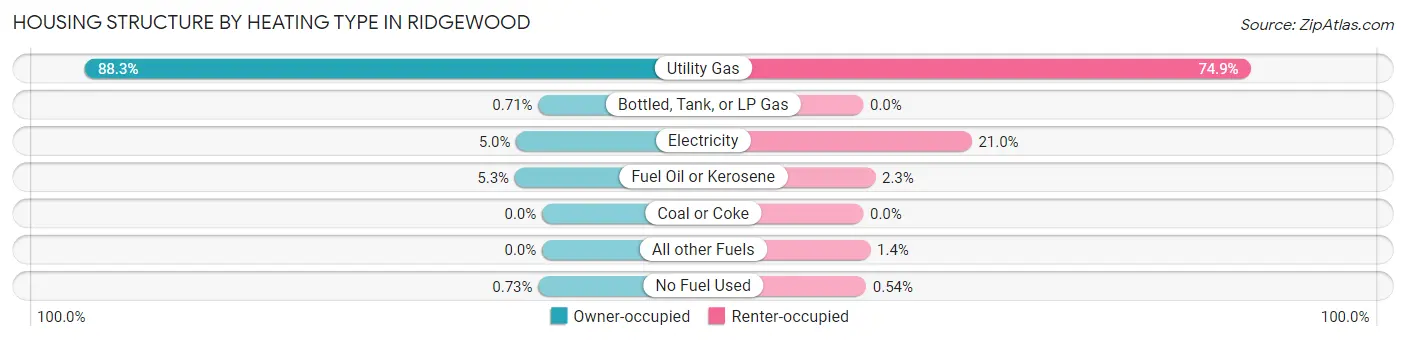
| Heating Type | Owner-occupied | Renter-occupied |
| Utility Gas | 6,375 (88.3%) | 1,104 (74.9%) |
| Bottled, Tank, or LP Gas | 51 (0.7%) | 0 (0.0%) |
| Electricity | 359 (5.0%) | 309 (20.9%) |
| Fuel Oil or Kerosene | 379 (5.2%) | 34 (2.3%) |
| Coal or Coke | 0 (0.0%) | 0 (0.0%) |
| All other Fuels | 0 (0.0%) | 20 (1.4%) |
| No Fuel Used | 53 (0.7%) | 8 (0.5%) |
| Total | 7,217 (100.0%) | 1,475 (100.0%) |
Household Vehicle Usage in Ridgewood
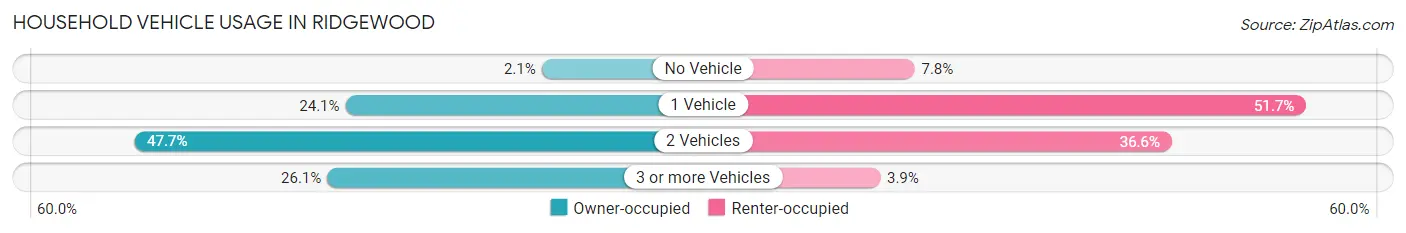
| Vehicles per Household | Owner-occupied | Renter-occupied |
| No Vehicle | 151 (2.1%) | 115 (7.8%) |
| 1 Vehicle | 1,737 (24.1%) | 762 (51.7%) |
| 2 Vehicles | 3,445 (47.7%) | 540 (36.6%) |
| 3 or more Vehicles | 1,884 (26.1%) | 58 (3.9%) |
| Total | 7,217 (100.0%) | 1,475 (100.0%) |
Real Estate & Mortgages in Ridgewood
Real Estate and Mortgage Overview in Ridgewood
| Characteristic | Without Mortgage | With Mortgage |
| Housing Units | 2,194 | 5,023 |
| Median Property Value | $797,700 | $884,500 |
| Median Household Income | $210,637 | $3,725 |
| Monthly Housing Costs | $1,501 | $4,563 |
| Real Estate Taxes | $10,001 | $27 |
Property Value by Mortgage Status in Ridgewood
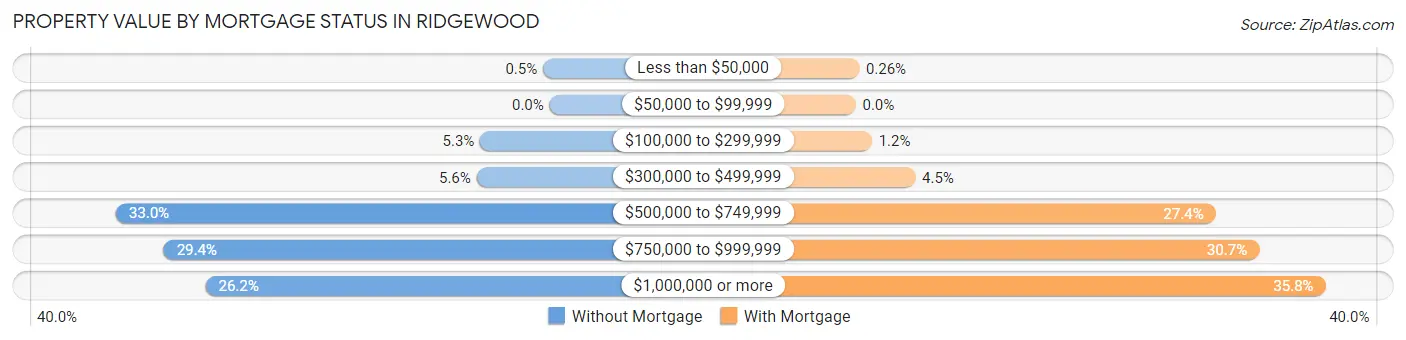
| Property Value | Without Mortgage | With Mortgage |
| Less than $50,000 | 11 (0.5%) | 13 (0.3%) |
| $50,000 to $99,999 | 0 (0.0%) | 0 (0.0%) |
| $100,000 to $299,999 | 116 (5.3%) | 62 (1.2%) |
| $300,000 to $499,999 | 122 (5.6%) | 228 (4.5%) |
| $500,000 to $749,999 | 725 (33.0%) | 1,378 (27.4%) |
| $750,000 to $999,999 | 645 (29.4%) | 1,544 (30.7%) |
| $1,000,000 or more | 575 (26.2%) | 1,798 (35.8%) |
| Total | 2,194 (100.0%) | 5,023 (100.0%) |
Household Income by Mortgage Status in Ridgewood
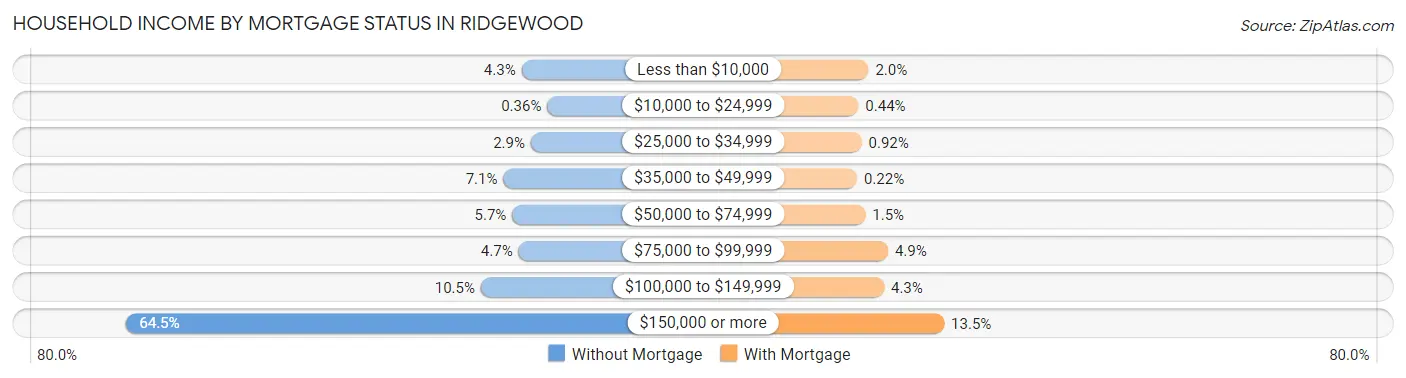
| Household Income | Without Mortgage | With Mortgage |
| Less than $10,000 | 94 (4.3%) | 99 (2.0%) |
| $10,000 to $24,999 | 8 (0.4%) | 22 (0.4%) |
| $25,000 to $34,999 | 63 (2.9%) | 46 (0.9%) |
| $35,000 to $49,999 | 155 (7.1%) | 11 (0.2%) |
| $50,000 to $74,999 | 125 (5.7%) | 75 (1.5%) |
| $75,000 to $99,999 | 104 (4.7%) | 248 (4.9%) |
| $100,000 to $149,999 | 230 (10.5%) | 218 (4.3%) |
| $150,000 or more | 1,415 (64.5%) | 678 (13.5%) |
| Total | 2,194 (100.0%) | 5,023 (100.0%) |
Property Value to Household Income Ratio in Ridgewood
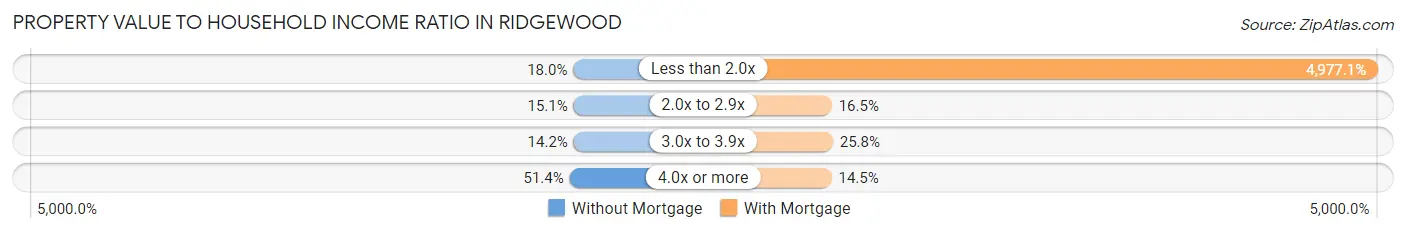
| Value-to-Income Ratio | Without Mortgage | With Mortgage |
| Less than 2.0x | 395 (18.0%) | 250,001 (4,977.1%) |
| 2.0x to 2.9x | 331 (15.1%) | 830 (16.5%) |
| 3.0x to 3.9x | 311 (14.2%) | 1,295 (25.8%) |
| 4.0x or more | 1,127 (51.4%) | 726 (14.4%) |
| Total | 2,194 (100.0%) | 5,023 (100.0%) |
Real Estate Taxes by Mortgage Status in Ridgewood
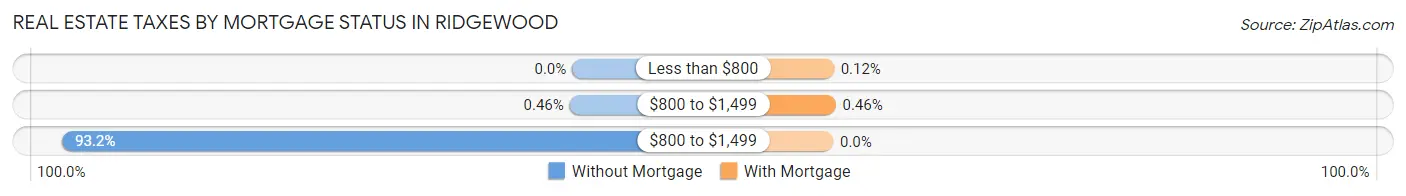
| Property Taxes | Without Mortgage | With Mortgage |
| Less than $800 | 0 (0.0%) | 6 (0.1%) |
| $800 to $1,499 | 10 (0.5%) | 23 (0.5%) |
| $800 to $1,499 | 2,044 (93.2%) | 0 (0.0%) |
| Total | 2,194 (100.0%) | 5,023 (100.0%) |
Health & Disability in Ridgewood
Health Insurance Coverage by Age in Ridgewood
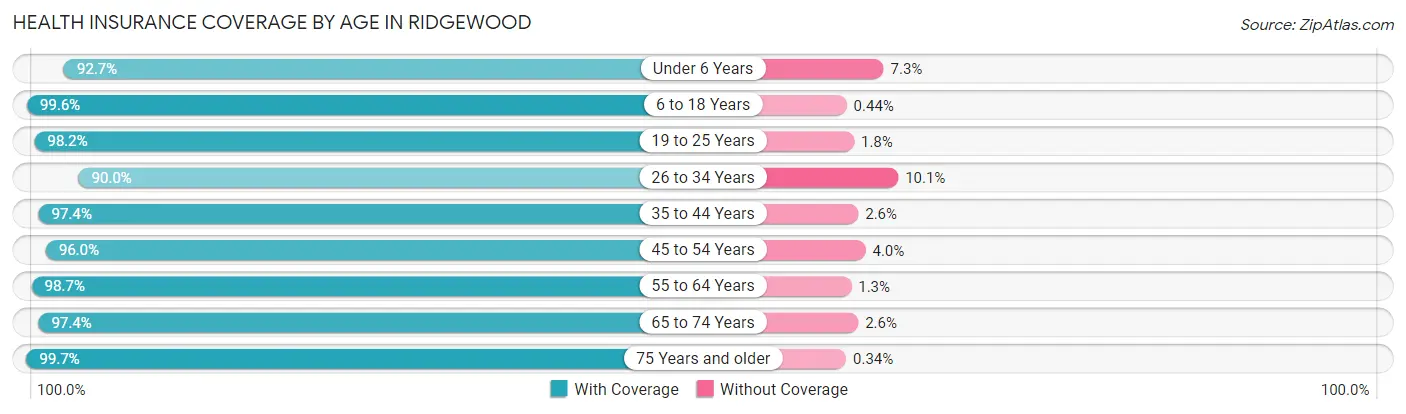
| Age Bracket | With Coverage | Without Coverage |
| Under 6 Years | 1,795 (92.7%) | 142 (7.3%) |
| 6 to 18 Years | 6,044 (99.6%) | 27 (0.4%) |
| 19 to 25 Years | 1,458 (98.2%) | 27 (1.8%) |
| 26 to 34 Years | 1,485 (89.9%) | 166 (10.1%) |
| 35 to 44 Years | 3,103 (97.4%) | 83 (2.6%) |
| 45 to 54 Years | 4,724 (96.0%) | 195 (4.0%) |
| 55 to 64 Years | 3,275 (98.7%) | 43 (1.3%) |
| 65 to 74 Years | 1,808 (97.4%) | 48 (2.6%) |
| 75 Years and older | 1,457 (99.7%) | 5 (0.3%) |
| Total | 25,149 (97.2%) | 736 (2.8%) |
Health Insurance Coverage by Citizenship Status in Ridgewood
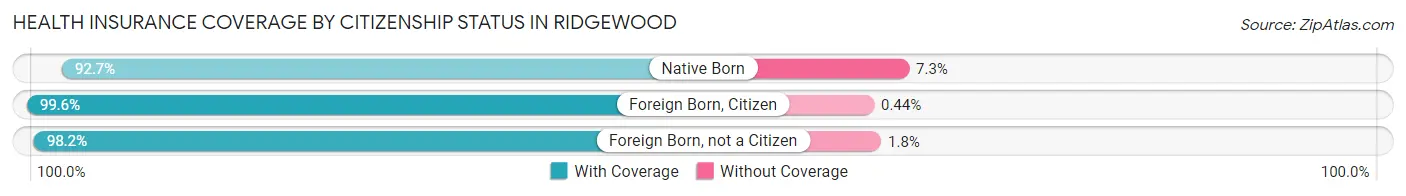
| Citizenship Status | With Coverage | Without Coverage |
| Native Born | 1,795 (92.7%) | 142 (7.3%) |
| Foreign Born, Citizen | 6,044 (99.6%) | 27 (0.4%) |
| Foreign Born, not a Citizen | 1,458 (98.2%) | 27 (1.8%) |
Health Insurance Coverage by Household Income in Ridgewood
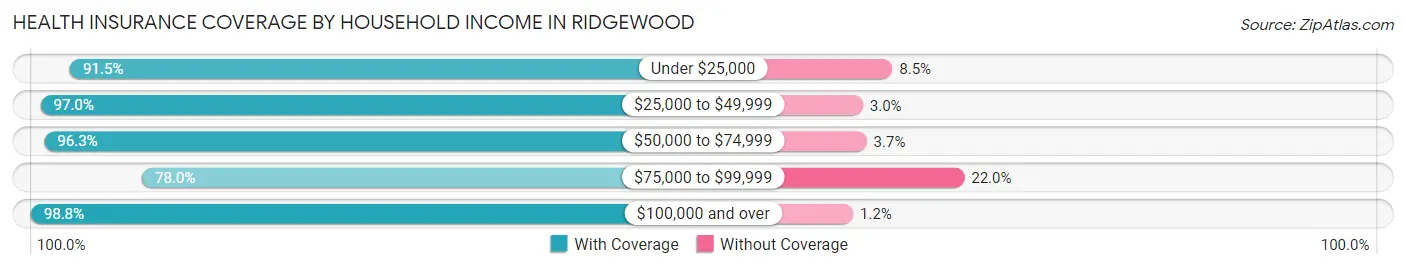
| Household Income | With Coverage | Without Coverage |
| Under $25,000 | 482 (91.5%) | 45 (8.5%) |
| $25,000 to $49,999 | 999 (97.0%) | 31 (3.0%) |
| $50,000 to $74,999 | 1,088 (96.3%) | 42 (3.7%) |
| $75,000 to $99,999 | 1,293 (78.0%) | 365 (22.0%) |
| $100,000 and over | 21,240 (98.8%) | 253 (1.2%) |
Public vs Private Health Insurance Coverage by Age in Ridgewood
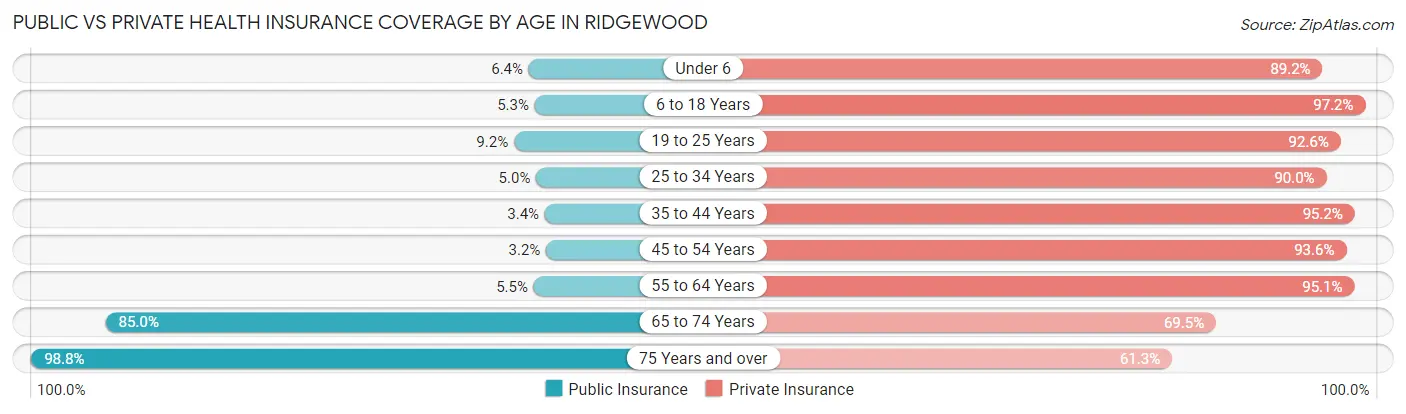
| Age Bracket | Public Insurance | Private Insurance |
| Under 6 | 124 (6.4%) | 1,728 (89.2%) |
| 6 to 18 Years | 322 (5.3%) | 5,899 (97.2%) |
| 19 to 25 Years | 136 (9.2%) | 1,375 (92.6%) |
| 25 to 34 Years | 83 (5.0%) | 1,485 (89.9%) |
| 35 to 44 Years | 109 (3.4%) | 3,033 (95.2%) |
| 45 to 54 Years | 157 (3.2%) | 4,605 (93.6%) |
| 55 to 64 Years | 182 (5.5%) | 3,156 (95.1%) |
| 65 to 74 Years | 1,577 (85.0%) | 1,289 (69.5%) |
| 75 Years and over | 1,444 (98.8%) | 896 (61.3%) |
| Total | 4,134 (16.0%) | 23,466 (90.6%) |
Disability Status by Sex by Age in Ridgewood
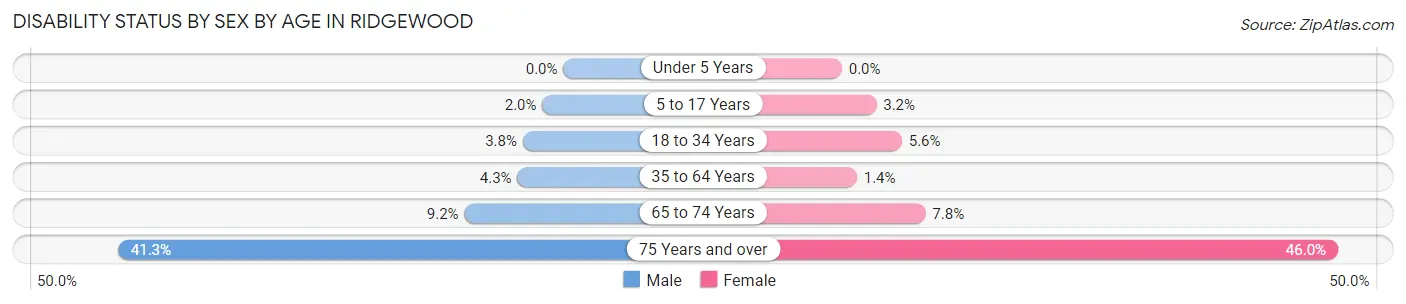
| Age Bracket | Male | Female |
| Under 5 Years | 0 (0.0%) | 0 (0.0%) |
| 5 to 17 Years | 60 (1.9%) | 93 (3.2%) |
| 18 to 34 Years | 66 (3.8%) | 106 (5.6%) |
| 35 to 64 Years | 247 (4.3%) | 78 (1.4%) |
| 65 to 74 Years | 71 (9.2%) | 84 (7.8%) |
| 75 Years and over | 291 (41.3%) | 349 (46.0%) |
Disability Class by Sex by Age in Ridgewood
Disability Class: Hearing Difficulty
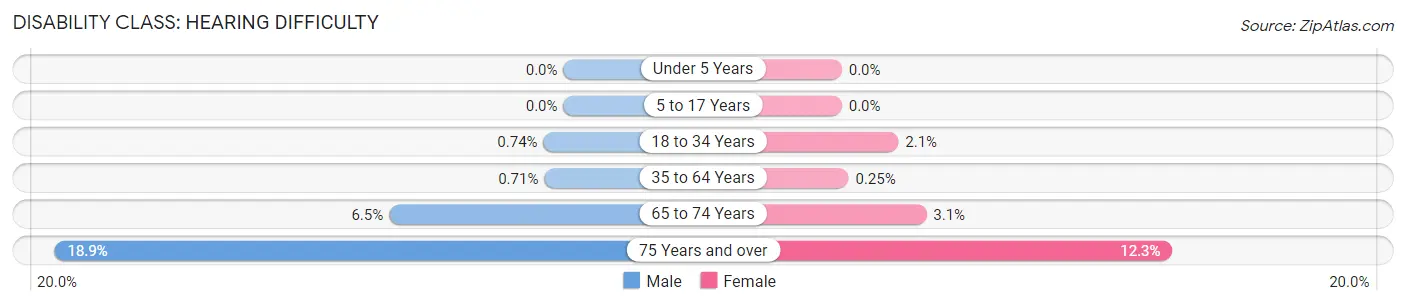
| Age Bracket | Male | Female |
| Under 5 Years | 0 (0.0%) | 0 (0.0%) |
| 5 to 17 Years | 0 (0.0%) | 0 (0.0%) |
| 18 to 34 Years | 13 (0.7%) | 40 (2.1%) |
| 35 to 64 Years | 41 (0.7%) | 14 (0.3%) |
| 65 to 74 Years | 50 (6.5%) | 34 (3.1%) |
| 75 Years and over | 133 (18.9%) | 93 (12.3%) |
Disability Class: Vision Difficulty
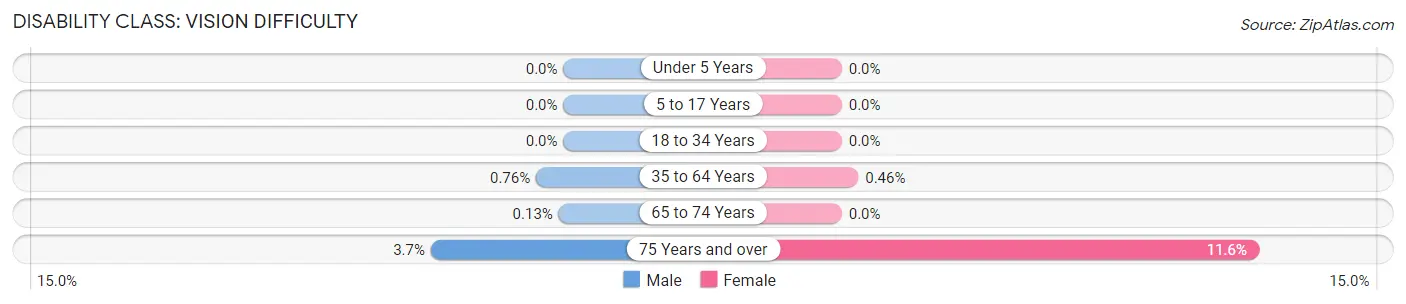
| Age Bracket | Male | Female |
| Under 5 Years | 0 (0.0%) | 0 (0.0%) |
| 5 to 17 Years | 0 (0.0%) | 0 (0.0%) |
| 18 to 34 Years | 0 (0.0%) | 0 (0.0%) |
| 35 to 64 Years | 44 (0.8%) | 26 (0.5%) |
| 65 to 74 Years | 1 (0.1%) | 0 (0.0%) |
| 75 Years and over | 26 (3.7%) | 88 (11.6%) |
Disability Class: Cognitive Difficulty
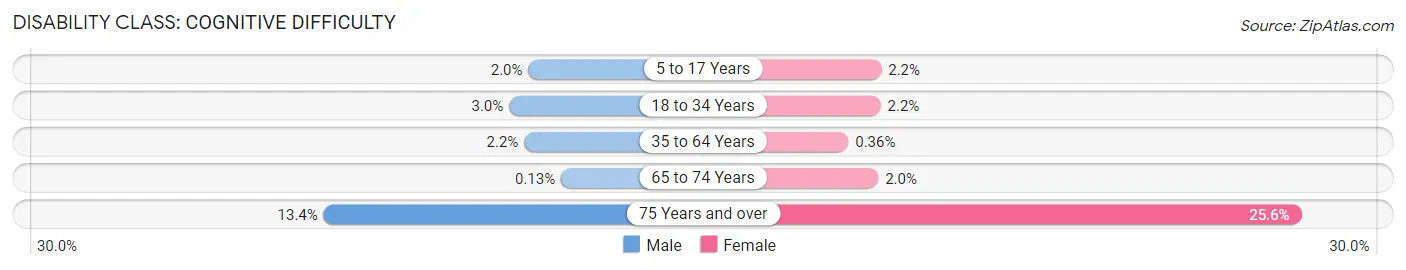
| Age Bracket | Male | Female |
| 5 to 17 Years | 60 (1.9%) | 64 (2.2%) |
| 18 to 34 Years | 53 (3.0%) | 41 (2.2%) |
| 35 to 64 Years | 126 (2.2%) | 20 (0.4%) |
| 65 to 74 Years | 1 (0.1%) | 22 (2.0%) |
| 75 Years and over | 94 (13.4%) | 194 (25.6%) |
Disability Class: Ambulatory Difficulty
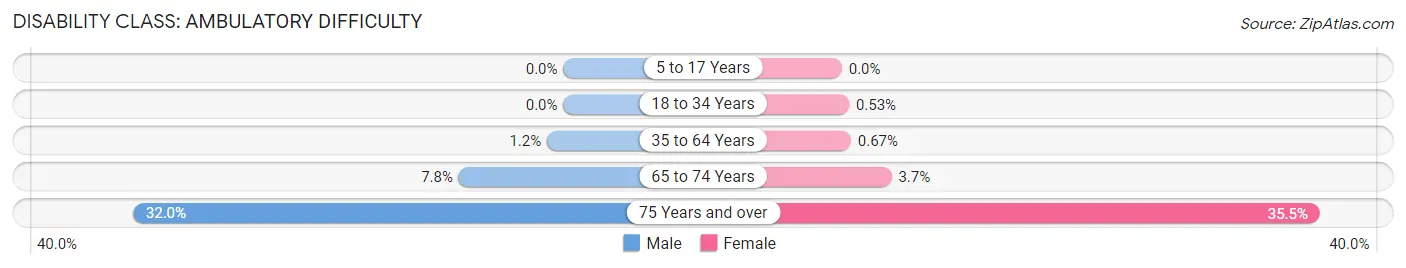
| Age Bracket | Male | Female |
| 5 to 17 Years | 0 (0.0%) | 0 (0.0%) |
| 18 to 34 Years | 0 (0.0%) | 10 (0.5%) |
| 35 to 64 Years | 70 (1.2%) | 38 (0.7%) |
| 65 to 74 Years | 60 (7.8%) | 40 (3.7%) |
| 75 Years and over | 225 (32.0%) | 269 (35.5%) |
Disability Class: Self-Care Difficulty
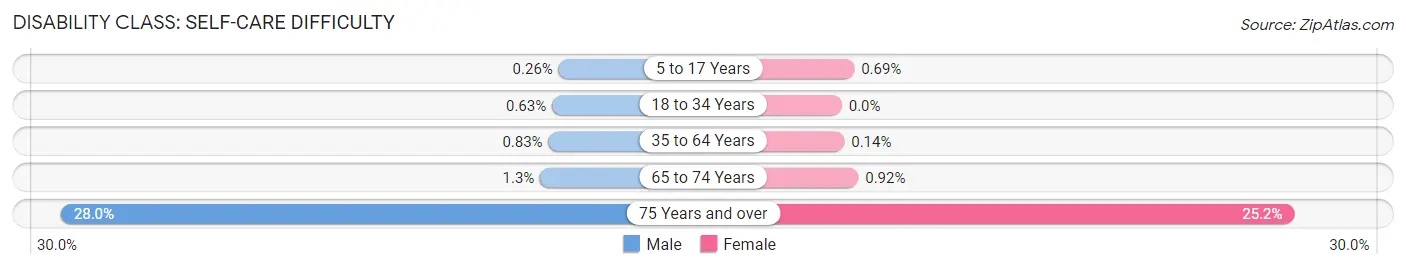
| Age Bracket | Male | Female |
| 5 to 17 Years | 8 (0.3%) | 20 (0.7%) |
| 18 to 34 Years | 11 (0.6%) | 0 (0.0%) |
| 35 to 64 Years | 48 (0.8%) | 8 (0.1%) |
| 65 to 74 Years | 10 (1.3%) | 10 (0.9%) |
| 75 Years and over | 197 (28.0%) | 191 (25.2%) |
Technology Access in Ridgewood
Computing Device Access in Ridgewood
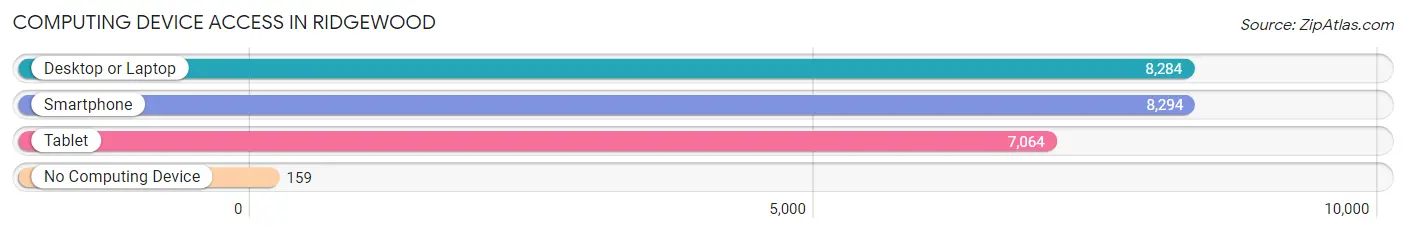
| Device Type | # Households | % Households |
| Desktop or Laptop | 8,284 | 95.3% |
| Smartphone | 8,294 | 95.4% |
| Tablet | 7,064 | 81.3% |
| No Computing Device | 159 | 1.8% |
| Total | 8,692 | 100.0% |
Internet Access in Ridgewood
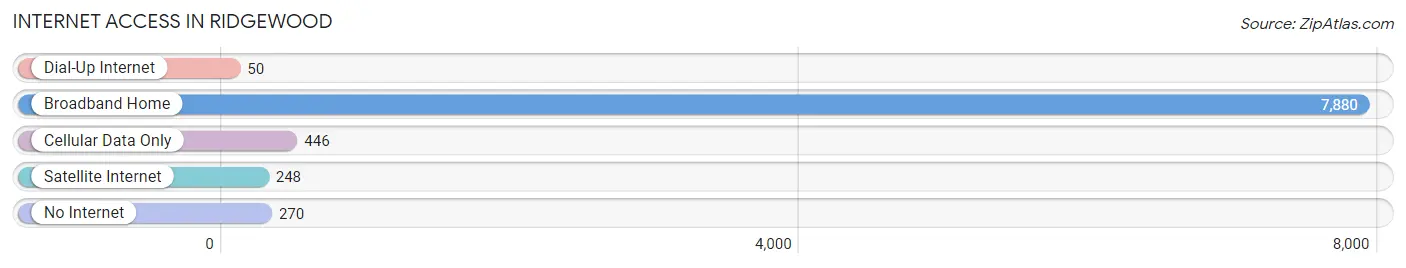
| Internet Type | # Households | % Households |
| Dial-Up Internet | 50 | 0.6% |
| Broadband Home | 7,880 | 90.7% |
| Cellular Data Only | 446 | 5.1% |
| Satellite Internet | 248 | 2.9% |
| No Internet | 270 | 3.1% |
| Total | 8,692 | 100.0% |
Ridgewood Summary
Ridgewood is a village located in Bergen County, New Jersey, United States. As of the 2010 United States Census, the village had a population of 24,958, reflecting an increase of 22 (+0.1%) from the 24,936 counted in the 2000 Census, which had in turn increased by 784 (+3.2%) from the 24,152 counted in the 1990 Census.
History
Ridgewood was first settled in 1712 by Dutch settlers who had moved eastward from New York City and the Hudson River Valley. The original settlers purchased the land from the Lenni Lenape Native Americans who had occupied the area for thousands of years prior. The village was originally known as Godwinville, named after the family who owned the land. In 1840, the village was renamed Ridgewood, after the surrounding Ridgewood Hills.
The village was incorporated in 1894. In the early 20th century, Ridgewood was a popular summer resort for wealthy New Yorkers. The village was home to several large estates, including the Vanderbeck and Van Dien estates.
Geography
Ridgewood is located at 40°58′45″N 74°09′45″W (40.979167, -74.162500). According to the United States Census Bureau, the village had a total area of 5.817 square miles (15.062 km2), including 5.788 square miles (15.000 km2) of land and 0.029 square miles (0.062 km2) of water (0.50%).
Ridgewood is located in the New York metropolitan area, approximately 20 miles (32 km) northwest of Manhattan. It is bordered by the villages of Ho-Ho-Kus, Glen Rock, Midland Park, Waldwick, and Washington Township.
Economy
Ridgewood is a primarily residential community, with a small commercial district located along East Ridgewood Avenue. The village is home to several small businesses, including restaurants, boutiques, and professional services. The village is also home to several corporate offices, including the headquarters of the Valley National Bank.
Demographics
As of the 2010 United States Census, there were 24,958 people, 8,845 households, and 6,717 families residing in the village. The population density was 4,306.2 per square mile (1,661.3/km2). There were 9,127 housing units at an average density of 1,571.2 per square mile (606.3/km2). The racial makeup of the village was 87.2% White, 0.8% African American, 0.1% Native American, 8.9% Asian, 0.0% Pacific Islander, 1.7% from other races, and 1.3% from two or more races. Hispanic or Latino of any race were 6.7% of the population.
There were 8,845 households, out of which 37.2% had children under the age of 18 living with them, 65.2% were married couples living together, 8.2% had a female householder with no husband present, and 24.2% were non-families. 20.7% of all households were made up of individuals, and 11.6% had someone living alone who was 65 years of age or older. The average household size was 2.77 and the average family size was 3.26.
In the village, the population was spread out, with 26.2% under the age of 18, 5.2% from 18 to 24, 22.3% from 25 to 44, 28.7% from 45 to 64, and 17.6% who were 65 years of age or older. The median age was 42.2 years. For every 100 females, there were 92.2 males. For every 100 females ages 18 and older there were 88.3 males.
The median income for a household in the village was $117,811, and the median income for a family was $139,941. Males had a median income of $90,146 versus $60,871 for females. The per capita income for the village was $60,557. About 1.8% of families and 2.8% of the population were below the poverty line, including 2.6% of those under age 18 and 4.2% of those age 65 or over.
Common Questions
What is Per Capita Income in Ridgewood?
Per Capita income in Ridgewood is $93,733.
What is the Median Family Income in Ridgewood?
Median Family Income in Ridgewood is $244,006.
What is the Median Household income in Ridgewood?
Median Household Income in Ridgewood is $211,224.
What is Income or Wage Gap in Ridgewood?
Income or Wage Gap in Ridgewood is 51.9%.
Women in Ridgewood earn 48.1 cents for every dollar earned by a man.
What is Inequality or Gini Index in Ridgewood?
Inequality or Gini Index in Ridgewood is 0.45.
What is the Total Population of Ridgewood?
Total Population of Ridgewood is 26,043.
What is the Total Male Population of Ridgewood?
Total Male Population of Ridgewood is 13,060.
What is the Total Female Population of Ridgewood?
Total Female Population of Ridgewood is 12,983.
What is the Ratio of Males per 100 Females in Ridgewood?
There are 100.59 Males per 100 Females in Ridgewood.
What is the Ratio of Females per 100 Males in Ridgewood?
There are 99.41 Females per 100 Males in Ridgewood.
What is the Median Population Age in Ridgewood?
Median Population Age in Ridgewood is 40.7 Years.
What is the Average Family Size in Ridgewood
Average Family Size in Ridgewood is 3.4 People.
What is the Average Household Size in Ridgewood
Average Household Size in Ridgewood is 3.0 People.
How Large is the Labor Force in Ridgewood?
There are 12,917 People in the Labor Forcein in Ridgewood.
What is the Percentage of People in the Labor Force in Ridgewood?
65.7% of People are in the Labor Force in Ridgewood.
What is the Unemployment Rate in Ridgewood?
Unemployment Rate in Ridgewood is 3.8%.