North Caldwell borough, NJ Map & Demographics
North Caldwell borough Overview
$101,872
PER CAPITA INCOME
$237,500
AVG FAMILY INCOME
$215,000
AVG HOUSEHOLD INCOME
49.7%
WAGE / INCOME GAP [ % ]
50.3¢/ $1
WAGE / INCOME GAP [ $ ]
0.44
INEQUALITY / GINI INDEX
6,625
TOTAL POPULATION
3,231
MALE POPULATION
3,394
FEMALE POPULATION
95.20
MALES / 100 FEMALES
105.04
FEMALES / 100 MALES
46.5
MEDIAN AGE
3.1
AVG FAMILY SIZE
3.0
AVG HOUSEHOLD SIZE
3,473
LABOR FORCE [ PEOPLE ]
67.7%
PERCENT IN LABOR FORCE
5.8%
UNEMPLOYMENT RATE
Income in North Caldwell borough
Income Overview in North Caldwell borough
Per Capita Income in North Caldwell borough is $101,872, while median incomes of families and households are $237,500 and $215,000 respectively.
| Characteristic | Number | Measure |
| Per Capita Income | 6,625 | $101,872 |
| Median Family Income | 2,022 | $237,500 |
| Mean Family Income | 2,022 | $314,816 |
| Median Household Income | 2,208 | $215,000 |
| Mean Household Income | 2,208 | $304,168 |
| Income Deficit | 2,022 | $0 |
| Wage / Income Gap (%) | 6,625 | 49.67% |
| Wage / Income Gap ($) | 6,625 | 50.33¢ per $1 |
| Gini / Inequality Index | 6,625 | 0.44 |
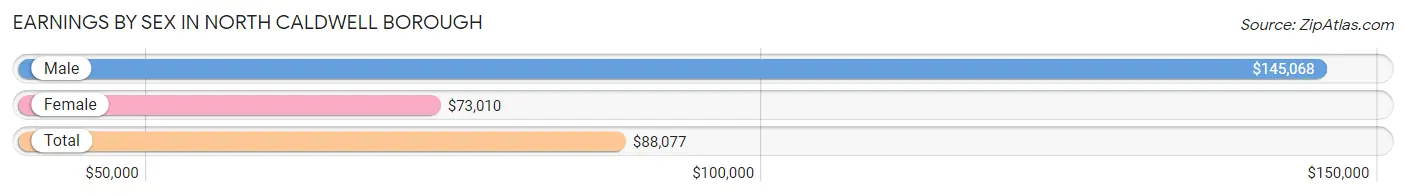
Earnings by Sex in North Caldwell borough
Average Earnings in North Caldwell borough are $88,077, $145,068 for men and $73,010 for women, a difference of 49.7%.
| Sex | Number | Average Earnings |
| Male | 1,812 (53.2%) | $145,068 |
| Female | 1,592 (46.8%) | $73,010 |
| Total | 3,404 (100.0%) | $88,077 |
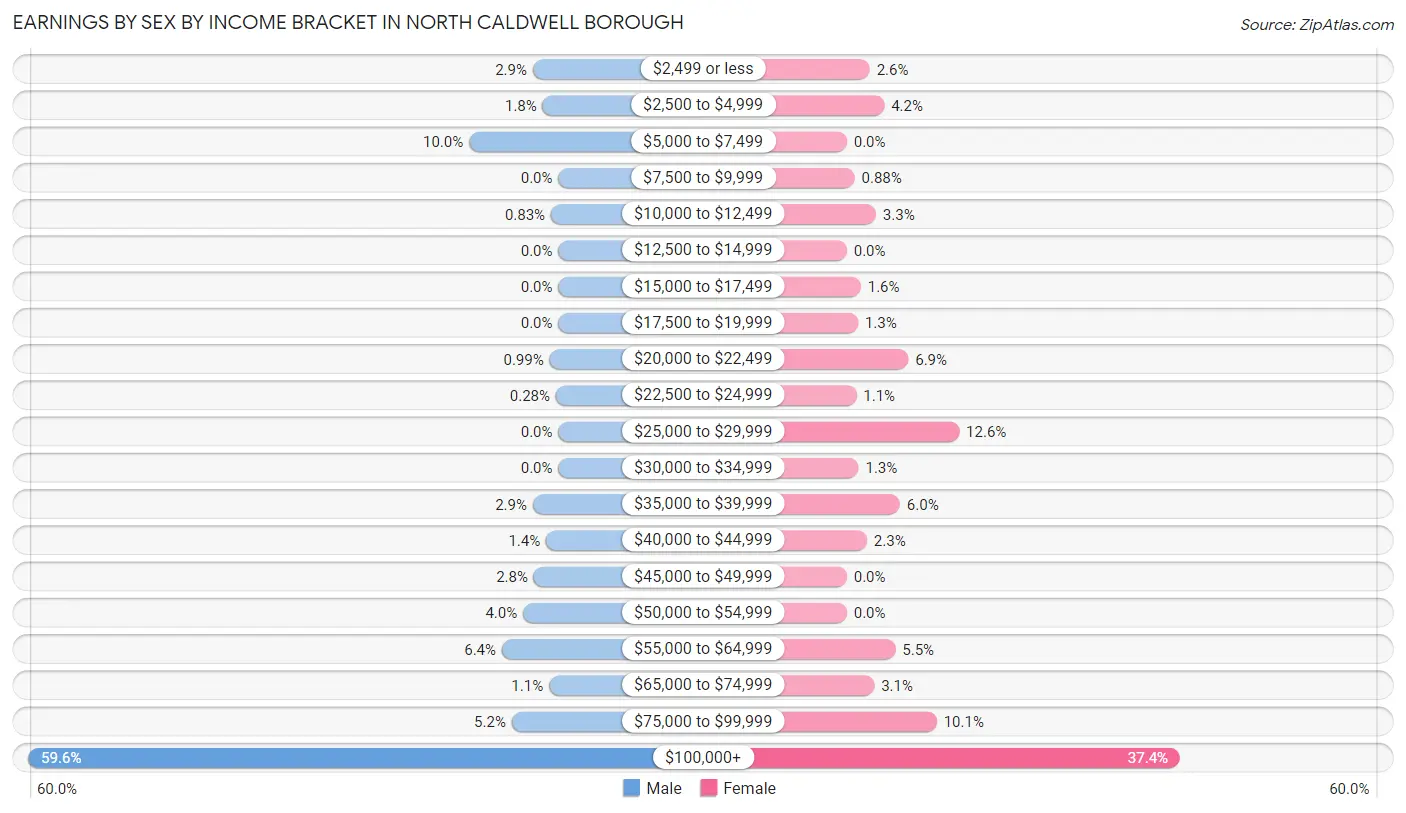
Earnings by Sex by Income Bracket in North Caldwell borough
The most common earnings brackets in North Caldwell borough are $100,000+ for men (1,080 | 59.6%) and $100,000+ for women (596 | 37.4%).
| Income | Male | Female |
| $2,499 or less | 52 (2.9%) | 41 (2.6%) |
| $2,500 to $4,999 | 32 (1.8%) | 67 (4.2%) |
| $5,000 to $7,499 | 182 (10.0%) | 0 (0.0%) |
| $7,500 to $9,999 | 0 (0.0%) | 14 (0.9%) |
| $10,000 to $12,499 | 15 (0.8%) | 52 (3.3%) |
| $12,500 to $14,999 | 0 (0.0%) | 0 (0.0%) |
| $15,000 to $17,499 | 0 (0.0%) | 25 (1.6%) |
| $17,500 to $19,999 | 0 (0.0%) | 20 (1.3%) |
| $20,000 to $22,499 | 18 (1.0%) | 110 (6.9%) |
| $22,500 to $24,999 | 5 (0.3%) | 17 (1.1%) |
| $25,000 to $29,999 | 0 (0.0%) | 201 (12.6%) |
| $30,000 to $34,999 | 0 (0.0%) | 21 (1.3%) |
| $35,000 to $39,999 | 52 (2.9%) | 95 (6.0%) |
| $40,000 to $44,999 | 25 (1.4%) | 36 (2.3%) |
| $45,000 to $49,999 | 50 (2.8%) | 0 (0.0%) |
| $50,000 to $54,999 | 72 (4.0%) | 0 (0.0%) |
| $55,000 to $64,999 | 115 (6.4%) | 87 (5.5%) |
| $65,000 to $74,999 | 19 (1.1%) | 49 (3.1%) |
| $75,000 to $99,999 | 95 (5.2%) | 161 (10.1%) |
| $100,000+ | 1,080 (59.6%) | 596 (37.4%) |
| Total | 1,812 (100.0%) | 1,592 (100.0%) |
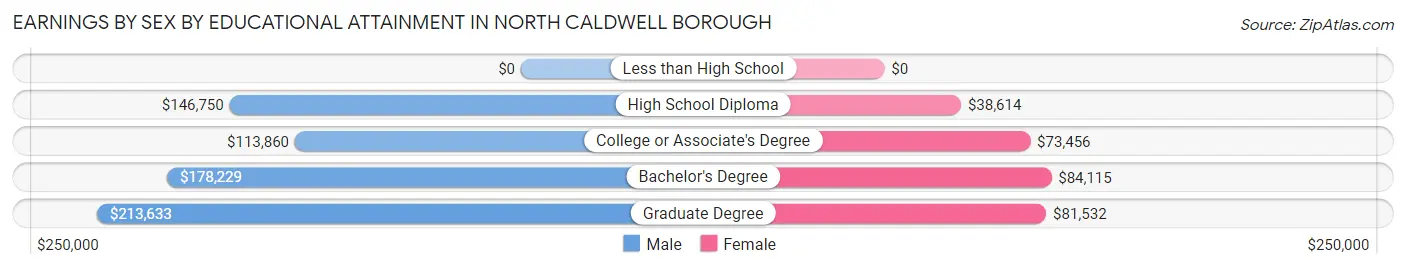
Earnings by Sex by Educational Attainment in North Caldwell borough
Average earnings in North Caldwell borough are $175,987 for men and $81,018 for women, a difference of 54.0%. Men with an educational attainment of graduate degree enjoy the highest average annual earnings of $213,633, while those with college or associate's degree education earn the least with $113,860. Women with an educational attainment of bachelor's degree earn the most with the average annual earnings of $84,115, while those with high school diploma education have the smallest earnings of $38,614.
| Educational Attainment | Male Income | Female Income |
| Less than High School | - | - |
| High School Diploma | $146,750 | $38,614 |
| College or Associate's Degree | $113,860 | $73,456 |
| Bachelor's Degree | $178,229 | $84,115 |
| Graduate Degree | $213,633 | $81,532 |
| Total | $175,987 | $81,018 |
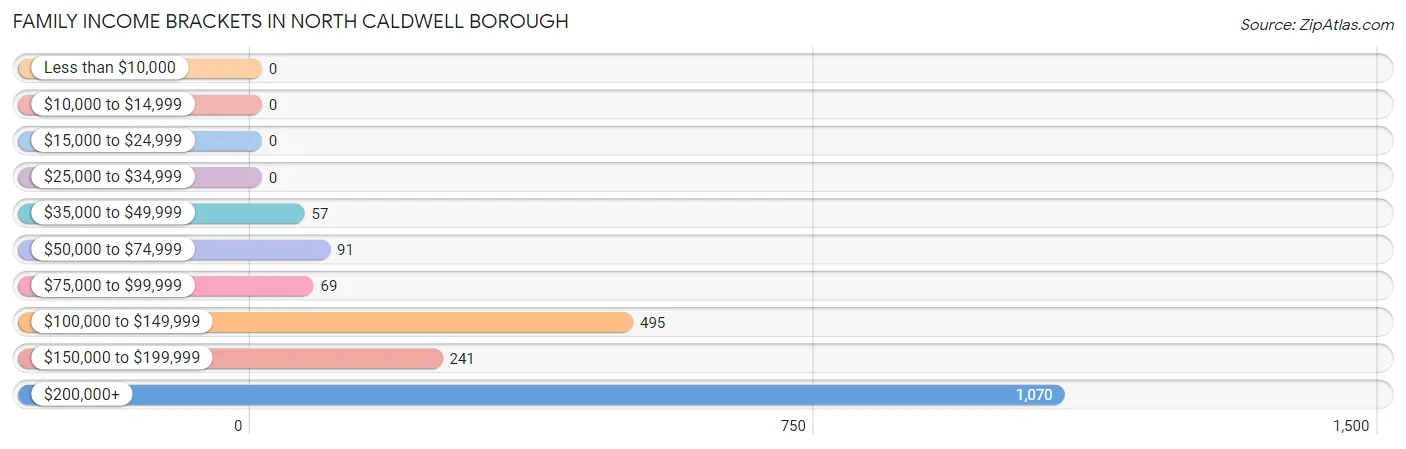
Family Income in North Caldwell borough
Family Income Brackets in North Caldwell borough
According to the North Caldwell borough family income data, there are 1,070 families falling into the $200,000+ income range, which is the most common income bracket and makes up 52.9% of all families.
| Income Bracket | # Families | % Families |
| Less than $10,000 | 0 | 0.0% |
| $10,000 to $14,999 | 0 | 0.0% |
| $15,000 to $24,999 | 0 | 0.0% |
| $25,000 to $34,999 | 0 | 0.0% |
| $35,000 to $49,999 | 57 | 2.8% |
| $50,000 to $74,999 | 91 | 4.5% |
| $75,000 to $99,999 | 69 | 3.4% |
| $100,000 to $149,999 | 495 | 24.5% |
| $150,000 to $199,999 | 241 | 11.9% |
| $200,000+ | 1,070 | 52.9% |
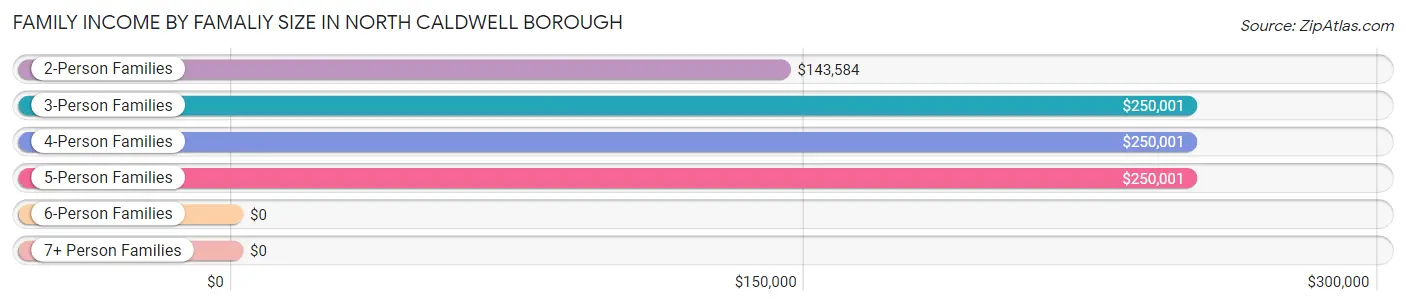
Family Income by Famaliy Size in North Caldwell borough
3-person families (447 | 22.1%) account for the highest median family income in North Caldwell borough with $250,001 per family, while 3-person families (447 | 22.1%) have the highest median income of $83,334 per family member.
| Income Bracket | # Families | Median Income |
| 2-Person Families | 852 (42.1%) | $143,584 |
| 3-Person Families | 447 (22.1%) | $250,001 |
| 4-Person Families | 518 (25.6%) | $250,001 |
| 5-Person Families | 205 (10.1%) | $250,001 |
| 6-Person Families | 0 (0.0%) | $0 |
| 7+ Person Families | 0 (0.0%) | $0 |
| Total | 2,022 (100.0%) | $237,500 |
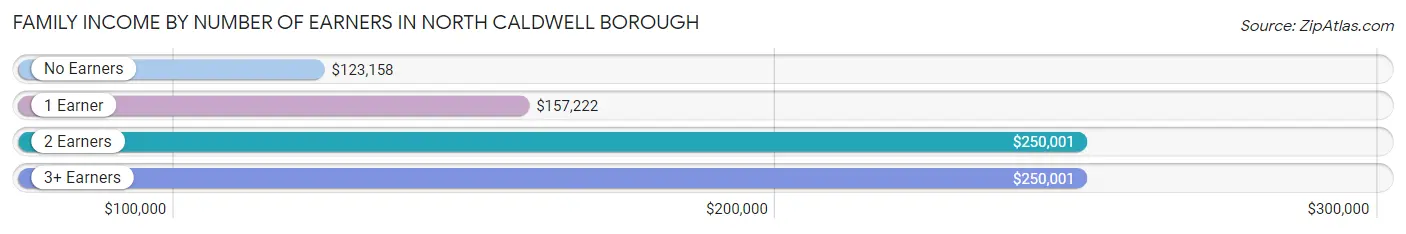
Family Income by Number of Earners in North Caldwell borough
The median family income in North Caldwell borough is $237,500, with families comprising 2 earners (891) having the highest median family income of $250,001, while families with no earners (344) have the lowest median family income of $123,158, accounting for 44.1% and 17.0% of families, respectively.
| Number of Earners | # Families | Median Income |
| No Earners | 344 (17.0%) | $123,158 |
| 1 Earner | 558 (27.6%) | $157,222 |
| 2 Earners | 891 (44.1%) | $250,001 |
| 3+ Earners | 229 (11.3%) | $250,001 |
| Total | 2,022 (100.0%) | $237,500 |
Household Income in North Caldwell borough
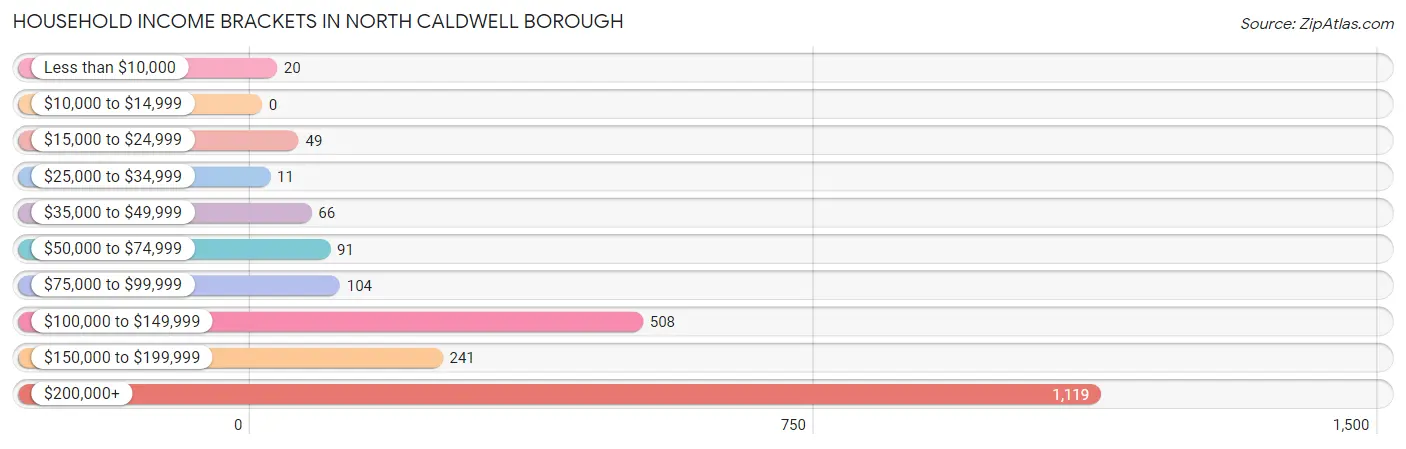
Household Income Brackets in North Caldwell borough
With 1,119 households falling in the category, the $200,000+ income range is the most frequent in North Caldwell borough, accounting for 50.7% of all households.
| Income Bracket | # Households | % Households |
| Less than $10,000 | 20 | 0.9% |
| $10,000 to $14,999 | 0 | 0.0% |
| $15,000 to $24,999 | 49 | 2.2% |
| $25,000 to $34,999 | 11 | 0.5% |
| $35,000 to $49,999 | 66 | 3.0% |
| $50,000 to $74,999 | 91 | 4.1% |
| $75,000 to $99,999 | 104 | 4.7% |
| $100,000 to $149,999 | 508 | 23.0% |
| $150,000 to $199,999 | 241 | 10.9% |
| $200,000+ | 1,119 | 50.7% |
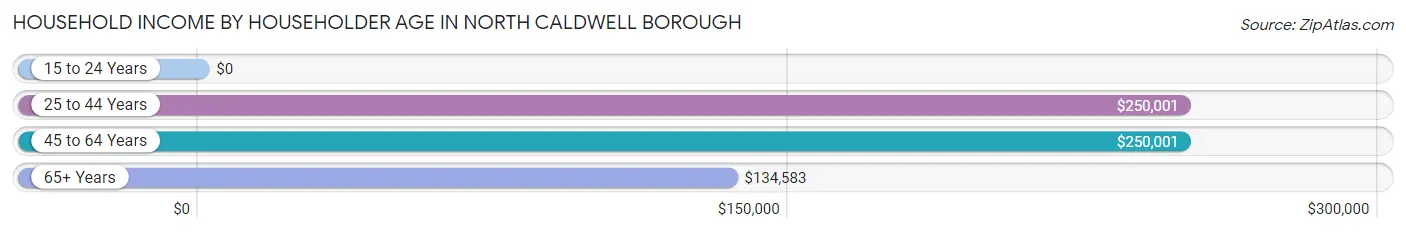
Household Income by Householder Age in North Caldwell borough
The median household income in North Caldwell borough is $215,000, with the highest median household income of $250,001 found in the 25 to 44 years age bracket for the primary householder. A total of 402 households (18.2%) fall into this category.
| Income Bracket | # Households | Median Income |
| 15 to 24 Years | 0 (0.0%) | $0 |
| 25 to 44 Years | 402 (18.2%) | $250,001 |
| 45 to 64 Years | 1,072 (48.5%) | $250,001 |
| 65+ Years | 734 (33.2%) | $134,583 |
| Total | 2,208 (100.0%) | $215,000 |
Poverty in North Caldwell borough
Income Below Poverty by Sex and Age in North Caldwell borough
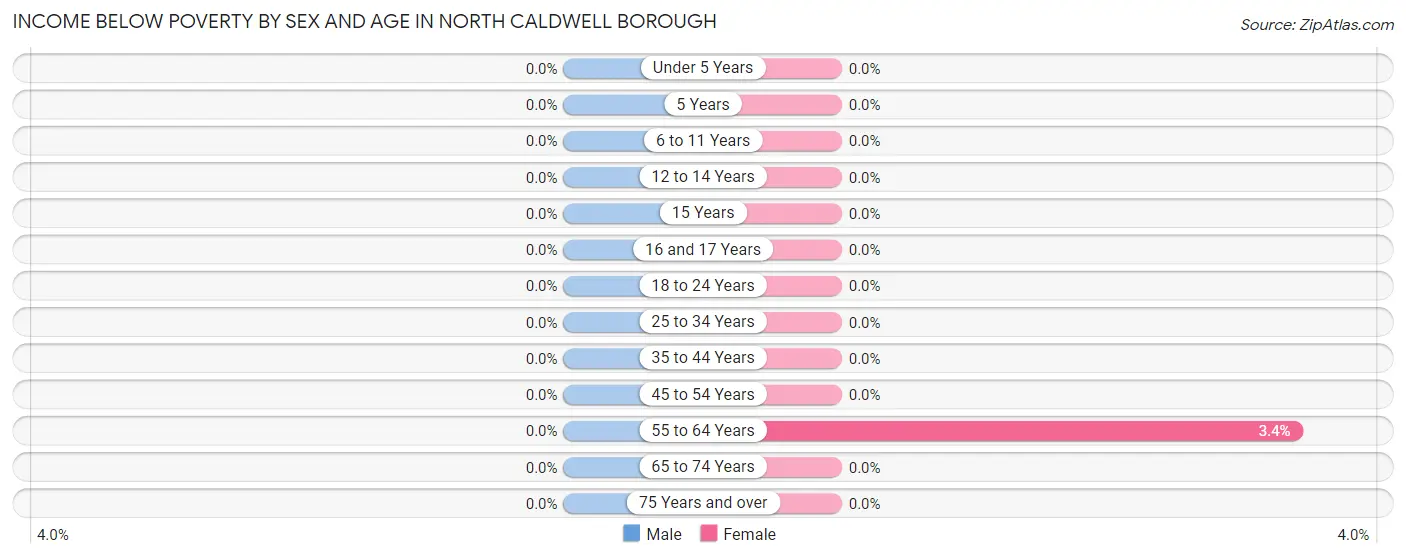
| Age Bracket | Male | Female |
| Under 5 Years | 0 (0.0%) | 0 (0.0%) |
| 5 Years | 0 (0.0%) | 0 (0.0%) |
| 6 to 11 Years | 0 (0.0%) | 0 (0.0%) |
| 12 to 14 Years | 0 (0.0%) | 0 (0.0%) |
| 15 Years | 0 (0.0%) | 0 (0.0%) |
| 16 and 17 Years | 0 (0.0%) | 0 (0.0%) |
| 18 to 24 Years | 0 (0.0%) | 0 (0.0%) |
| 25 to 34 Years | 0 (0.0%) | 0 (0.0%) |
| 35 to 44 Years | 0 (0.0%) | 0 (0.0%) |
| 45 to 54 Years | 0 (0.0%) | 0 (0.0%) |
| 55 to 64 Years | 0 (0.0%) | 19 (3.4%) |
| 65 to 74 Years | 0 (0.0%) | 0 (0.0%) |
| 75 Years and over | 0 (0.0%) | 0 (0.0%) |
| Total | 0 (0.0%) | 19 (0.6%) |
Income Above Poverty by Sex and Age in North Caldwell borough
According to the poverty statistics in North Caldwell borough, males aged under 5 years and females aged under 5 years are the age groups that are most secure financially, with 100.0% of males and 100.0% of females in these age groups living above the poverty line.
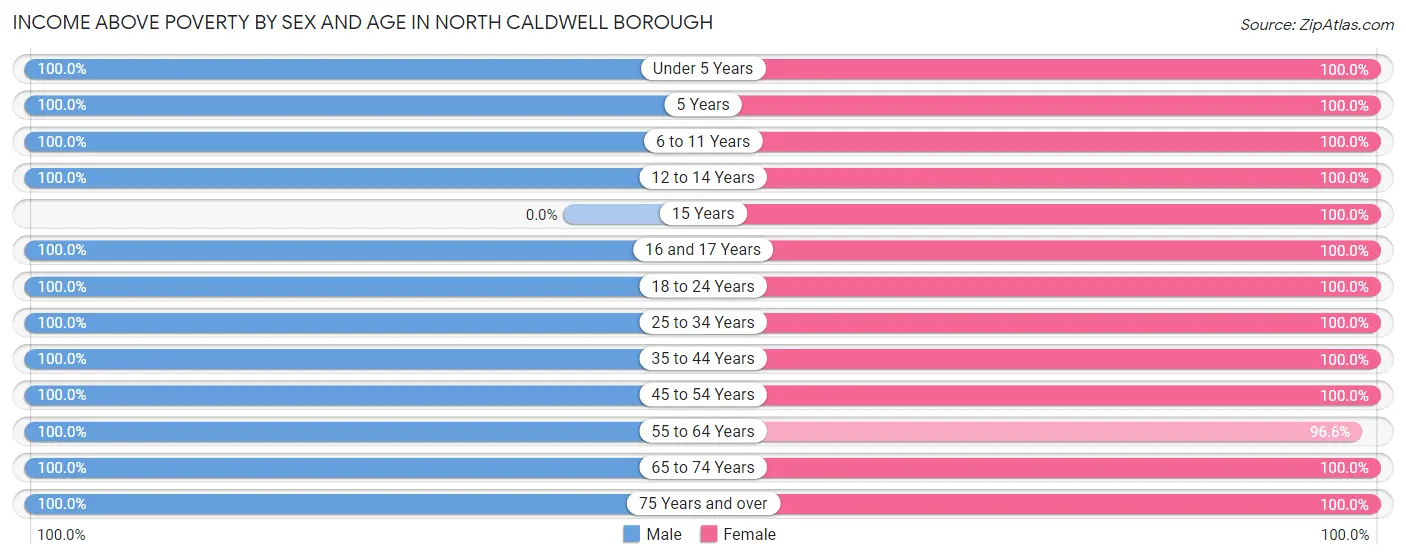
| Age Bracket | Male | Female |
| Under 5 Years | 213 (100.0%) | 218 (100.0%) |
| 5 Years | 39 (100.0%) | 38 (100.0%) |
| 6 to 11 Years | 333 (100.0%) | 146 (100.0%) |
| 12 to 14 Years | 146 (100.0%) | 281 (100.0%) |
| 15 Years | 0 (0.0%) | 81 (100.0%) |
| 16 and 17 Years | 108 (100.0%) | 23 (100.0%) |
| 18 to 24 Years | 242 (100.0%) | 182 (100.0%) |
| 25 to 34 Years | 192 (100.0%) | 142 (100.0%) |
| 35 to 44 Years | 401 (100.0%) | 346 (100.0%) |
| 45 to 54 Years | 423 (100.0%) | 500 (100.0%) |
| 55 to 64 Years | 559 (100.0%) | 536 (96.6%) |
| 65 to 74 Years | 349 (100.0%) | 626 (100.0%) |
| 75 Years and over | 226 (100.0%) | 256 (100.0%) |
| Total | 3,231 (100.0%) | 3,375 (99.4%) |
Income Below Poverty Among Married-Couple Families in North Caldwell borough
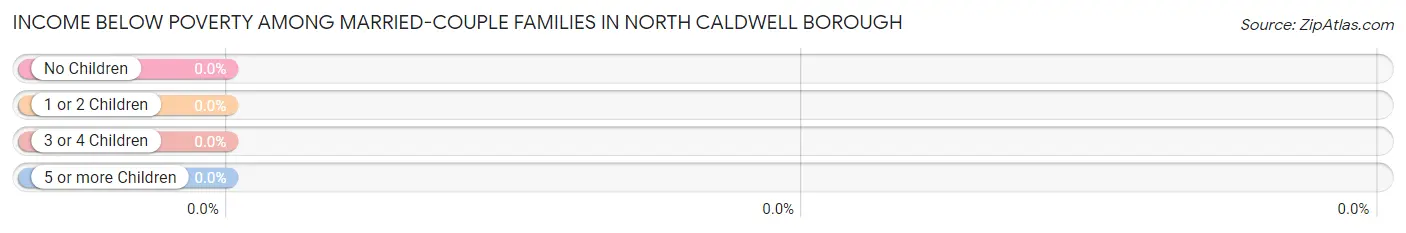
| Children | Above Poverty | Below Poverty |
| No Children | 1,022 (100.0%) | 0 (0.0%) |
| 1 or 2 Children | 543 (100.0%) | 0 (0.0%) |
| 3 or 4 Children | 132 (100.0%) | 0 (0.0%) |
| 5 or more Children | 0 (0.0%) | 0 (0.0%) |
| Total | 1,697 (100.0%) | 0 (0.0%) |
Income Below Poverty Among Single-Parent Households in North Caldwell borough
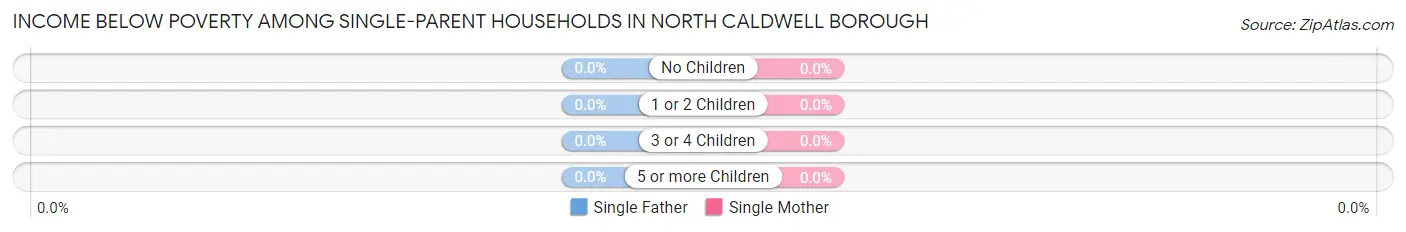
| Children | Single Father | Single Mother |
| No Children | 0 (0.0%) | 0 (0.0%) |
| 1 or 2 Children | 0 (0.0%) | 0 (0.0%) |
| 3 or 4 Children | 0 (0.0%) | 0 (0.0%) |
| 5 or more Children | 0 (0.0%) | 0 (0.0%) |
| Total | 0 (0.0%) | 0 (0.0%) |
Income Below Poverty Among Married-Couple vs Single-Parent Households in North Caldwell borough
| Children | Married-Couple Families | Single-Parent Households |
| No Children | 0 (0.0%) | 0 (0.0%) |
| 1 or 2 Children | 0 (0.0%) | 0 (0.0%) |
| 3 or 4 Children | 0 (0.0%) | 0 (0.0%) |
| 5 or more Children | 0 (0.0%) | 0 (0.0%) |
| Total | 0 (0.0%) | 0 (0.0%) |
Race in North Caldwell borough
The most populous races in North Caldwell borough are White / Caucasian (5,666 | 85.5%), Asian (533 | 8.1%), and Hispanic or Latino (347 | 5.2%).
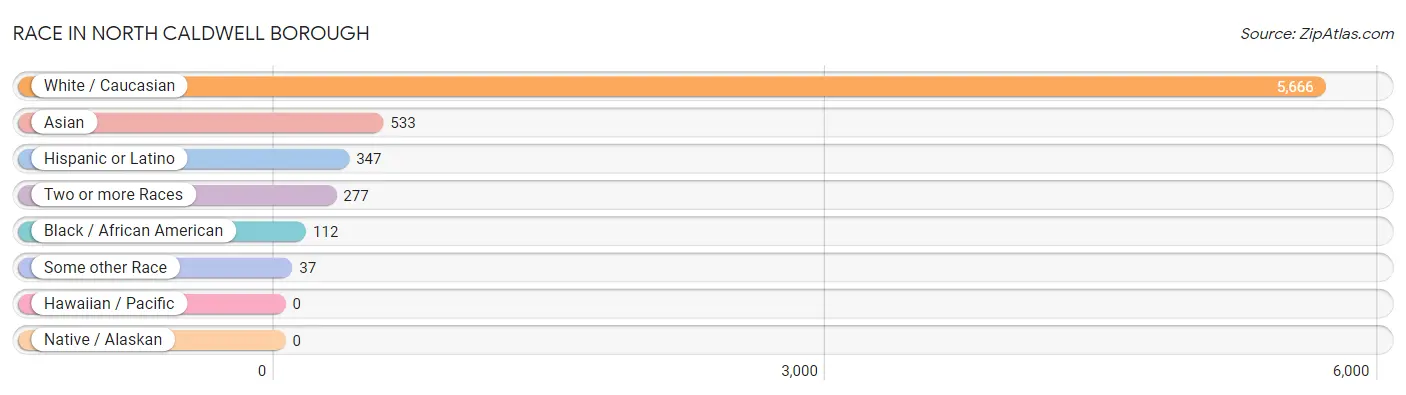
| Race | # Population | % Population |
| Asian | 533 | 8.1% |
| Black / African American | 112 | 1.7% |
| Hawaiian / Pacific | 0 | 0.0% |
| Hispanic or Latino | 347 | 5.2% |
| Native / Alaskan | 0 | 0.0% |
| White / Caucasian | 5,666 | 85.5% |
| Two or more Races | 277 | 4.2% |
| Some other Race | 37 | 0.6% |
| Total | 6,625 | 100.0% |
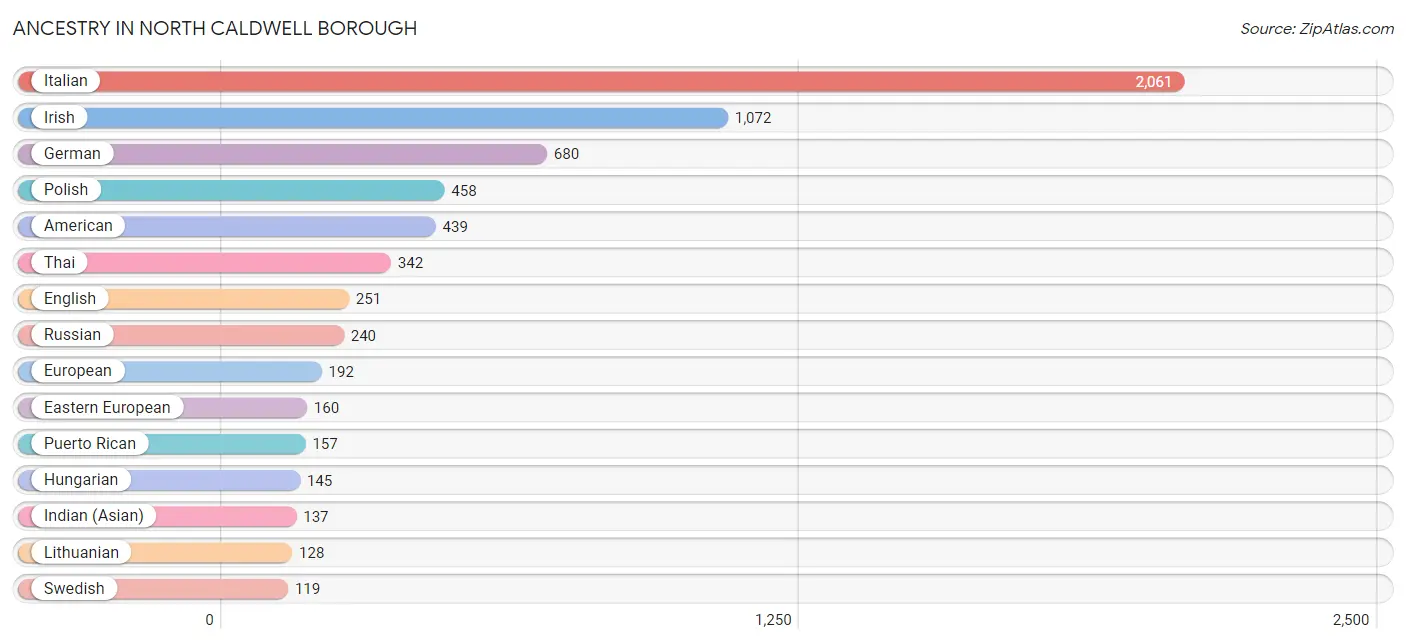
Ancestry in North Caldwell borough
The most populous ancestries reported in North Caldwell borough are Italian (2,061 | 31.1%), Irish (1,072 | 16.2%), German (680 | 10.3%), Polish (458 | 6.9%), and American (439 | 6.6%), together accounting for 71.1% of all North Caldwell borough residents.
| Ancestry | # Population | % Population |
| American | 439 | 6.6% |
| Arab | 80 | 1.2% |
| Armenian | 26 | 0.4% |
| Austrian | 57 | 0.9% |
| British | 13 | 0.2% |
| Burmese | 93 | 1.4% |
| Canadian | 13 | 0.2% |
| Croatian | 19 | 0.3% |
| Dominican | 25 | 0.4% |
| Eastern European | 160 | 2.4% |
| Ecuadorian | 66 | 1.0% |
| English | 251 | 3.8% |
| European | 192 | 2.9% |
| French | 20 | 0.3% |
| French Canadian | 5 | 0.1% |
| German | 680 | 10.3% |
| Greek | 5 | 0.1% |
| Hungarian | 145 | 2.2% |
| Indian (Asian) | 137 | 2.1% |
| Irish | 1,072 | 16.2% |
| Iroquois | 95 | 1.4% |
| Israeli | 23 | 0.4% |
| Italian | 2,061 | 31.1% |
| Korean | 13 | 0.2% |
| Latvian | 90 | 1.4% |
| Lebanese | 80 | 1.2% |
| Lithuanian | 128 | 1.9% |
| Mexican | 15 | 0.2% |
| Northern European | 12 | 0.2% |
| Norwegian | 33 | 0.5% |
| Polish | 458 | 6.9% |
| Puerto Rican | 157 | 2.4% |
| Romanian | 56 | 0.9% |
| Russian | 240 | 3.6% |
| Scandinavian | 32 | 0.5% |
| Scotch-Irish | 20 | 0.3% |
| Scottish | 40 | 0.6% |
| Slovak | 25 | 0.4% |
| South American | 87 | 1.3% |
| Soviet Union | 17 | 0.3% |
| Spaniard | 63 | 0.9% |
| Swedish | 119 | 1.8% |
| Thai | 342 | 5.2% |
| Turkish | 98 | 1.5% |
| Ukrainian | 13 | 0.2% |
| Venezuelan | 21 | 0.3% |
| Welsh | 31 | 0.5% | View All 47 Rows |
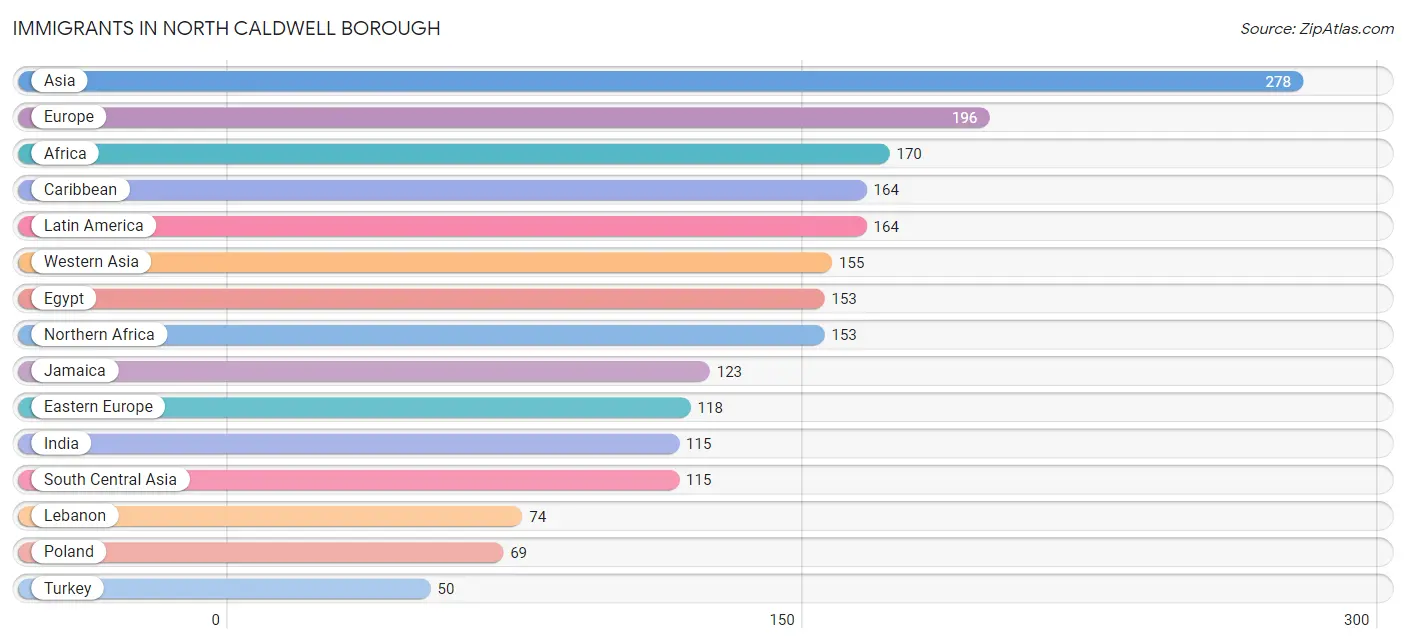
Immigrants in North Caldwell borough
The most numerous immigrant groups reported in North Caldwell borough came from Asia (278 | 4.2%), Europe (196 | 3.0%), Africa (170 | 2.6%), Caribbean (164 | 2.5%), and Latin America (164 | 2.5%), together accounting for 14.7% of all North Caldwell borough residents.
| Immigration Origin | # Population | % Population |
| Africa | 170 | 2.6% |
| Asia | 278 | 4.2% |
| Canada | 13 | 0.2% |
| Caribbean | 164 | 2.5% |
| China | 3 | 0.1% |
| Cuba | 25 | 0.4% |
| Eastern Asia | 3 | 0.1% |
| Eastern Europe | 118 | 1.8% |
| Egypt | 153 | 2.3% |
| Europe | 196 | 3.0% |
| Greece | 5 | 0.1% |
| India | 115 | 1.7% |
| Israel | 11 | 0.2% |
| Italy | 40 | 0.6% |
| Jamaica | 123 | 1.9% |
| Kuwait | 20 | 0.3% |
| Latin America | 164 | 2.5% |
| Lebanon | 74 | 1.1% |
| Moldova | 17 | 0.3% |
| Northern Africa | 153 | 2.3% |
| Northern Europe | 33 | 0.5% |
| Philippines | 5 | 0.1% |
| Poland | 69 | 1.0% |
| Romania | 32 | 0.5% |
| Scotland | 20 | 0.3% |
| South Africa | 17 | 0.3% |
| South Central Asia | 115 | 1.7% |
| South Eastern Asia | 5 | 0.1% |
| Southern Europe | 45 | 0.7% |
| St. Vincent and the Grenadines | 16 | 0.2% |
| Turkey | 50 | 0.7% |
| Western Asia | 155 | 2.3% | View All 32 Rows |
Sex and Age in North Caldwell borough
Sex and Age in North Caldwell borough
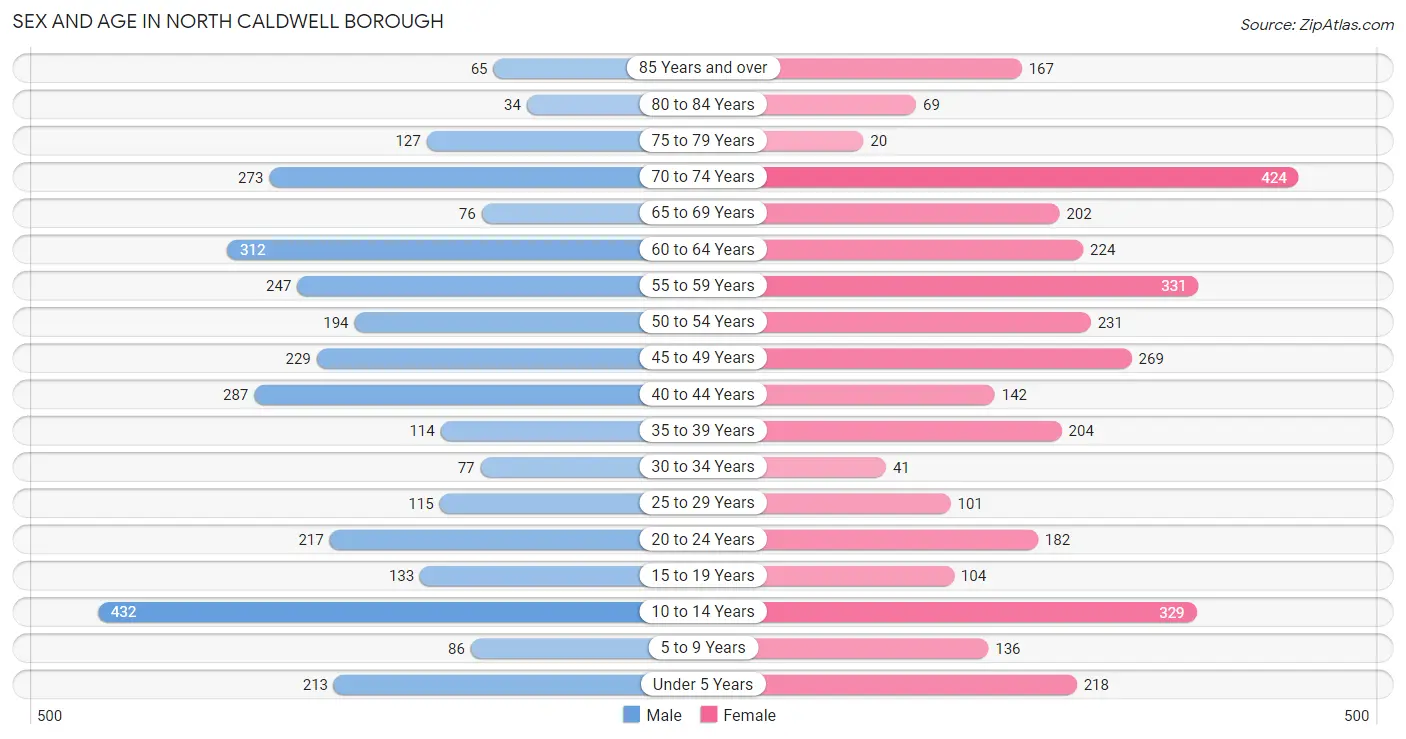
The most populous age groups in North Caldwell borough are 10 to 14 Years (432 | 13.4%) for men and 70 to 74 Years (424 | 12.5%) for women.
| Age Bracket | Male | Female |
| Under 5 Years | 213 (6.6%) | 218 (6.4%) |
| 5 to 9 Years | 86 (2.7%) | 136 (4.0%) |
| 10 to 14 Years | 432 (13.4%) | 329 (9.7%) |
| 15 to 19 Years | 133 (4.1%) | 104 (3.1%) |
| 20 to 24 Years | 217 (6.7%) | 182 (5.4%) |
| 25 to 29 Years | 115 (3.6%) | 101 (3.0%) |
| 30 to 34 Years | 77 (2.4%) | 41 (1.2%) |
| 35 to 39 Years | 114 (3.5%) | 204 (6.0%) |
| 40 to 44 Years | 287 (8.9%) | 142 (4.2%) |
| 45 to 49 Years | 229 (7.1%) | 269 (7.9%) |
| 50 to 54 Years | 194 (6.0%) | 231 (6.8%) |
| 55 to 59 Years | 247 (7.6%) | 331 (9.8%) |
| 60 to 64 Years | 312 (9.7%) | 224 (6.6%) |
| 65 to 69 Years | 76 (2.4%) | 202 (5.9%) |
| 70 to 74 Years | 273 (8.5%) | 424 (12.5%) |
| 75 to 79 Years | 127 (3.9%) | 20 (0.6%) |
| 80 to 84 Years | 34 (1.1%) | 69 (2.0%) |
| 85 Years and over | 65 (2.0%) | 167 (4.9%) |
| Total | 3,231 (100.0%) | 3,394 (100.0%) |
Families and Households in North Caldwell borough
Median Family Size in North Caldwell borough
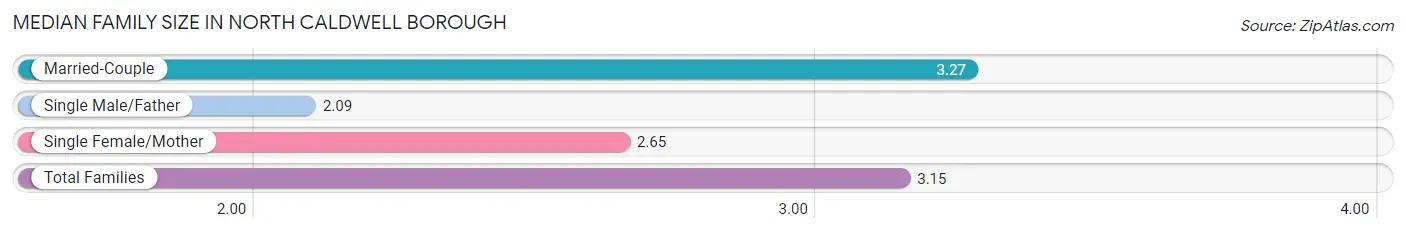
The median family size in North Caldwell borough is 3.15 persons per family, with married-couple families (1,697 | 83.9%) accounting for the largest median family size of 3.27 persons per family. On the other hand, single male/father families (80 | 4.0%) represent the smallest median family size with 2.09 persons per family.
| Family Type | # Families | Family Size |
| Married-Couple | 1,697 (83.9%) | 3.27 |
| Single Male/Father | 80 (4.0%) | 2.09 |
| Single Female/Mother | 245 (12.1%) | 2.65 |
| Total Families | 2,022 (100.0%) | 3.15 |
Median Household Size in North Caldwell borough
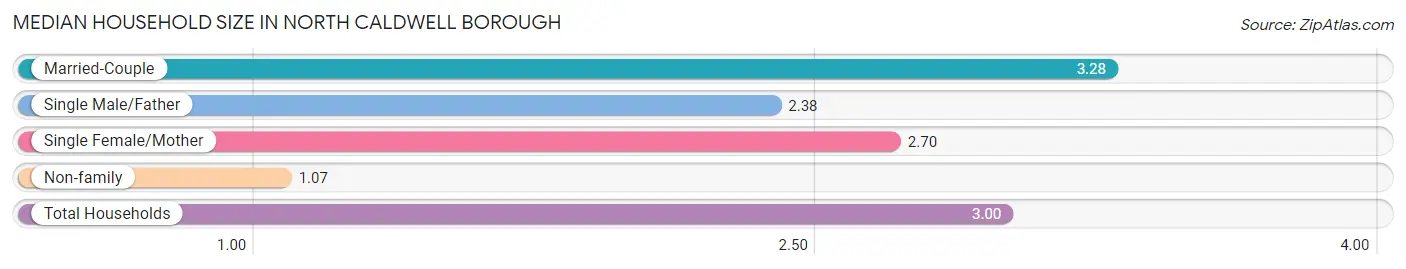
The median household size in North Caldwell borough is 3.00 persons per household, with married-couple households (1,697 | 76.9%) accounting for the largest median household size of 3.28 persons per household. non-family households (186 | 8.4%) represent the smallest median household size with 1.07 persons per household.
| Household Type | # Households | Household Size |
| Married-Couple | 1,697 (76.9%) | 3.28 |
| Single Male/Father | 80 (3.6%) | 2.38 |
| Single Female/Mother | 245 (11.1%) | 2.70 |
| Non-family | 186 (8.4%) | 1.07 |
| Total Households | 2,208 (100.0%) | 3.00 |
Household Size by Marriage Status in North Caldwell borough
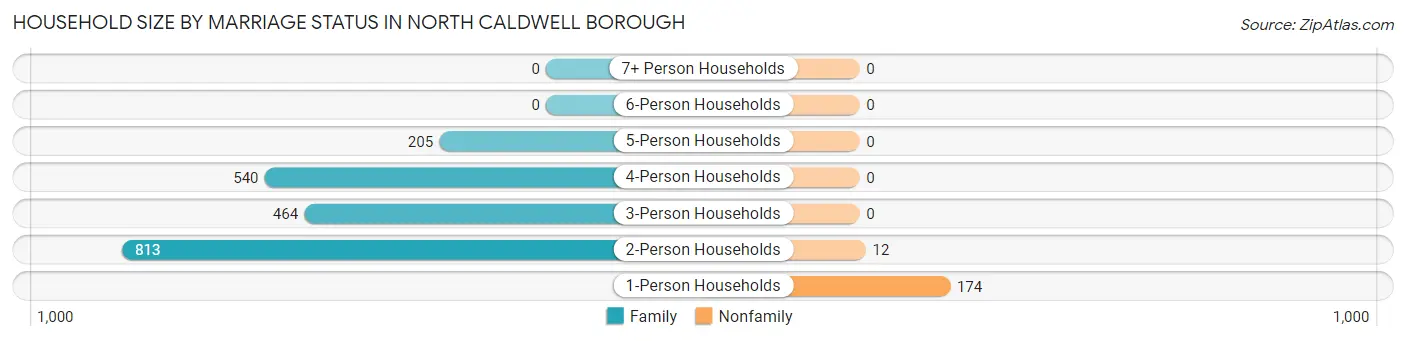
Out of a total of 2,208 households in North Caldwell borough, 2,022 (91.6%) are family households, while 186 (8.4%) are nonfamily households. The most numerous type of family households are 2-person households, comprising 813, and the most common type of nonfamily households are 1-person households, comprising 174.
| Household Size | Family Households | Nonfamily Households |
| 1-Person Households | - | 174 (7.9%) |
| 2-Person Households | 813 (36.8%) | 12 (0.5%) |
| 3-Person Households | 464 (21.0%) | 0 (0.0%) |
| 4-Person Households | 540 (24.5%) | 0 (0.0%) |
| 5-Person Households | 205 (9.3%) | 0 (0.0%) |
| 6-Person Households | 0 (0.0%) | 0 (0.0%) |
| 7+ Person Households | 0 (0.0%) | 0 (0.0%) |
| Total | 2,022 (91.6%) | 186 (8.4%) |
Female Fertility in North Caldwell borough
Fertility by Age in North Caldwell borough
Average fertility rate in North Caldwell borough is 52.0 births per 1,000 women. Women in the age bracket of 20 to 34 years have the highest fertility rate with 74.0 births per 1,000 women. Women in the age bracket of 35 to 50 years acount for 57.1% of all women with births.
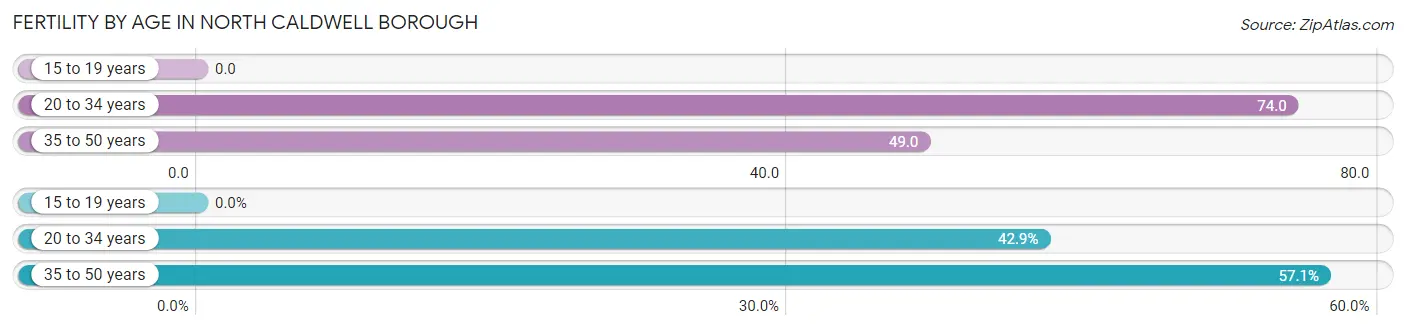
| Age Bracket | Women with Births | Births / 1,000 Women |
| 15 to 19 years | 0 (0.0%) | 0.0 |
| 20 to 34 years | 24 (42.9%) | 74.0 |
| 35 to 50 years | 32 (57.1%) | 49.0 |
| Total | 56 (100.0%) | 52.0 |
Fertility by Age by Marriage Status in North Caldwell borough
73.2% of women with births (56) in North Caldwell borough are married. The highest percentage of unmarried women with births falls into 20 to 34 years age bracket with 62.5% of them unmarried at the time of birth, while the lowest percentage of unmarried women with births belong to 35 to 50 years age bracket with 0.0% of them unmarried.
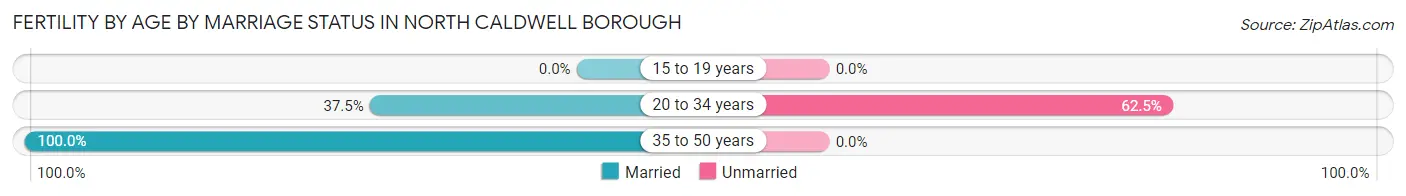
| Age Bracket | Married | Unmarried |
| 15 to 19 years | 0 (0.0%) | 0 (0.0%) |
| 20 to 34 years | 9 (37.5%) | 15 (62.5%) |
| 35 to 50 years | 32 (100.0%) | 0 (0.0%) |
| Total | 41 (73.2%) | 15 (26.8%) |
Fertility by Education in North Caldwell borough
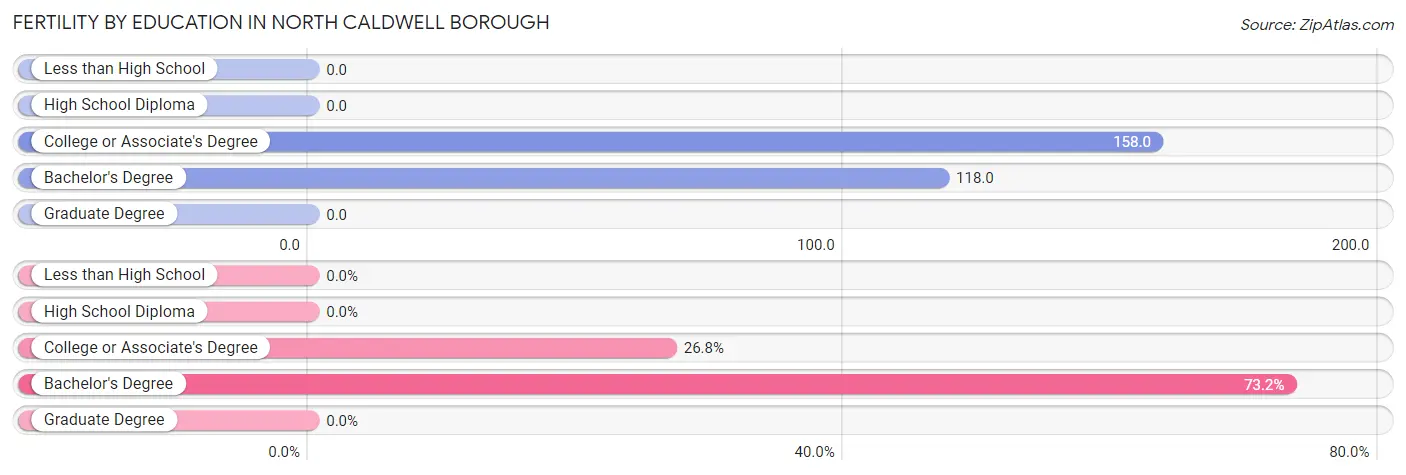
| Educational Attainment | Women with Births | Births / 1,000 Women |
| Less than High School | 0 (0.0%) | 0.0 |
| High School Diploma | 0 (0.0%) | 0.0 |
| College or Associate's Degree | 15 (26.8%) | 158.0 |
| Bachelor's Degree | 41 (73.2%) | 118.0 |
| Graduate Degree | 0 (0.0%) | 0.0 |
| Total | 56 (100.0%) | 52.0 |
Fertility by Education by Marriage Status in North Caldwell borough
26.8% of women with births in North Caldwell borough are unmarried. Women with the educational attainment of bachelor's degree are most likely to be married with 100.0% of them married at childbirth, while women with the educational attainment of college or associate's degree are least likely to be married with 100.0% of them unmarried at childbirth.
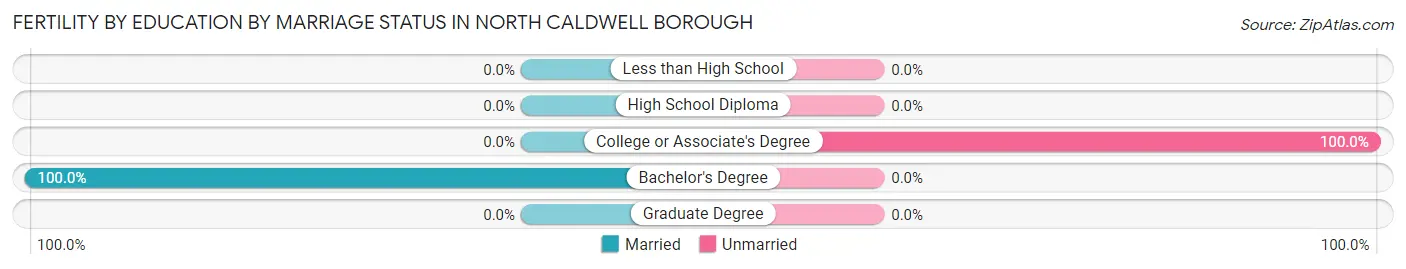
| Educational Attainment | Married | Unmarried |
| Less than High School | 0 (0.0%) | 0 (0.0%) |
| High School Diploma | 0 (0.0%) | 0 (0.0%) |
| College or Associate's Degree | 0 (0.0%) | 15 (100.0%) |
| Bachelor's Degree | 41 (100.0%) | 0 (0.0%) |
| Graduate Degree | 0 (0.0%) | 0 (0.0%) |
| Total | 41 (73.2%) | 15 (26.8%) |
Employment Characteristics in North Caldwell borough
Employment by Class of Employer in North Caldwell borough
Among the 3,247 employed individuals in North Caldwell borough, private company employees (1,676 | 51.6%), local government employees (450 | 13.9%), and self-employed (not incorporated) (414 | 12.8%) make up the most common classes of employment.
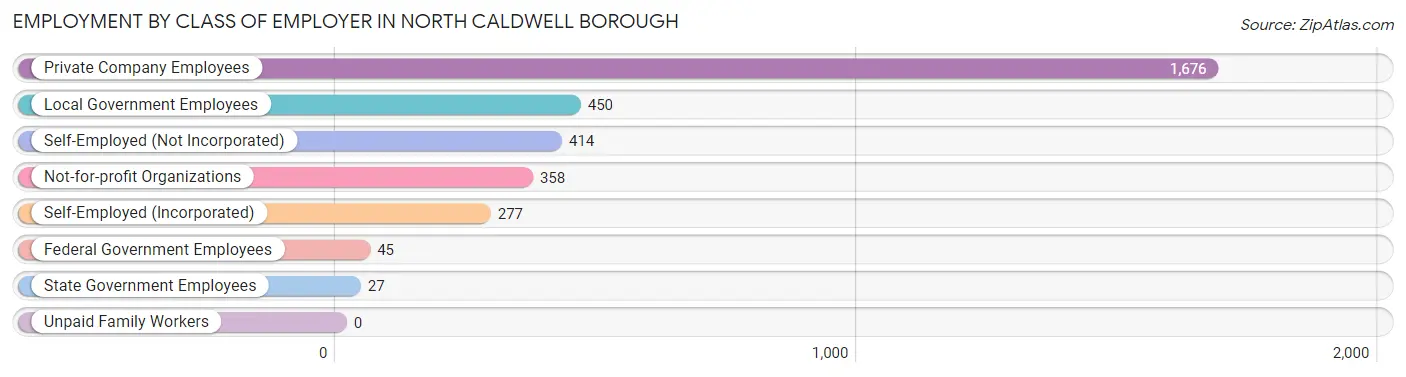
| Employer Class | # Employees | % Employees |
| Private Company Employees | 1,676 | 51.6% |
| Self-Employed (Incorporated) | 277 | 8.5% |
| Self-Employed (Not Incorporated) | 414 | 12.8% |
| Not-for-profit Organizations | 358 | 11.0% |
| Local Government Employees | 450 | 13.9% |
| State Government Employees | 27 | 0.8% |
| Federal Government Employees | 45 | 1.4% |
| Unpaid Family Workers | 0 | 0.0% |
| Total | 3,247 | 100.0% |
Employment Status by Age in North Caldwell borough
According to the labor force statistics for North Caldwell borough, out of the total population over 16 years of age (5,130), 67.7% or 3,473 individuals are in the labor force, with 5.8% or 201 of them unemployed. The age group with the highest labor force participation rate is 25 to 29 years, with 100.0% or 216 individuals in the labor force. Within the labor force, the 60 to 64 years age range has the highest percentage of unemployed individuals, with 19.3% or 94 of them being unemployed.
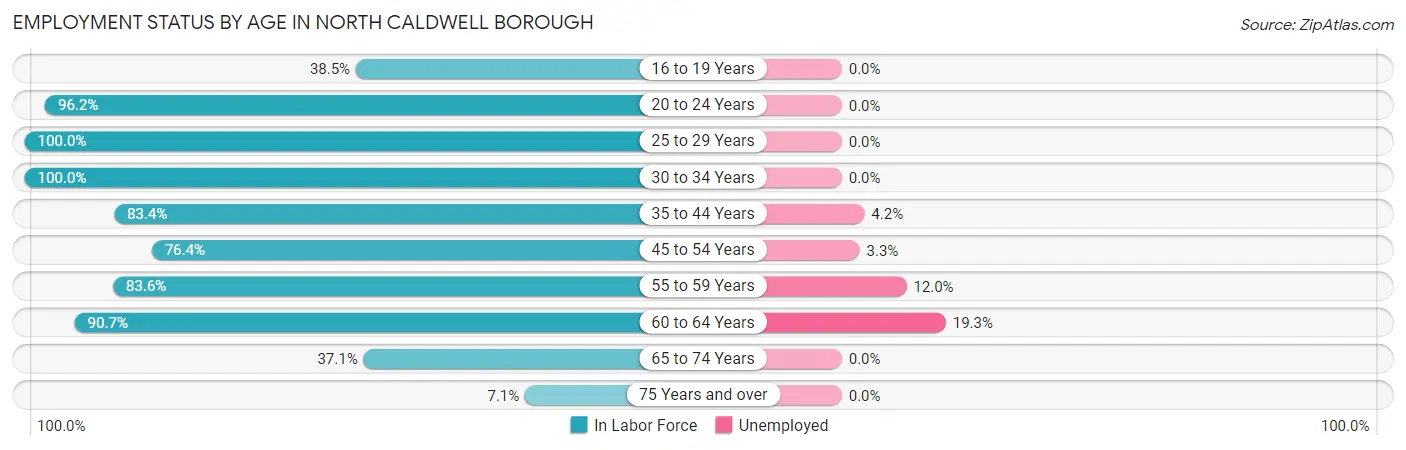
| Age Bracket | In Labor Force | Unemployed |
| 16 to 19 Years | 60 (38.5%) | 0 (0.0%) |
| 20 to 24 Years | 384 (96.2%) | 0 (0.0%) |
| 25 to 29 Years | 216 (100.0%) | 0 (0.0%) |
| 30 to 34 Years | 118 (100.0%) | 0 (0.0%) |
| 35 to 44 Years | 623 (83.4%) | 26 (4.2%) |
| 45 to 54 Years | 705 (76.4%) | 23 (3.3%) |
| 55 to 59 Years | 483 (83.6%) | 58 (12.0%) |
| 60 to 64 Years | 486 (90.7%) | 94 (19.3%) |
| 65 to 74 Years | 362 (37.1%) | 0 (0.0%) |
| 75 Years and over | 34 (7.1%) | 0 (0.0%) |
| Total | 3,473 (67.7%) | 201 (5.8%) |
Employment Status by Educational Attainment in North Caldwell borough
According to labor force statistics for North Caldwell borough, 84.4% of individuals (2,632) out of the total population between 25 and 64 years of age (3,118) are in the labor force, with 7.6% or 200 of them being unemployed. The group with the highest labor force participation rate are those with the educational attainment of less than high school, with 100.0% or 48 individuals in the labor force. Within the labor force, individuals with bachelor's degree or higher education have the highest percentage of unemployment, with 8.6% or 189 of them being unemployed.
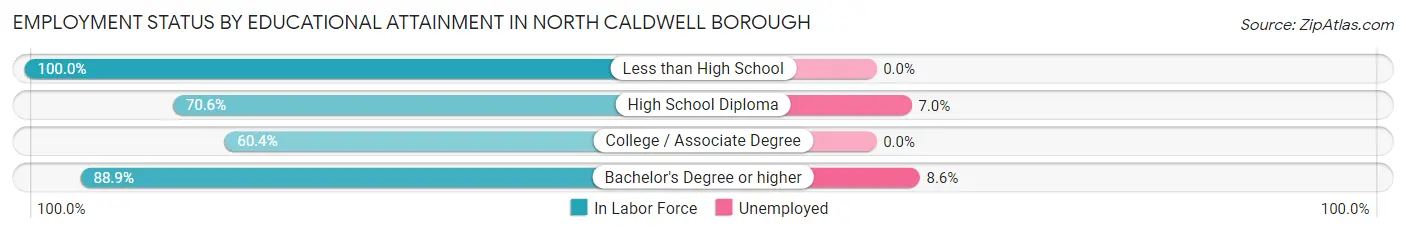
| Educational Attainment | In Labor Force | Unemployed |
| Less than High School | 48 (100.0%) | 0 (0.0%) |
| High School Diploma | 185 (70.6%) | 18 (7.0%) |
| College / Associate Degree | 206 (60.4%) | 0 (0.0%) |
| Bachelor's Degree or higher | 2,193 (88.9%) | 212 (8.6%) |
| Total | 2,632 (84.4%) | 237 (7.6%) |
Employment Occupations by Sex in North Caldwell borough
Management, Business, Science and Arts Occupations
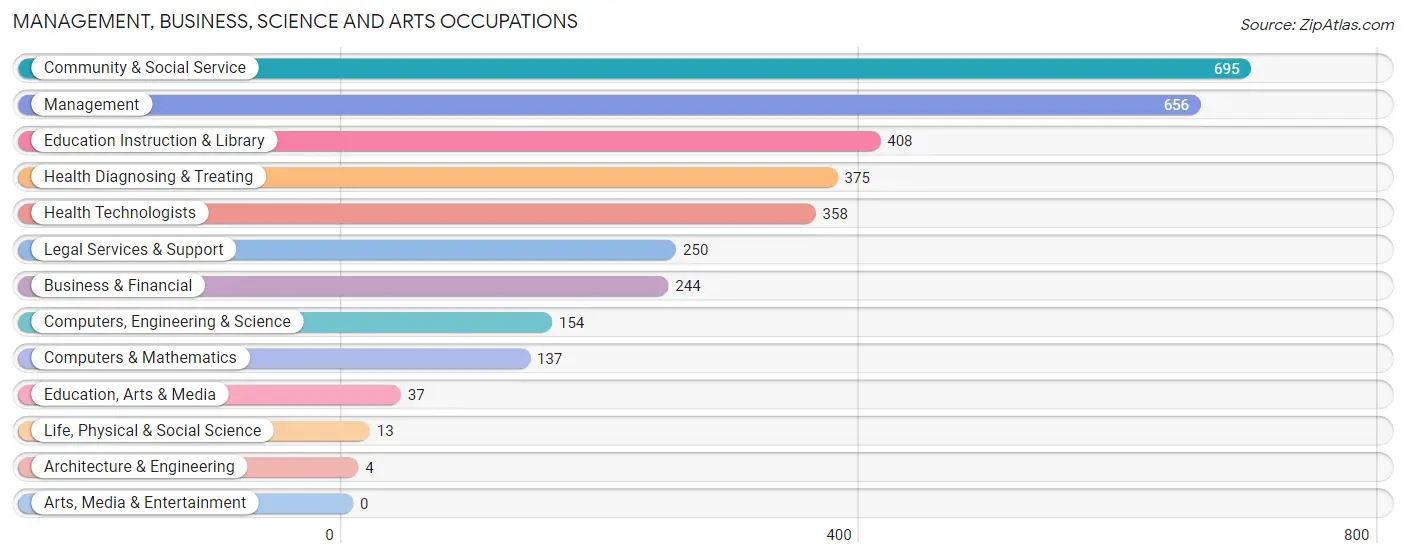
The most common Management, Business, Science and Arts occupations in North Caldwell borough are Community & Social Service (695 | 21.2%), Management (656 | 20.1%), Education Instruction & Library (408 | 12.5%), Health Diagnosing & Treating (375 | 11.5%), and Health Technologists (358 | 11.0%).
Management, Business, Science and Arts Occupations by Sex
Within the Management, Business, Science and Arts occupations in North Caldwell borough, the most male-oriented occupations are Architecture & Engineering (100.0%), Computers & Mathematics (73.0%), and Legal Services & Support (67.6%), while the most female-oriented occupations are Life, Physical & Social Science (100.0%), Education Instruction & Library (86.8%), and Community & Social Service (65.2%).
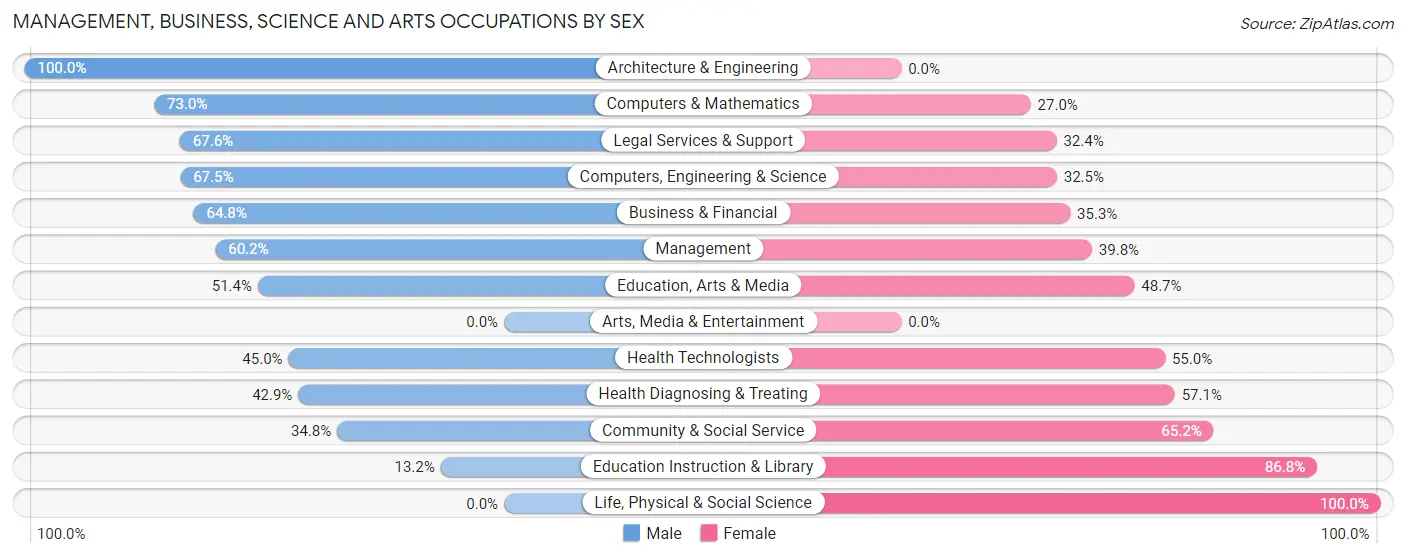
| Occupation | Male | Female |
| Management | 395 (60.2%) | 261 (39.8%) |
| Business & Financial | 158 (64.7%) | 86 (35.2%) |
| Computers, Engineering & Science | 104 (67.5%) | 50 (32.5%) |
| Computers & Mathematics | 100 (73.0%) | 37 (27.0%) |
| Architecture & Engineering | 4 (100.0%) | 0 (0.0%) |
| Life, Physical & Social Science | 0 (0.0%) | 13 (100.0%) |
| Community & Social Service | 242 (34.8%) | 453 (65.2%) |
| Education, Arts & Media | 19 (51.3%) | 18 (48.6%) |
| Legal Services & Support | 169 (67.6%) | 81 (32.4%) |
| Education Instruction & Library | 54 (13.2%) | 354 (86.8%) |
| Arts, Media & Entertainment | 0 (0.0%) | 0 (0.0%) |
| Health Diagnosing & Treating | 161 (42.9%) | 214 (57.1%) |
| Health Technologists | 161 (45.0%) | 197 (55.0%) |
| Total (Category) | 1,060 (49.9%) | 1,064 (50.1%) |
| Total (Overall) | 1,733 (53.0%) | 1,537 (47.0%) |
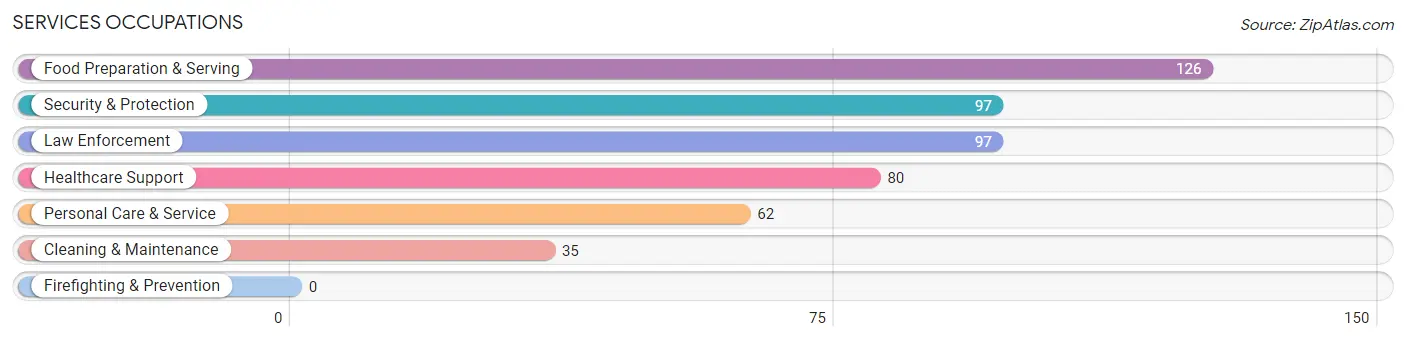
Services Occupations
The most common Services occupations in North Caldwell borough are Food Preparation & Serving (126 | 3.8%), Security & Protection (97 | 3.0%), Law Enforcement (97 | 3.0%), Healthcare Support (80 | 2.5%), and Personal Care & Service (62 | 1.9%).
Services Occupations by Sex
Within the Services occupations in North Caldwell borough, the most male-oriented occupations are Security & Protection (100.0%), Law Enforcement (100.0%), and Cleaning & Maintenance (100.0%), while the most female-oriented occupations are Personal Care & Service (100.0%), Healthcare Support (71.3%), and Food Preparation & Serving (53.2%).
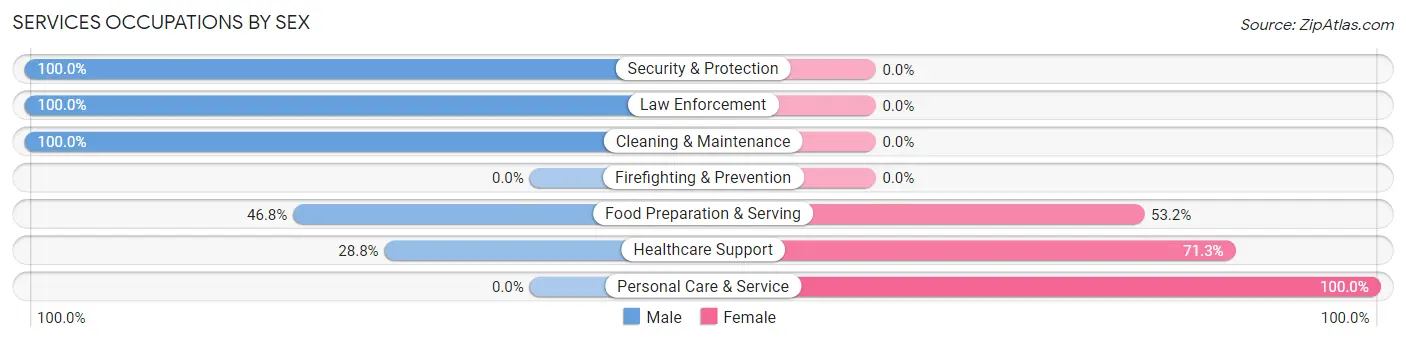
| Occupation | Male | Female |
| Healthcare Support | 23 (28.7%) | 57 (71.3%) |
| Security & Protection | 97 (100.0%) | 0 (0.0%) |
| Firefighting & Prevention | 0 (0.0%) | 0 (0.0%) |
| Law Enforcement | 97 (100.0%) | 0 (0.0%) |
| Food Preparation & Serving | 59 (46.8%) | 67 (53.2%) |
| Cleaning & Maintenance | 35 (100.0%) | 0 (0.0%) |
| Personal Care & Service | 0 (0.0%) | 62 (100.0%) |
| Total (Category) | 214 (53.5%) | 186 (46.5%) |
| Total (Overall) | 1,733 (53.0%) | 1,537 (47.0%) |
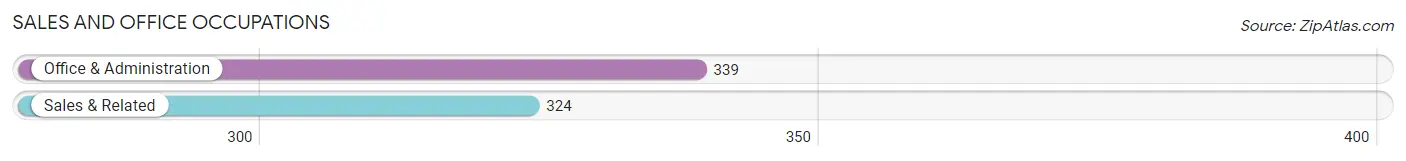
Sales and Office Occupations
The most common Sales and Office occupations in North Caldwell borough are Office & Administration (339 | 10.4%), and Sales & Related (324 | 9.9%).
Sales and Office Occupations by Sex
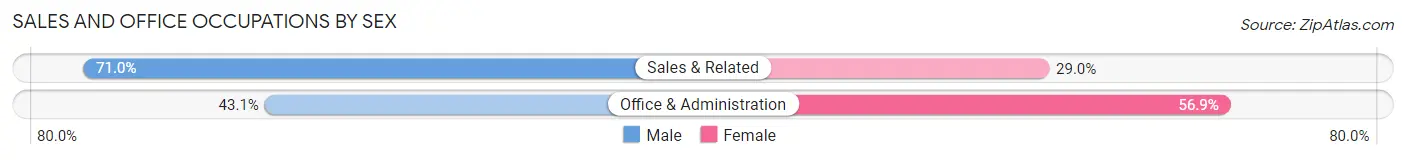
| Occupation | Male | Female |
| Sales & Related | 230 (71.0%) | 94 (29.0%) |
| Office & Administration | 146 (43.1%) | 193 (56.9%) |
| Total (Category) | 376 (56.7%) | 287 (43.3%) |
| Total (Overall) | 1,733 (53.0%) | 1,537 (47.0%) |
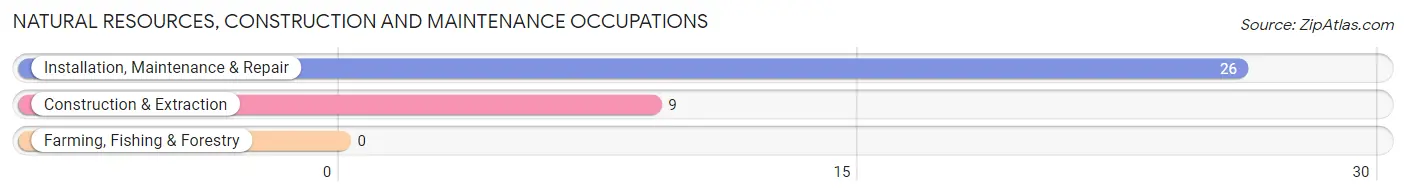
Natural Resources, Construction and Maintenance Occupations
The most common Natural Resources, Construction and Maintenance occupations in North Caldwell borough are Installation, Maintenance & Repair (26 | 0.8%), and Construction & Extraction (9 | 0.3%).
Natural Resources, Construction and Maintenance Occupations by Sex
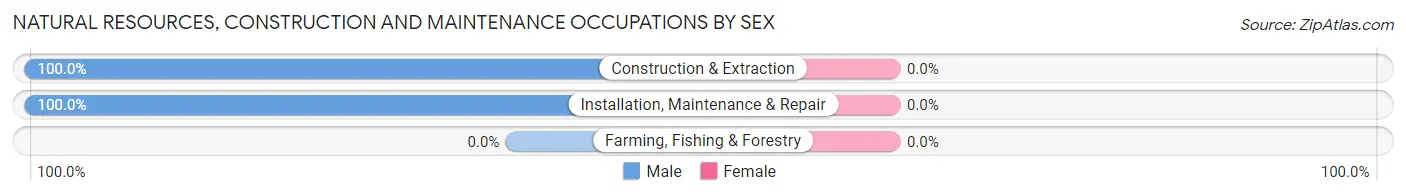
| Occupation | Male | Female |
| Farming, Fishing & Forestry | 0 (0.0%) | 0 (0.0%) |
| Construction & Extraction | 9 (100.0%) | 0 (0.0%) |
| Installation, Maintenance & Repair | 26 (100.0%) | 0 (0.0%) |
| Total (Category) | 35 (100.0%) | 0 (0.0%) |
| Total (Overall) | 1,733 (53.0%) | 1,537 (47.0%) |
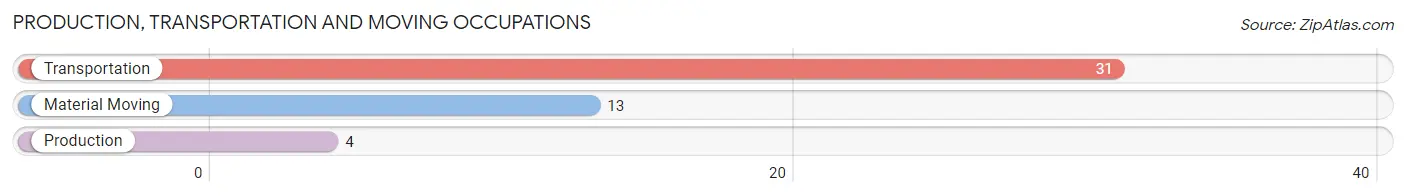
Production, Transportation and Moving Occupations
The most common Production, Transportation and Moving occupations in North Caldwell borough are Transportation (31 | 0.9%), Material Moving (13 | 0.4%), and Production (4 | 0.1%).
Production, Transportation and Moving Occupations by Sex
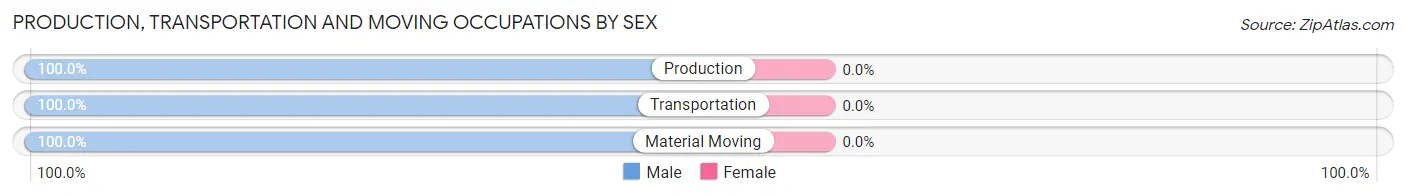
| Occupation | Male | Female |
| Production | 4 (100.0%) | 0 (0.0%) |
| Transportation | 31 (100.0%) | 0 (0.0%) |
| Material Moving | 13 (100.0%) | 0 (0.0%) |
| Total (Category) | 48 (100.0%) | 0 (0.0%) |
| Total (Overall) | 1,733 (53.0%) | 1,537 (47.0%) |
Employment Industries by Sex in North Caldwell borough
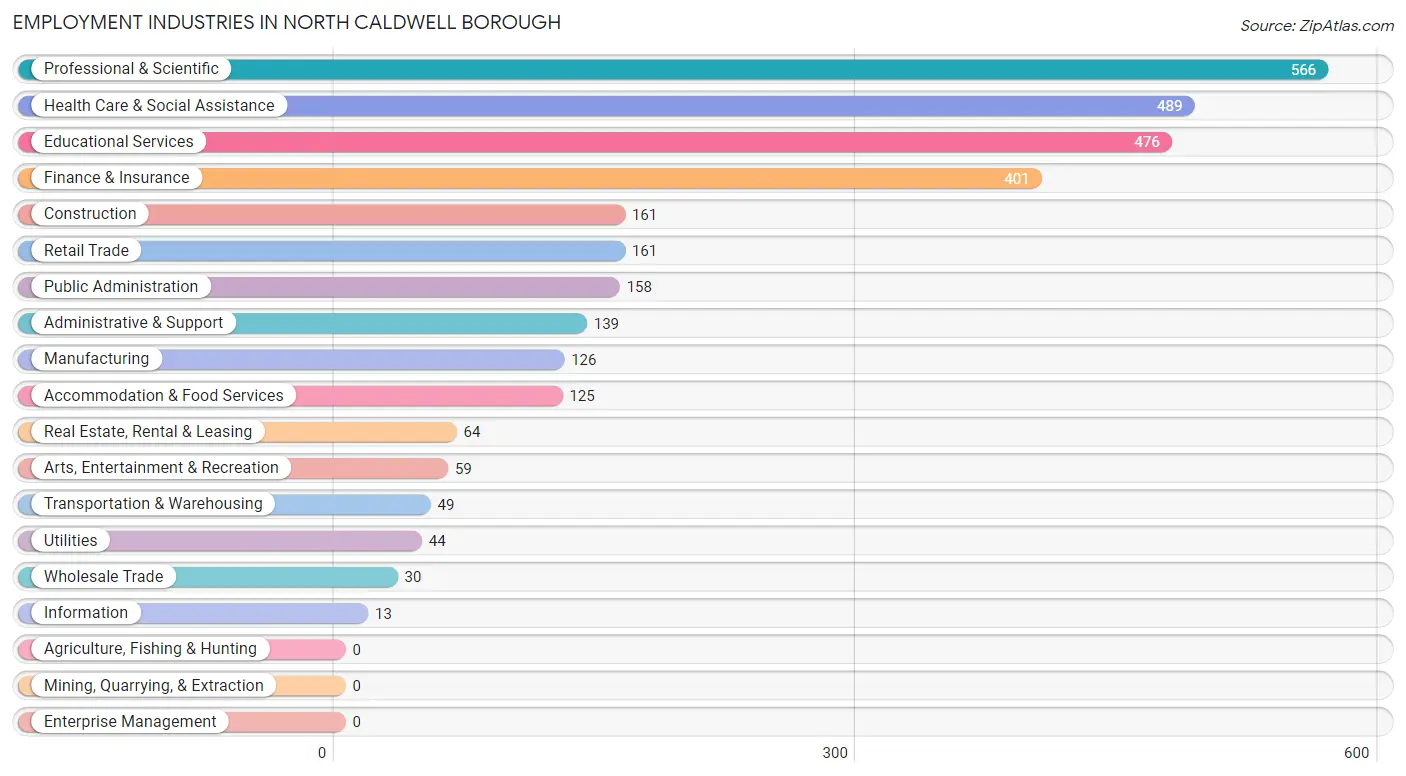
Employment Industries in North Caldwell borough
The major employment industries in North Caldwell borough include Professional & Scientific (566 | 17.3%), Health Care & Social Assistance (489 | 14.9%), Educational Services (476 | 14.6%), Finance & Insurance (401 | 12.3%), and Construction (161 | 4.9%).
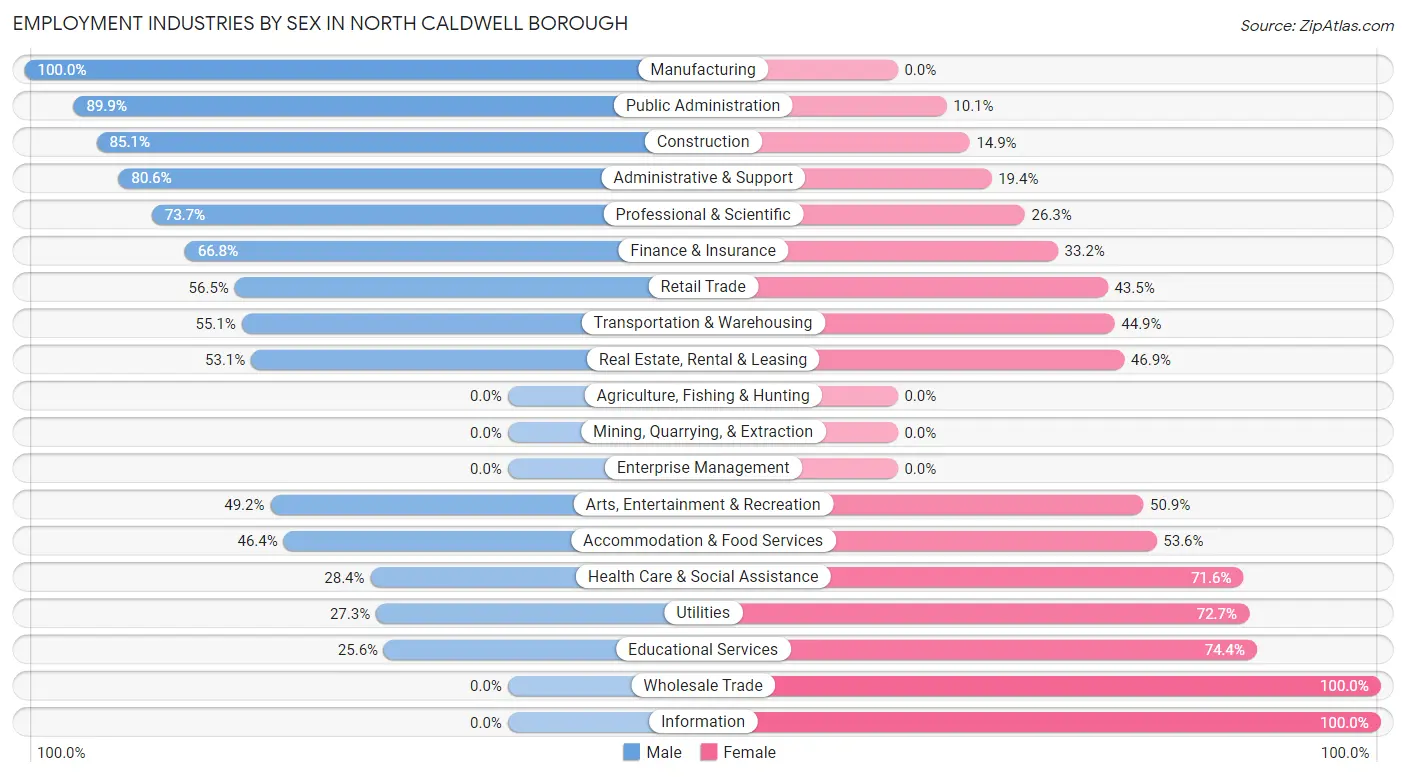
Employment Industries by Sex in North Caldwell borough
The North Caldwell borough industries that see more men than women are Manufacturing (100.0%), Public Administration (89.9%), and Construction (85.1%), whereas the industries that tend to have a higher number of women are Wholesale Trade (100.0%), Information (100.0%), and Educational Services (74.4%).
| Industry | Male | Female |
| Agriculture, Fishing & Hunting | 0 (0.0%) | 0 (0.0%) |
| Mining, Quarrying, & Extraction | 0 (0.0%) | 0 (0.0%) |
| Construction | 137 (85.1%) | 24 (14.9%) |
| Manufacturing | 126 (100.0%) | 0 (0.0%) |
| Wholesale Trade | 0 (0.0%) | 30 (100.0%) |
| Retail Trade | 91 (56.5%) | 70 (43.5%) |
| Transportation & Warehousing | 27 (55.1%) | 22 (44.9%) |
| Utilities | 12 (27.3%) | 32 (72.7%) |
| Information | 0 (0.0%) | 13 (100.0%) |
| Finance & Insurance | 268 (66.8%) | 133 (33.2%) |
| Real Estate, Rental & Leasing | 34 (53.1%) | 30 (46.9%) |
| Professional & Scientific | 417 (73.7%) | 149 (26.3%) |
| Enterprise Management | 0 (0.0%) | 0 (0.0%) |
| Administrative & Support | 112 (80.6%) | 27 (19.4%) |
| Educational Services | 122 (25.6%) | 354 (74.4%) |
| Health Care & Social Assistance | 139 (28.4%) | 350 (71.6%) |
| Arts, Entertainment & Recreation | 29 (49.1%) | 30 (50.8%) |
| Accommodation & Food Services | 58 (46.4%) | 67 (53.6%) |
| Public Administration | 142 (89.9%) | 16 (10.1%) |
| Total | 1,733 (53.0%) | 1,537 (47.0%) |
Education in North Caldwell borough
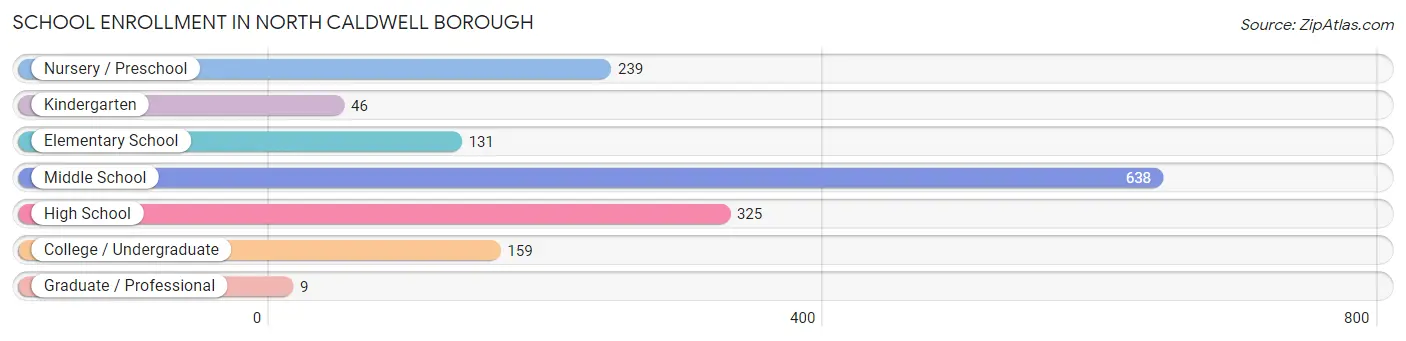
School Enrollment in North Caldwell borough
The most common levels of schooling among the 1,547 students in North Caldwell borough are middle school (638 | 41.2%), high school (325 | 21.0%), and nursery / preschool (239 | 15.4%).
| School Level | # Students | % Students |
| Nursery / Preschool | 239 | 15.4% |
| Kindergarten | 46 | 3.0% |
| Elementary School | 131 | 8.5% |
| Middle School | 638 | 41.2% |
| High School | 325 | 21.0% |
| College / Undergraduate | 159 | 10.3% |
| Graduate / Professional | 9 | 0.6% |
| Total | 1,547 | 100.0% |
School Enrollment by Age by Funding Source in North Caldwell borough
Out of a total of 1,547 students who are enrolled in schools in North Caldwell borough, 265 (17.1%) attend a private institution, while the remaining 1,282 (82.9%) are enrolled in public schools. The age group of 25 to 34 year olds has the highest likelihood of being enrolled in private schools, with 9 (100.0% in the age bracket) enrolled. Conversely, the age group of 15 to 17 year olds has the lowest likelihood of being enrolled in a private school, with 191 (100.0% in the age bracket) attending a public institution.
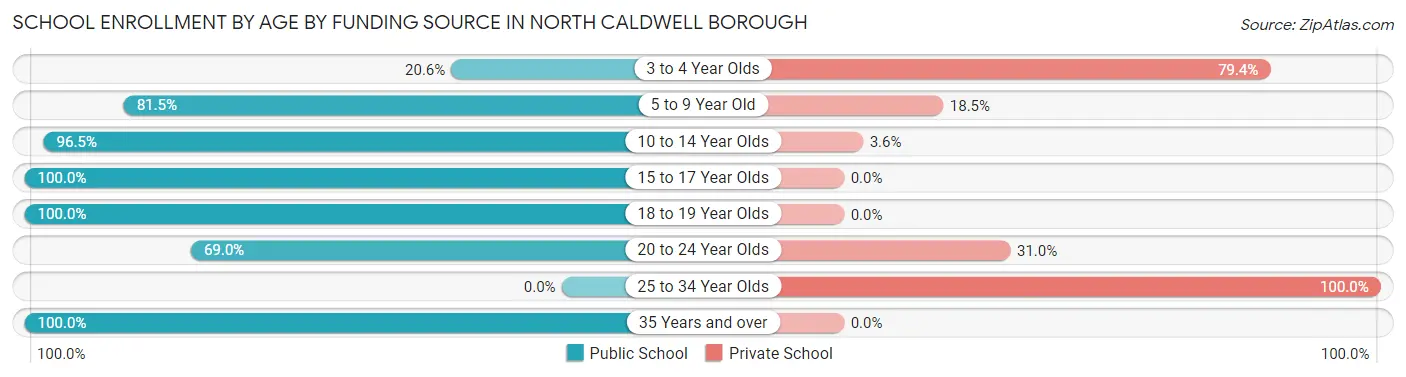
| Age Bracket | Public School | Private School |
| 3 to 4 Year Olds | 37 (20.6%) | 143 (79.4%) |
| 5 to 9 Year Old | 181 (81.5%) | 41 (18.5%) |
| 10 to 14 Year Olds | 734 (96.5%) | 27 (3.5%) |
| 15 to 17 Year Olds | 191 (100.0%) | 0 (0.0%) |
| 18 to 19 Year Olds | 25 (100.0%) | 0 (0.0%) |
| 20 to 24 Year Olds | 98 (69.0%) | 44 (31.0%) |
| 25 to 34 Year Olds | 0 (0.0%) | 9 (100.0%) |
| 35 Years and over | 17 (100.0%) | 0 (0.0%) |
| Total | 1,282 (82.9%) | 265 (17.1%) |
Educational Attainment by Field of Study in North Caldwell borough
Business (924 | 23.5%), education (534 | 13.6%), social sciences (529 | 13.5%), literature & languages (430 | 11.0%), and science & technology (383 | 9.8%) are the most common fields of study among 3,923 individuals in North Caldwell borough who have obtained a bachelor's degree or higher.
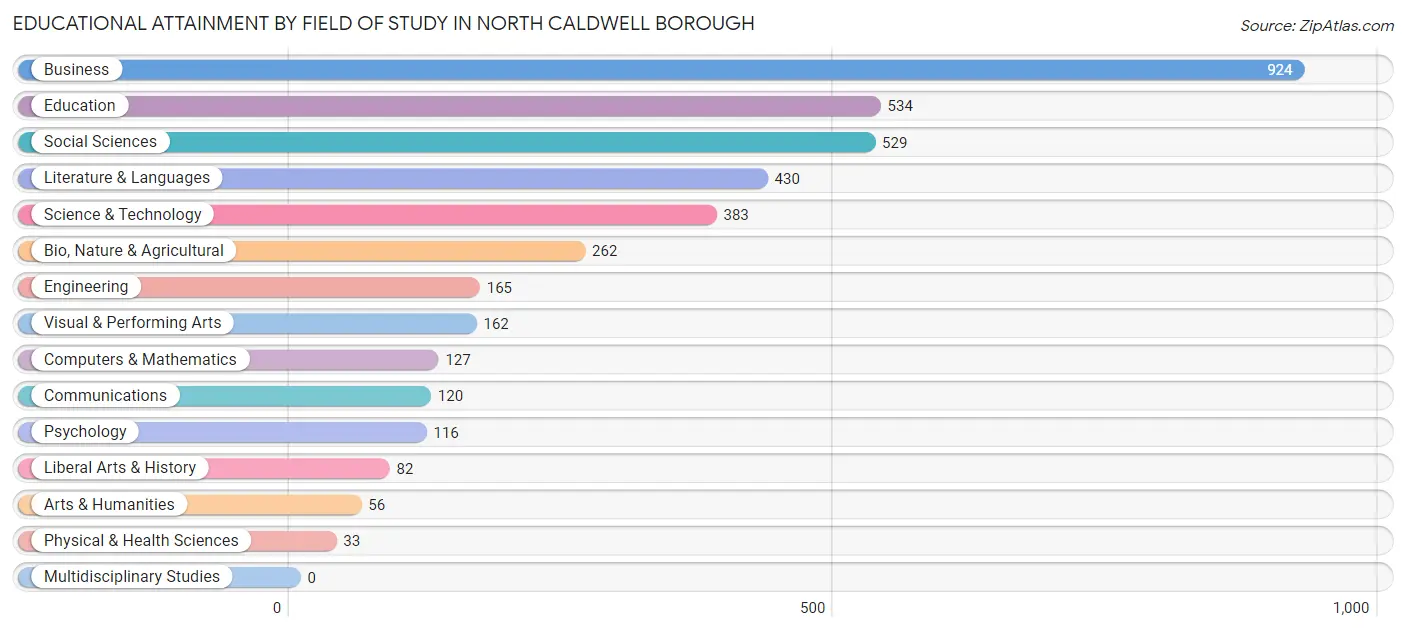
| Field of Study | # Graduates | % Graduates |
| Computers & Mathematics | 127 | 3.2% |
| Bio, Nature & Agricultural | 262 | 6.7% |
| Physical & Health Sciences | 33 | 0.8% |
| Psychology | 116 | 3.0% |
| Social Sciences | 529 | 13.5% |
| Engineering | 165 | 4.2% |
| Multidisciplinary Studies | 0 | 0.0% |
| Science & Technology | 383 | 9.8% |
| Business | 924 | 23.5% |
| Education | 534 | 13.6% |
| Literature & Languages | 430 | 11.0% |
| Liberal Arts & History | 82 | 2.1% |
| Visual & Performing Arts | 162 | 4.1% |
| Communications | 120 | 3.1% |
| Arts & Humanities | 56 | 1.4% |
| Total | 3,923 | 100.0% |
Transportation & Commute in North Caldwell borough
Vehicle Availability by Sex in North Caldwell borough
The most prevalent vehicle ownership categories in North Caldwell borough are males with 2 vehicles (988, accounting for 57.0%) and females with 2 vehicles (922, making up 65.3%).
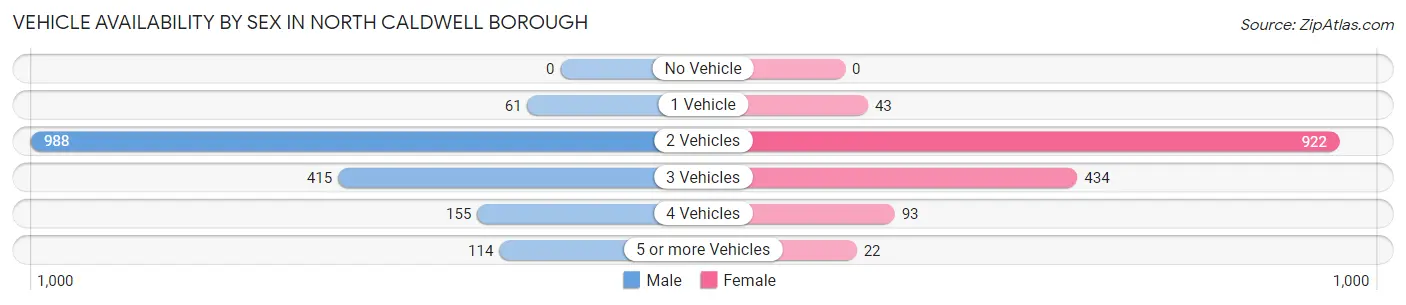
| Vehicles Available | Male | Female |
| No Vehicle | 0 (0.0%) | 0 (0.0%) |
| 1 Vehicle | 61 (3.5%) | 43 (2.8%) |
| 2 Vehicles | 988 (57.0%) | 922 (60.9%) |
| 3 Vehicles | 415 (23.9%) | 434 (28.7%) |
| 4 Vehicles | 155 (8.9%) | 93 (6.1%) |
| 5 or more Vehicles | 114 (6.6%) | 22 (1.5%) |
| Total | 1,733 (100.0%) | 1,514 (100.0%) |
Commute Time in North Caldwell borough
The most frequently occuring commute durations in North Caldwell borough are 30 to 34 minutes (523 commuters, 22.1%), 10 to 14 minutes (363 commuters, 15.3%), and 5 to 9 minutes (306 commuters, 12.9%).
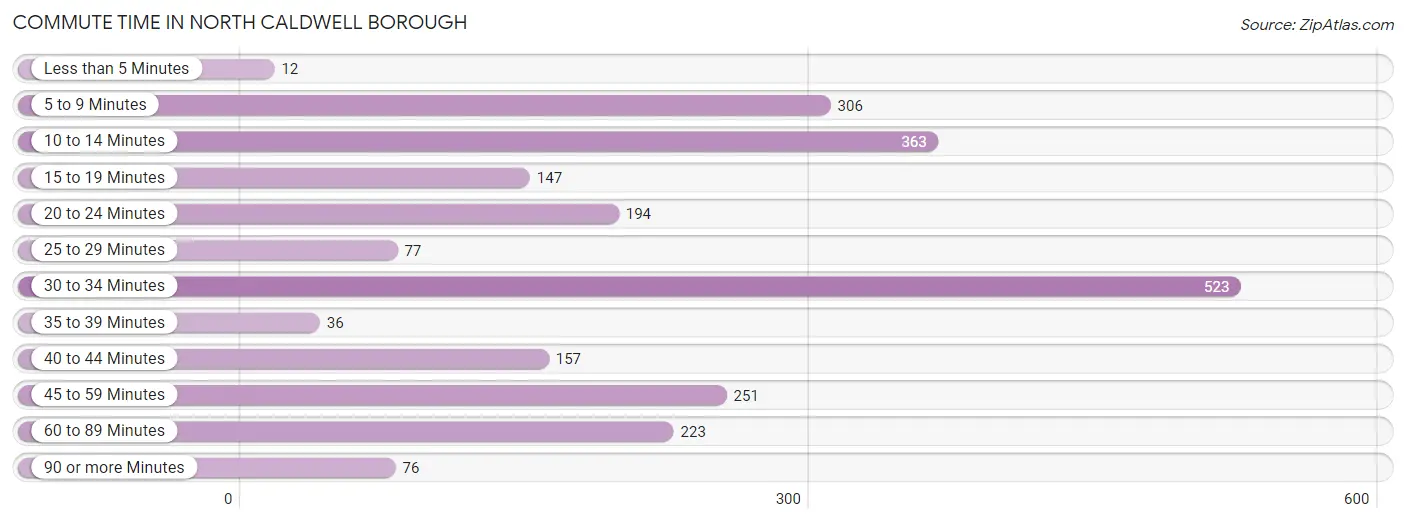
| Commute Time | # Commuters | % Commuters |
| Less than 5 Minutes | 12 | 0.5% |
| 5 to 9 Minutes | 306 | 12.9% |
| 10 to 14 Minutes | 363 | 15.3% |
| 15 to 19 Minutes | 147 | 6.2% |
| 20 to 24 Minutes | 194 | 8.2% |
| 25 to 29 Minutes | 77 | 3.3% |
| 30 to 34 Minutes | 523 | 22.1% |
| 35 to 39 Minutes | 36 | 1.5% |
| 40 to 44 Minutes | 157 | 6.6% |
| 45 to 59 Minutes | 251 | 10.6% |
| 60 to 89 Minutes | 223 | 9.4% |
| 90 or more Minutes | 76 | 3.2% |
Commute Time by Sex in North Caldwell borough
The most common commute times in North Caldwell borough are 10 to 14 minutes (300 commuters, 23.1%) for males and 30 to 34 minutes (423 commuters, 39.6%) for females.
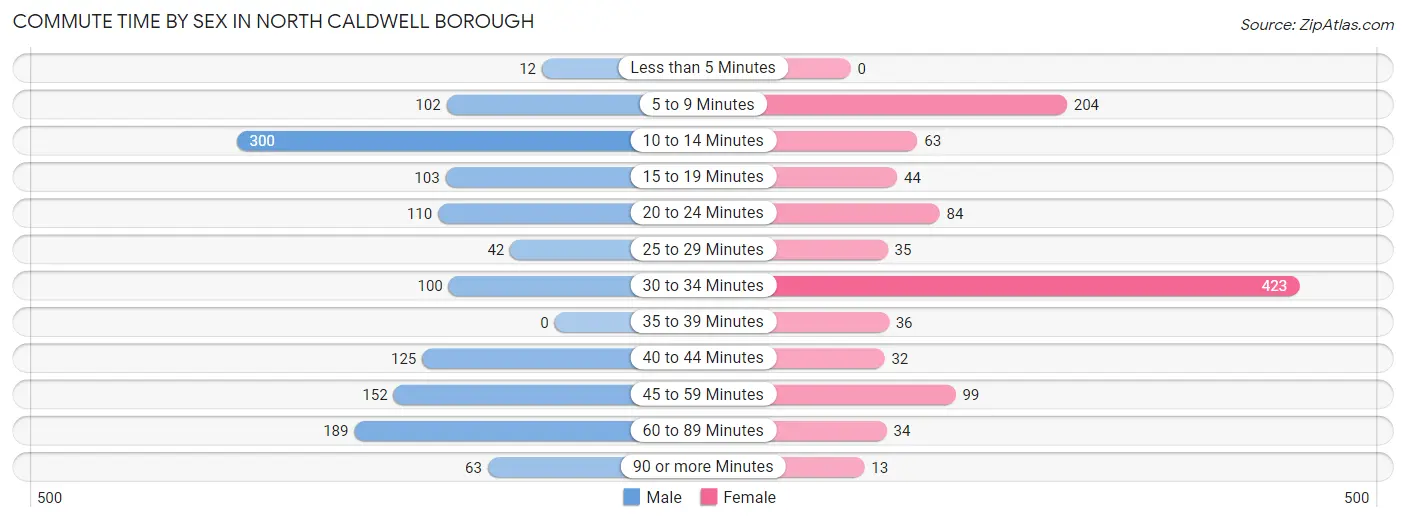
| Commute Time | Male | Female |
| Less than 5 Minutes | 12 (0.9%) | 0 (0.0%) |
| 5 to 9 Minutes | 102 (7.9%) | 204 (19.1%) |
| 10 to 14 Minutes | 300 (23.1%) | 63 (5.9%) |
| 15 to 19 Minutes | 103 (7.9%) | 44 (4.1%) |
| 20 to 24 Minutes | 110 (8.5%) | 84 (7.9%) |
| 25 to 29 Minutes | 42 (3.2%) | 35 (3.3%) |
| 30 to 34 Minutes | 100 (7.7%) | 423 (39.6%) |
| 35 to 39 Minutes | 0 (0.0%) | 36 (3.4%) |
| 40 to 44 Minutes | 125 (9.6%) | 32 (3.0%) |
| 45 to 59 Minutes | 152 (11.7%) | 99 (9.3%) |
| 60 to 89 Minutes | 189 (14.6%) | 34 (3.2%) |
| 90 or more Minutes | 63 (4.9%) | 13 (1.2%) |
Time of Departure to Work by Sex in North Caldwell borough
The most frequent times of departure to work in North Caldwell borough are 6:00 AM to 6:29 AM (236, 18.2%) for males and 8:00 AM to 8:29 AM (235, 22.0%) for females.
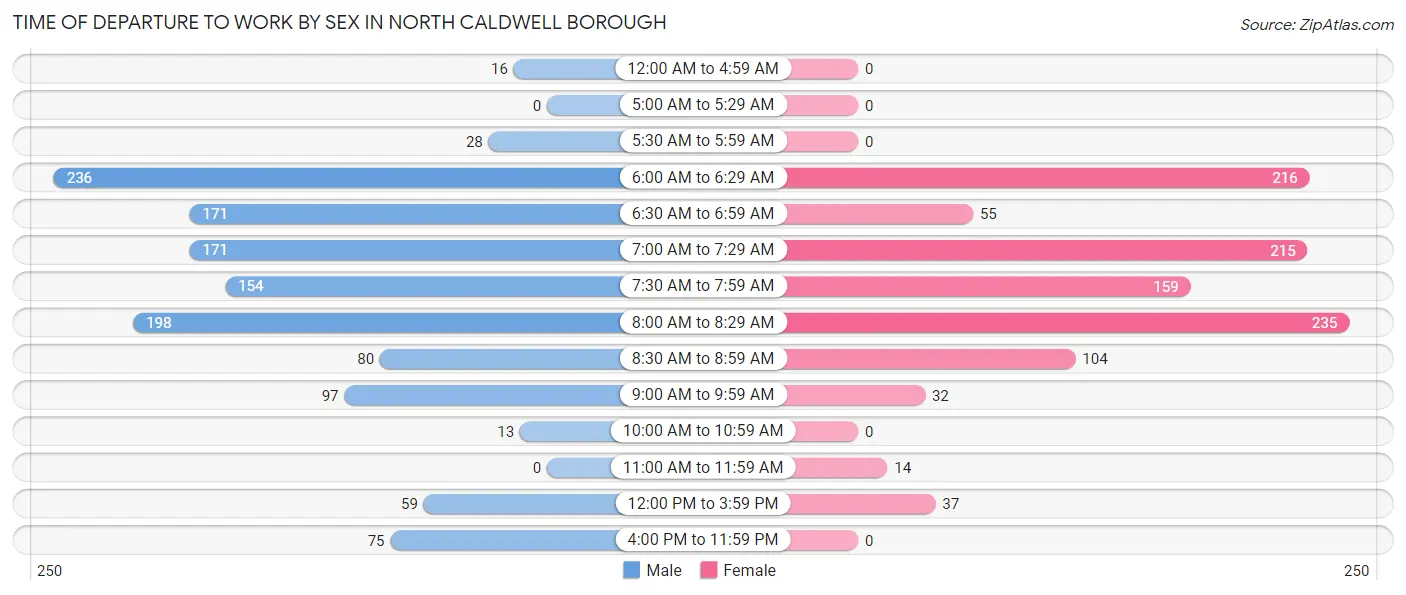
| Time of Departure | Male | Female |
| 12:00 AM to 4:59 AM | 16 (1.2%) | 0 (0.0%) |
| 5:00 AM to 5:29 AM | 0 (0.0%) | 0 (0.0%) |
| 5:30 AM to 5:59 AM | 28 (2.2%) | 0 (0.0%) |
| 6:00 AM to 6:29 AM | 236 (18.2%) | 216 (20.2%) |
| 6:30 AM to 6:59 AM | 171 (13.2%) | 55 (5.1%) |
| 7:00 AM to 7:29 AM | 171 (13.2%) | 215 (20.2%) |
| 7:30 AM to 7:59 AM | 154 (11.9%) | 159 (14.9%) |
| 8:00 AM to 8:29 AM | 198 (15.2%) | 235 (22.0%) |
| 8:30 AM to 8:59 AM | 80 (6.2%) | 104 (9.8%) |
| 9:00 AM to 9:59 AM | 97 (7.5%) | 32 (3.0%) |
| 10:00 AM to 10:59 AM | 13 (1.0%) | 0 (0.0%) |
| 11:00 AM to 11:59 AM | 0 (0.0%) | 14 (1.3%) |
| 12:00 PM to 3:59 PM | 59 (4.5%) | 37 (3.5%) |
| 4:00 PM to 11:59 PM | 75 (5.8%) | 0 (0.0%) |
| Total | 1,298 (100.0%) | 1,067 (100.0%) |
Housing Occupancy in North Caldwell borough
Occupancy by Ownership in North Caldwell borough
Of the total 2,208 dwellings in North Caldwell borough, owner-occupied units account for 2,151 (97.4%), while renter-occupied units make up 57 (2.6%).
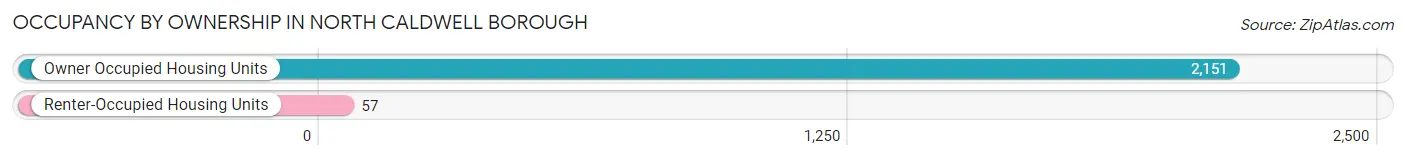
| Occupancy | # Housing Units | % Housing Units |
| Owner Occupied Housing Units | 2,151 | 97.4% |
| Renter-Occupied Housing Units | 57 | 2.6% |
| Total Occupied Housing Units | 2,208 | 100.0% |
Occupancy by Household Size in North Caldwell borough
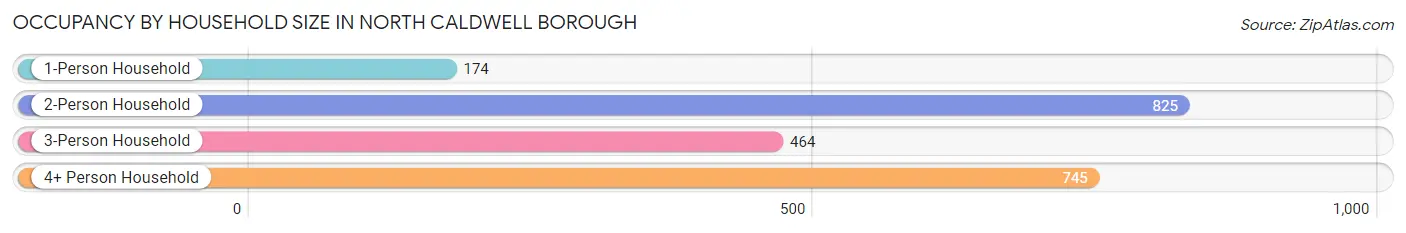
| Household Size | # Housing Units | % Housing Units |
| 1-Person Household | 174 | 7.9% |
| 2-Person Household | 825 | 37.4% |
| 3-Person Household | 464 | 21.0% |
| 4+ Person Household | 745 | 33.7% |
| Total Housing Units | 2,208 | 100.0% |
Occupancy by Ownership by Household Size in North Caldwell borough
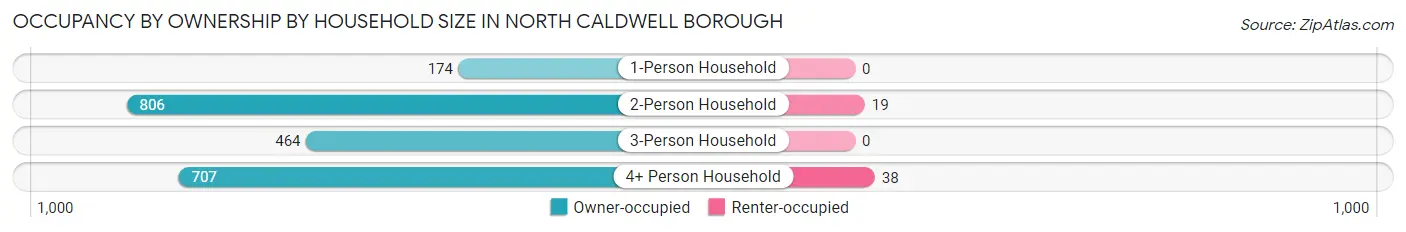
| Household Size | Owner-occupied | Renter-occupied |
| 1-Person Household | 174 (100.0%) | 0 (0.0%) |
| 2-Person Household | 806 (97.7%) | 19 (2.3%) |
| 3-Person Household | 464 (100.0%) | 0 (0.0%) |
| 4+ Person Household | 707 (94.9%) | 38 (5.1%) |
| Total Housing Units | 2,151 (97.4%) | 57 (2.6%) |
Occupancy by Educational Attainment in North Caldwell borough
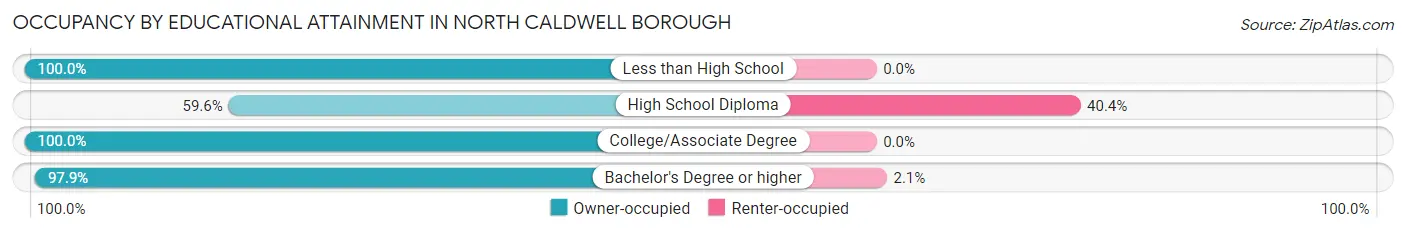
| Household Size | Owner-occupied | Renter-occupied |
| Less than High School | 37 (100.0%) | 0 (0.0%) |
| High School Diploma | 28 (59.6%) | 19 (40.4%) |
| College/Associate Degree | 275 (100.0%) | 0 (0.0%) |
| Bachelor's Degree or higher | 1,811 (97.9%) | 38 (2.1%) |
Occupancy by Age of Householder in North Caldwell borough
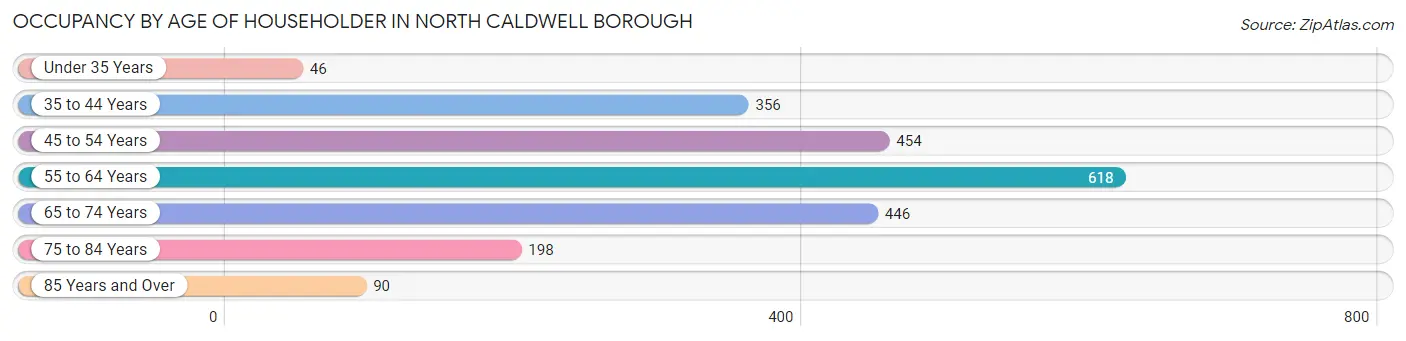
| Age Bracket | # Households | % Households |
| Under 35 Years | 46 | 2.1% |
| 35 to 44 Years | 356 | 16.1% |
| 45 to 54 Years | 454 | 20.6% |
| 55 to 64 Years | 618 | 28.0% |
| 65 to 74 Years | 446 | 20.2% |
| 75 to 84 Years | 198 | 9.0% |
| 85 Years and Over | 90 | 4.1% |
| Total | 2,208 | 100.0% |
Housing Finances in North Caldwell borough
Median Income by Occupancy in North Caldwell borough
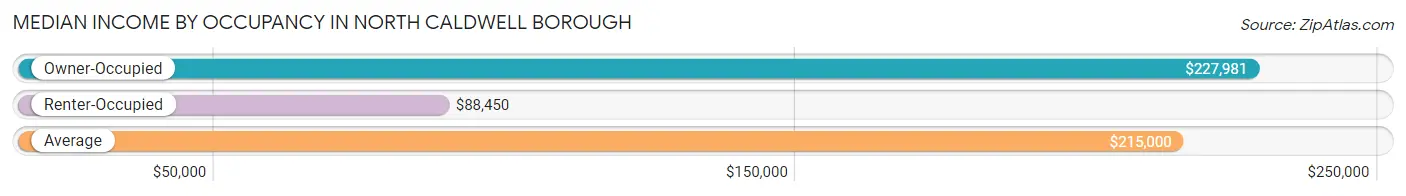
| Occupancy Type | # Households | Median Income |
| Owner-Occupied | 2,151 (97.4%) | $227,981 |
| Renter-Occupied | 57 (2.6%) | $88,450 |
| Average | 2,208 (100.0%) | $215,000 |
Occupancy by Householder Income Bracket in North Caldwell borough
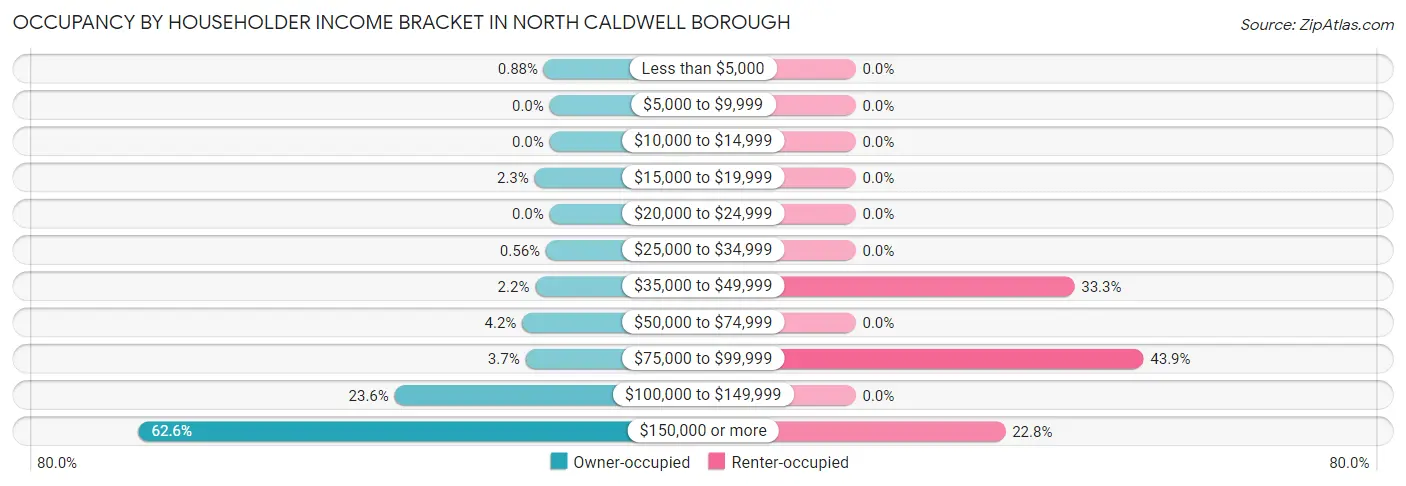
| Income Bracket | Owner-occupied | Renter-occupied |
| Less than $5,000 | 19 (0.9%) | 0 (0.0%) |
| $5,000 to $9,999 | 0 (0.0%) | 0 (0.0%) |
| $10,000 to $14,999 | 0 (0.0%) | 0 (0.0%) |
| $15,000 to $19,999 | 49 (2.3%) | 0 (0.0%) |
| $20,000 to $24,999 | 0 (0.0%) | 0 (0.0%) |
| $25,000 to $34,999 | 12 (0.6%) | 0 (0.0%) |
| $35,000 to $49,999 | 47 (2.2%) | 19 (33.3%) |
| $50,000 to $74,999 | 90 (4.2%) | 0 (0.0%) |
| $75,000 to $99,999 | 79 (3.7%) | 25 (43.9%) |
| $100,000 to $149,999 | 508 (23.6%) | 0 (0.0%) |
| $150,000 or more | 1,347 (62.6%) | 13 (22.8%) |
| Total | 2,151 (100.0%) | 57 (100.0%) |
Monthly Housing Cost Tiers in North Caldwell borough
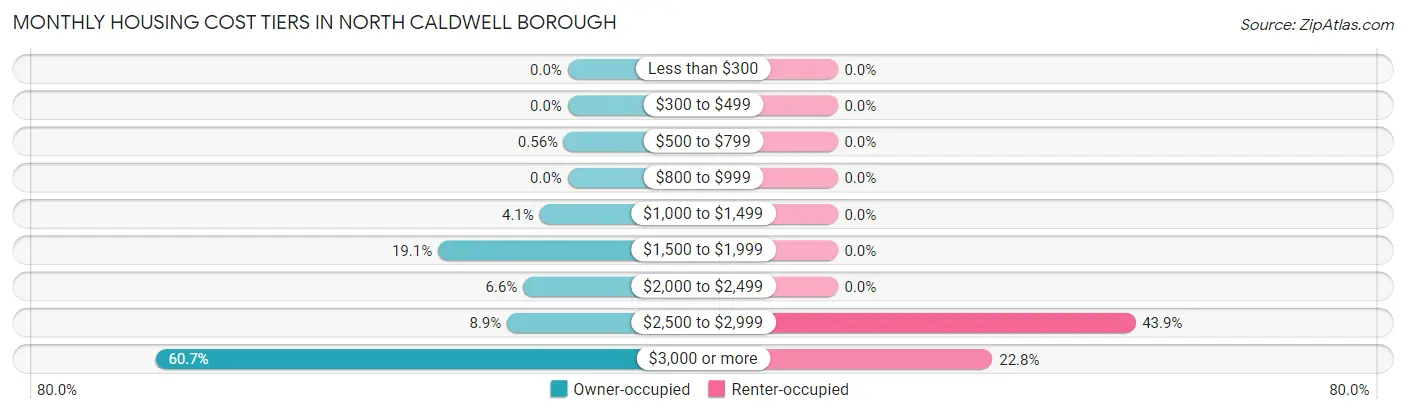
| Monthly Cost | Owner-occupied | Renter-occupied |
| Less than $300 | 0 (0.0%) | 0 (0.0%) |
| $300 to $499 | 0 (0.0%) | 0 (0.0%) |
| $500 to $799 | 12 (0.6%) | 0 (0.0%) |
| $800 to $999 | 0 (0.0%) | 0 (0.0%) |
| $1,000 to $1,499 | 89 (4.1%) | 0 (0.0%) |
| $1,500 to $1,999 | 411 (19.1%) | 0 (0.0%) |
| $2,000 to $2,499 | 141 (6.6%) | 0 (0.0%) |
| $2,500 to $2,999 | 192 (8.9%) | 25 (43.9%) |
| $3,000 or more | 1,306 (60.7%) | 13 (22.8%) |
| Total | 2,151 (100.0%) | 57 (100.0%) |
Physical Housing Characteristics in North Caldwell borough
Housing Structures in North Caldwell borough
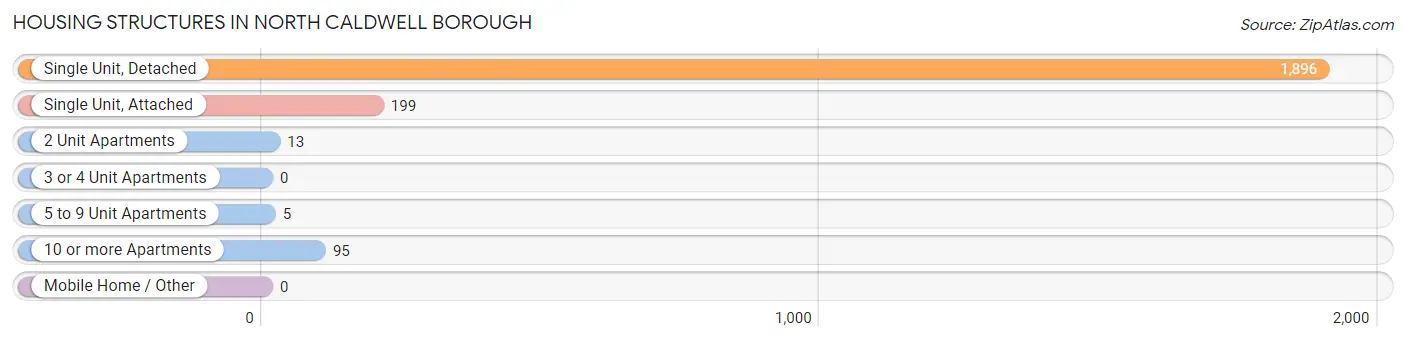
| Structure Type | # Housing Units | % Housing Units |
| Single Unit, Detached | 1,896 | 85.9% |
| Single Unit, Attached | 199 | 9.0% |
| 2 Unit Apartments | 13 | 0.6% |
| 3 or 4 Unit Apartments | 0 | 0.0% |
| 5 to 9 Unit Apartments | 5 | 0.2% |
| 10 or more Apartments | 95 | 4.3% |
| Mobile Home / Other | 0 | 0.0% |
| Total | 2,208 | 100.0% |
Housing Structures by Occupancy in North Caldwell borough
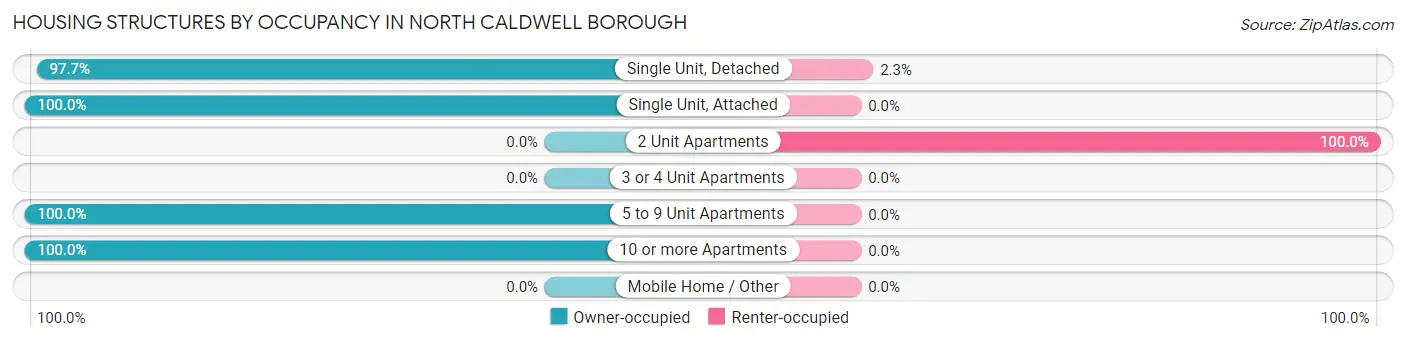
| Structure Type | Owner-occupied | Renter-occupied |
| Single Unit, Detached | 1,852 (97.7%) | 44 (2.3%) |
| Single Unit, Attached | 199 (100.0%) | 0 (0.0%) |
| 2 Unit Apartments | 0 (0.0%) | 13 (100.0%) |
| 3 or 4 Unit Apartments | 0 (0.0%) | 0 (0.0%) |
| 5 to 9 Unit Apartments | 5 (100.0%) | 0 (0.0%) |
| 10 or more Apartments | 95 (100.0%) | 0 (0.0%) |
| Mobile Home / Other | 0 (0.0%) | 0 (0.0%) |
| Total | 2,151 (97.4%) | 57 (2.6%) |
Housing Structures by Number of Rooms in North Caldwell borough
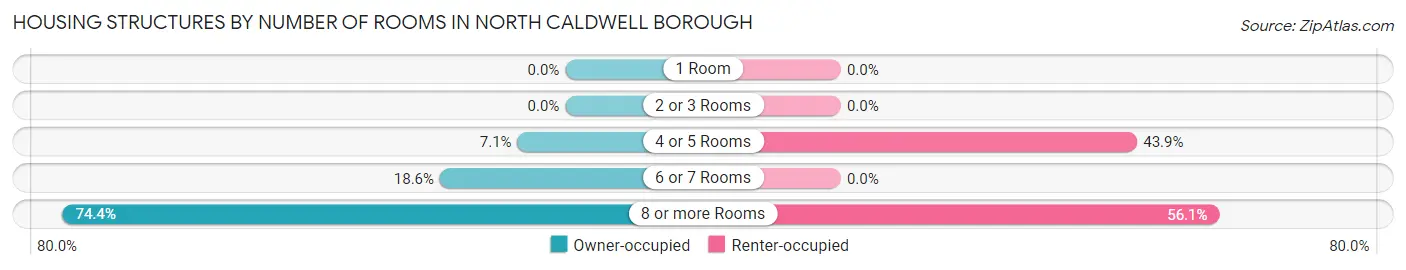
| Number of Rooms | Owner-occupied | Renter-occupied |
| 1 Room | 0 (0.0%) | 0 (0.0%) |
| 2 or 3 Rooms | 0 (0.0%) | 0 (0.0%) |
| 4 or 5 Rooms | 152 (7.1%) | 25 (43.9%) |
| 6 or 7 Rooms | 399 (18.5%) | 0 (0.0%) |
| 8 or more Rooms | 1,600 (74.4%) | 32 (56.1%) |
| Total | 2,151 (100.0%) | 57 (100.0%) |
Housing Structure by Heating Type in North Caldwell borough
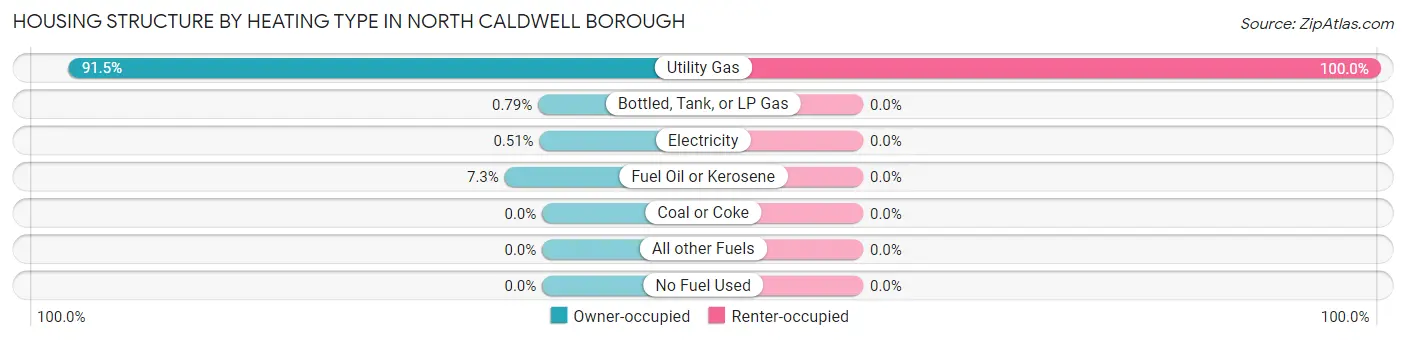
| Heating Type | Owner-occupied | Renter-occupied |
| Utility Gas | 1,967 (91.4%) | 57 (100.0%) |
| Bottled, Tank, or LP Gas | 17 (0.8%) | 0 (0.0%) |
| Electricity | 11 (0.5%) | 0 (0.0%) |
| Fuel Oil or Kerosene | 156 (7.2%) | 0 (0.0%) |
| Coal or Coke | 0 (0.0%) | 0 (0.0%) |
| All other Fuels | 0 (0.0%) | 0 (0.0%) |
| No Fuel Used | 0 (0.0%) | 0 (0.0%) |
| Total | 2,151 (100.0%) | 57 (100.0%) |
Household Vehicle Usage in North Caldwell borough
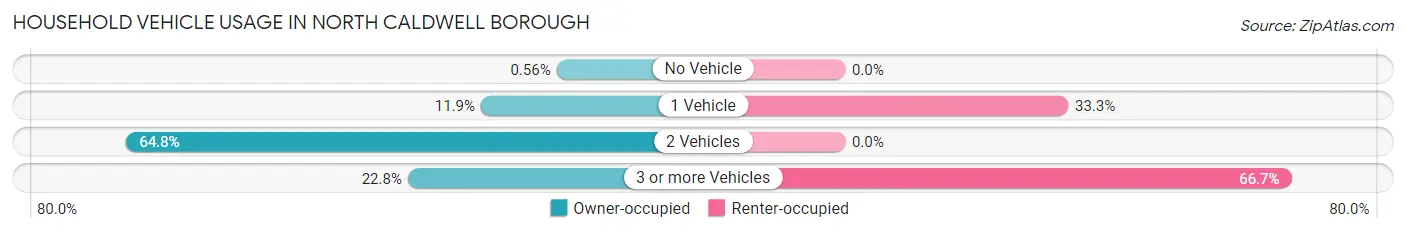
| Vehicles per Household | Owner-occupied | Renter-occupied |
| No Vehicle | 12 (0.6%) | 0 (0.0%) |
| 1 Vehicle | 255 (11.8%) | 19 (33.3%) |
| 2 Vehicles | 1,394 (64.8%) | 0 (0.0%) |
| 3 or more Vehicles | 490 (22.8%) | 38 (66.7%) |
| Total | 2,151 (100.0%) | 57 (100.0%) |
Real Estate & Mortgages in North Caldwell borough
Real Estate and Mortgage Overview in North Caldwell borough
| Characteristic | Without Mortgage | With Mortgage |
| Housing Units | 770 | 1,381 |
| Median Property Value | $839,700 | $919,500 |
| Median Household Income | $144,843 | $971 |
| Monthly Housing Costs | $1,501 | $1,214 |
| Real Estate Taxes | $10,001 | $0 |
Property Value by Mortgage Status in North Caldwell borough
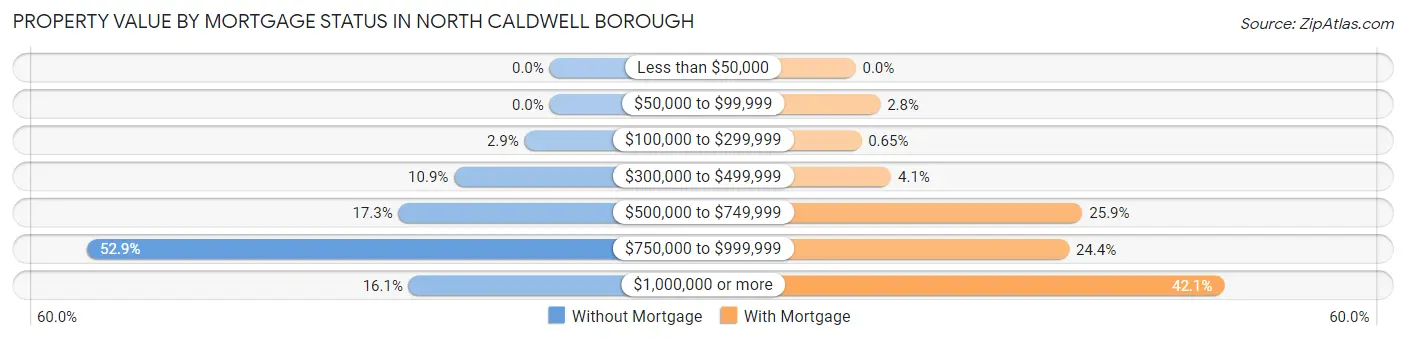
| Property Value | Without Mortgage | With Mortgage |
| Less than $50,000 | 0 (0.0%) | 0 (0.0%) |
| $50,000 to $99,999 | 0 (0.0%) | 39 (2.8%) |
| $100,000 to $299,999 | 22 (2.9%) | 9 (0.6%) |
| $300,000 to $499,999 | 84 (10.9%) | 56 (4.1%) |
| $500,000 to $749,999 | 133 (17.3%) | 358 (25.9%) |
| $750,000 to $999,999 | 407 (52.9%) | 337 (24.4%) |
| $1,000,000 or more | 124 (16.1%) | 582 (42.1%) |
| Total | 770 (100.0%) | 1,381 (100.0%) |
Household Income by Mortgage Status in North Caldwell borough
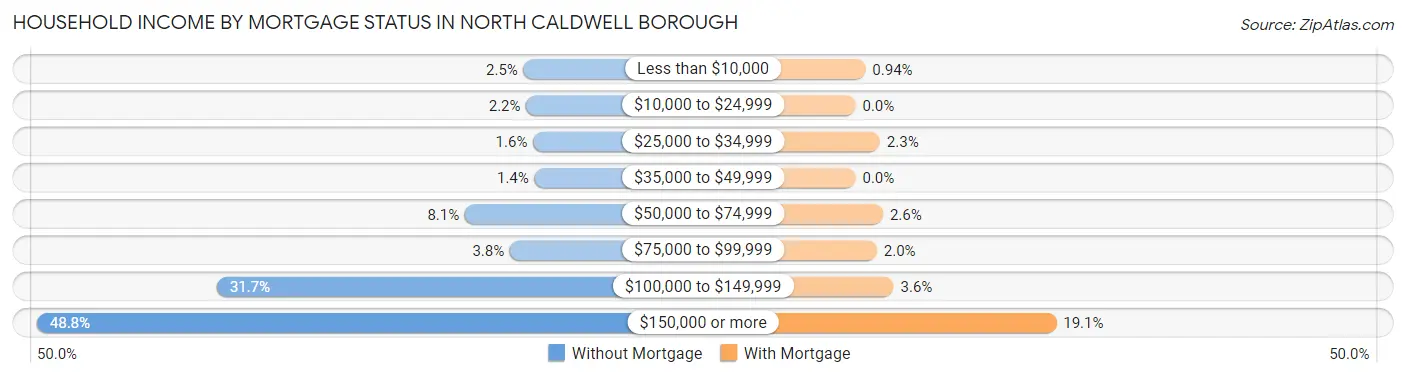
| Household Income | Without Mortgage | With Mortgage |
| Less than $10,000 | 19 (2.5%) | 13 (0.9%) |
| $10,000 to $24,999 | 17 (2.2%) | 0 (0.0%) |
| $25,000 to $34,999 | 12 (1.6%) | 32 (2.3%) |
| $35,000 to $49,999 | 11 (1.4%) | 0 (0.0%) |
| $50,000 to $74,999 | 62 (8.1%) | 36 (2.6%) |
| $75,000 to $99,999 | 29 (3.8%) | 28 (2.0%) |
| $100,000 to $149,999 | 244 (31.7%) | 50 (3.6%) |
| $150,000 or more | 376 (48.8%) | 264 (19.1%) |
| Total | 770 (100.0%) | 1,381 (100.0%) |
Property Value to Household Income Ratio in North Caldwell borough
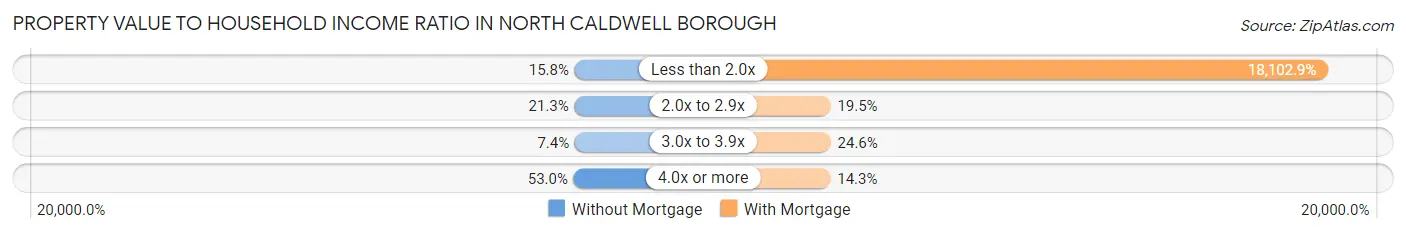
| Value-to-Income Ratio | Without Mortgage | With Mortgage |
| Less than 2.0x | 122 (15.8%) | 250,001 (18,102.9%) |
| 2.0x to 2.9x | 164 (21.3%) | 269 (19.5%) |
| 3.0x to 3.9x | 57 (7.4%) | 339 (24.5%) |
| 4.0x or more | 408 (53.0%) | 197 (14.3%) |
| Total | 770 (100.0%) | 1,381 (100.0%) |
Real Estate Taxes by Mortgage Status in North Caldwell borough
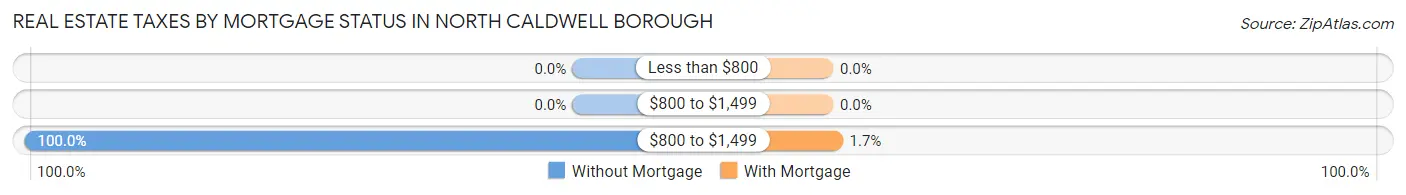
| Property Taxes | Without Mortgage | With Mortgage |
| Less than $800 | 0 (0.0%) | 0 (0.0%) |
| $800 to $1,499 | 0 (0.0%) | 0 (0.0%) |
| $800 to $1,499 | 770 (100.0%) | 24 (1.7%) |
| Total | 770 (100.0%) | 1,381 (100.0%) |
Health & Disability in North Caldwell borough
Health Insurance Coverage by Age in North Caldwell borough
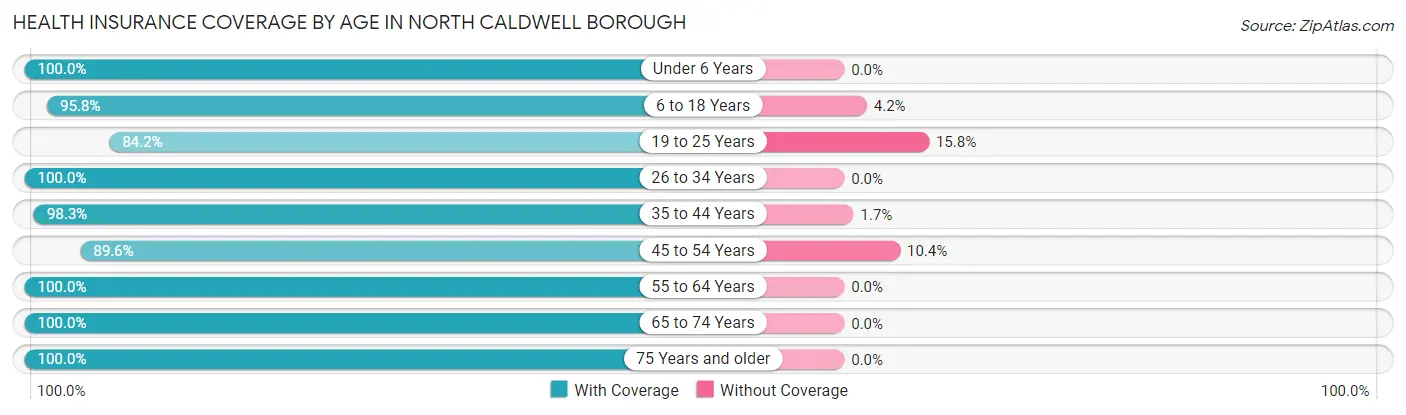
| Age Bracket | With Coverage | Without Coverage |
| Under 6 Years | 508 (100.0%) | 0 (0.0%) |
| 6 to 18 Years | 1,095 (95.8%) | 48 (4.2%) |
| 19 to 25 Years | 336 (84.2%) | 63 (15.8%) |
| 26 to 34 Years | 334 (100.0%) | 0 (0.0%) |
| 35 to 44 Years | 734 (98.3%) | 13 (1.7%) |
| 45 to 54 Years | 827 (89.6%) | 96 (10.4%) |
| 55 to 64 Years | 1,114 (100.0%) | 0 (0.0%) |
| 65 to 74 Years | 975 (100.0%) | 0 (0.0%) |
| 75 Years and older | 482 (100.0%) | 0 (0.0%) |
| Total | 6,405 (96.7%) | 220 (3.3%) |
Health Insurance Coverage by Citizenship Status in North Caldwell borough
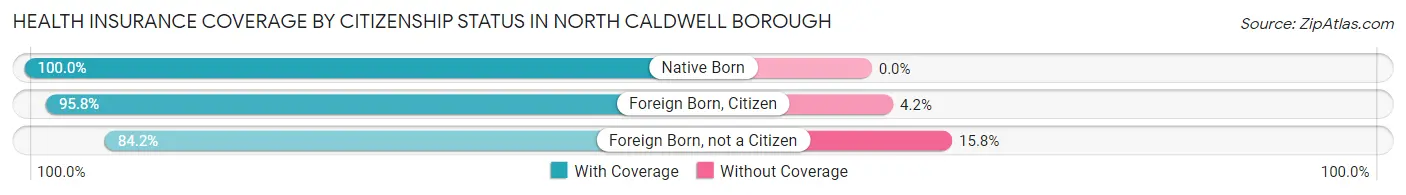
| Citizenship Status | With Coverage | Without Coverage |
| Native Born | 508 (100.0%) | 0 (0.0%) |
| Foreign Born, Citizen | 1,095 (95.8%) | 48 (4.2%) |
| Foreign Born, not a Citizen | 336 (84.2%) | 63 (15.8%) |
Health Insurance Coverage by Household Income in North Caldwell borough
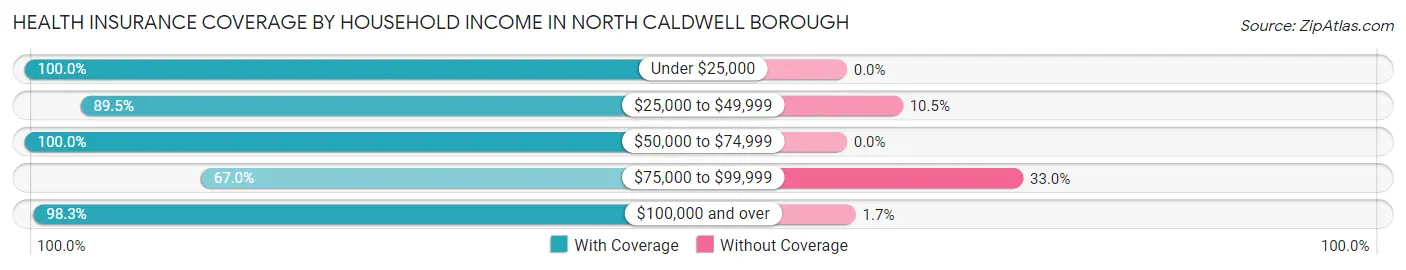
| Household Income | With Coverage | Without Coverage |
| Under $25,000 | 68 (100.0%) | 0 (0.0%) |
| $25,000 to $49,999 | 111 (89.5%) | 13 (10.5%) |
| $50,000 to $74,999 | 194 (100.0%) | 0 (0.0%) |
| $75,000 to $99,999 | 221 (67.0%) | 109 (33.0%) |
| $100,000 and over | 5,811 (98.3%) | 98 (1.7%) |
Public vs Private Health Insurance Coverage by Age in North Caldwell borough
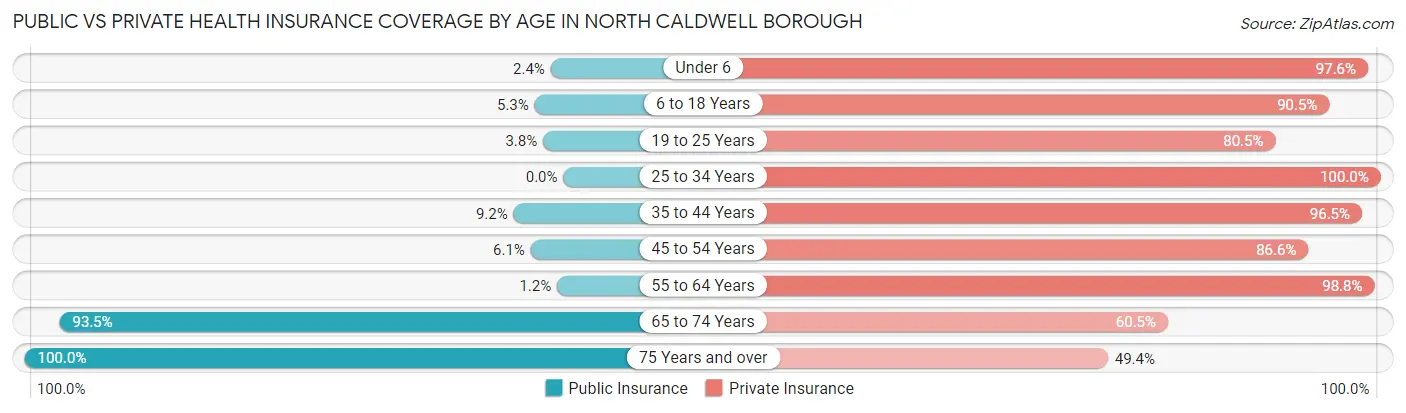
| Age Bracket | Public Insurance | Private Insurance |
| Under 6 | 12 (2.4%) | 496 (97.6%) |
| 6 to 18 Years | 61 (5.3%) | 1,034 (90.5%) |
| 19 to 25 Years | 15 (3.8%) | 321 (80.4%) |
| 25 to 34 Years | 0 (0.0%) | 334 (100.0%) |
| 35 to 44 Years | 69 (9.2%) | 721 (96.5%) |
| 45 to 54 Years | 56 (6.1%) | 799 (86.6%) |
| 55 to 64 Years | 13 (1.2%) | 1,101 (98.8%) |
| 65 to 74 Years | 912 (93.5%) | 590 (60.5%) |
| 75 Years and over | 482 (100.0%) | 238 (49.4%) |
| Total | 1,620 (24.4%) | 5,634 (85.0%) |
Disability Status by Sex by Age in North Caldwell borough
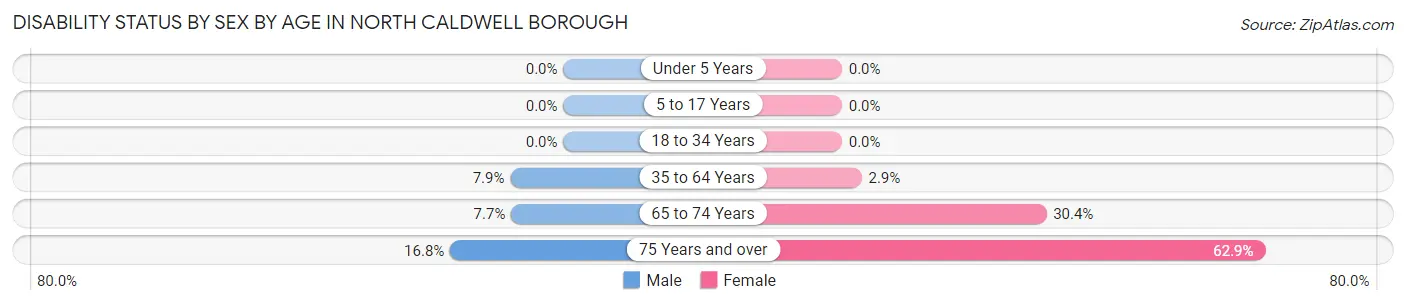
| Age Bracket | Male | Female |
| Under 5 Years | 0 (0.0%) | 0 (0.0%) |
| 5 to 17 Years | 0 (0.0%) | 0 (0.0%) |
| 18 to 34 Years | 0 (0.0%) | 0 (0.0%) |
| 35 to 64 Years | 109 (7.9%) | 41 (2.9%) |
| 65 to 74 Years | 27 (7.7%) | 190 (30.3%) |
| 75 Years and over | 38 (16.8%) | 161 (62.9%) |
Disability Class by Sex by Age in North Caldwell borough
Disability Class: Hearing Difficulty
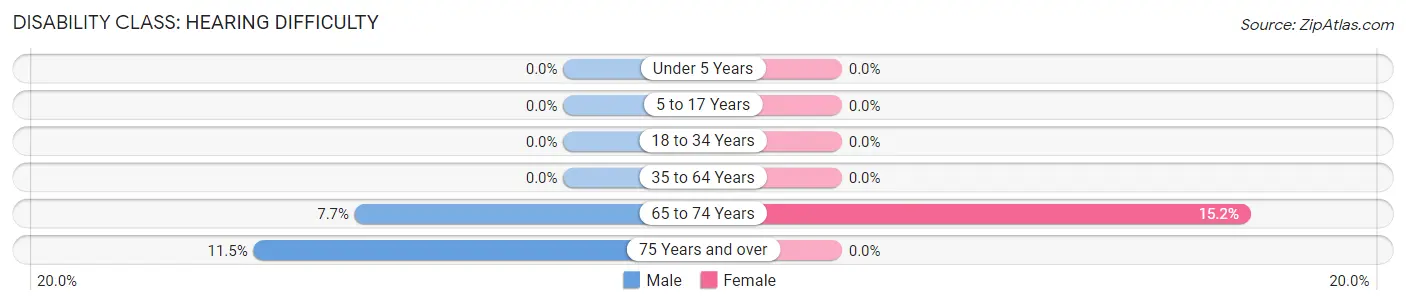
| Age Bracket | Male | Female |
| Under 5 Years | 0 (0.0%) | 0 (0.0%) |
| 5 to 17 Years | 0 (0.0%) | 0 (0.0%) |
| 18 to 34 Years | 0 (0.0%) | 0 (0.0%) |
| 35 to 64 Years | 0 (0.0%) | 0 (0.0%) |
| 65 to 74 Years | 27 (7.7%) | 95 (15.2%) |
| 75 Years and over | 26 (11.5%) | 0 (0.0%) |
Disability Class: Vision Difficulty
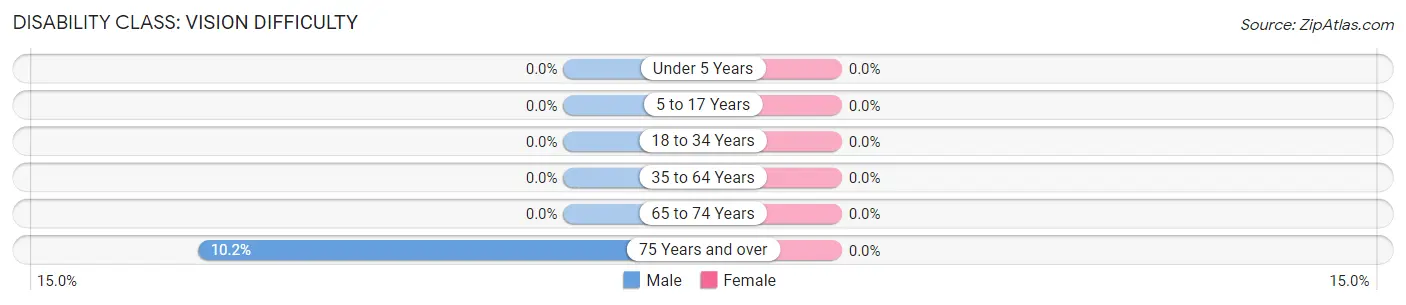
| Age Bracket | Male | Female |
| Under 5 Years | 0 (0.0%) | 0 (0.0%) |
| 5 to 17 Years | 0 (0.0%) | 0 (0.0%) |
| 18 to 34 Years | 0 (0.0%) | 0 (0.0%) |
| 35 to 64 Years | 0 (0.0%) | 0 (0.0%) |
| 65 to 74 Years | 0 (0.0%) | 0 (0.0%) |
| 75 Years and over | 23 (10.2%) | 0 (0.0%) |
Disability Class: Cognitive Difficulty
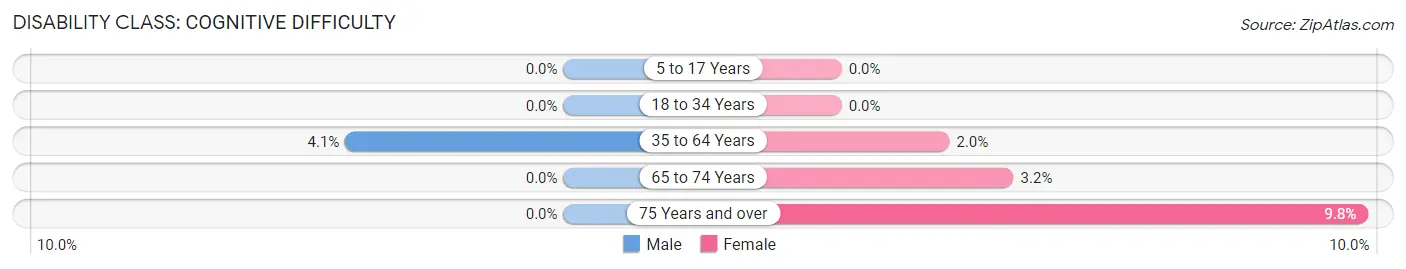
| Age Bracket | Male | Female |
| 5 to 17 Years | 0 (0.0%) | 0 (0.0%) |
| 18 to 34 Years | 0 (0.0%) | 0 (0.0%) |
| 35 to 64 Years | 56 (4.1%) | 28 (2.0%) |
| 65 to 74 Years | 0 (0.0%) | 20 (3.2%) |
| 75 Years and over | 0 (0.0%) | 25 (9.8%) |
Disability Class: Ambulatory Difficulty
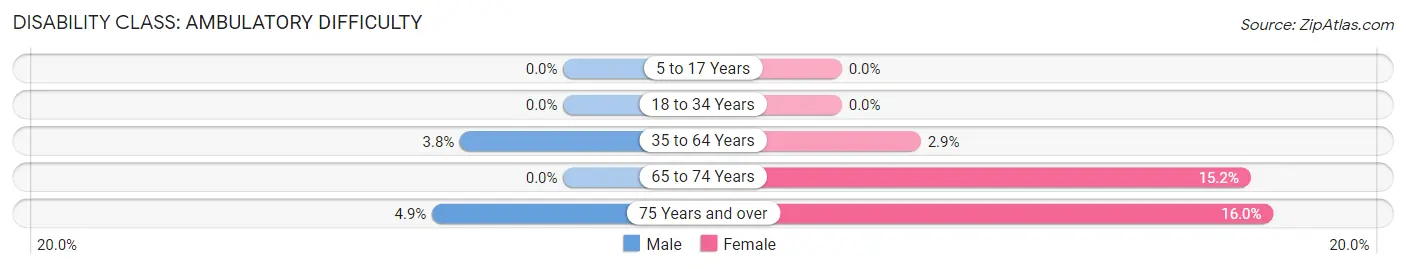
| Age Bracket | Male | Female |
| 5 to 17 Years | 0 (0.0%) | 0 (0.0%) |
| 18 to 34 Years | 0 (0.0%) | 0 (0.0%) |
| 35 to 64 Years | 53 (3.8%) | 41 (2.9%) |
| 65 to 74 Years | 0 (0.0%) | 95 (15.2%) |
| 75 Years and over | 11 (4.9%) | 41 (16.0%) |
Disability Class: Self-Care Difficulty
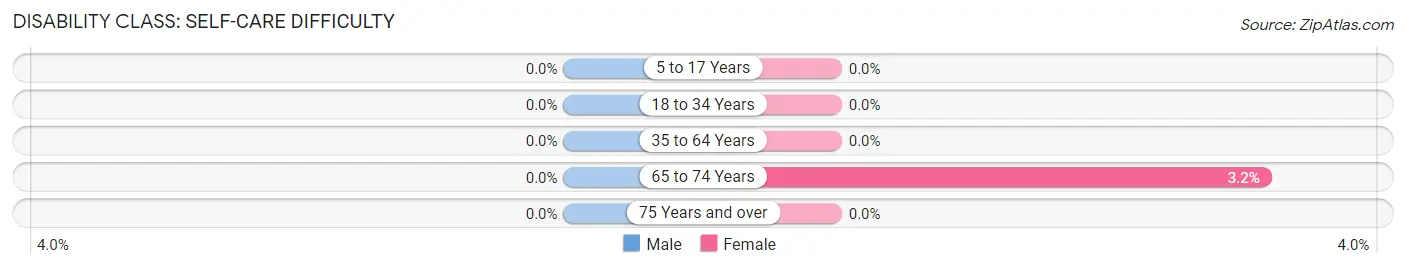
| Age Bracket | Male | Female |
| 5 to 17 Years | 0 (0.0%) | 0 (0.0%) |
| 18 to 34 Years | 0 (0.0%) | 0 (0.0%) |
| 35 to 64 Years | 0 (0.0%) | 0 (0.0%) |
| 65 to 74 Years | 0 (0.0%) | 20 (3.2%) |
| 75 Years and over | 0 (0.0%) | 0 (0.0%) |
Technology Access in North Caldwell borough
Computing Device Access in North Caldwell borough
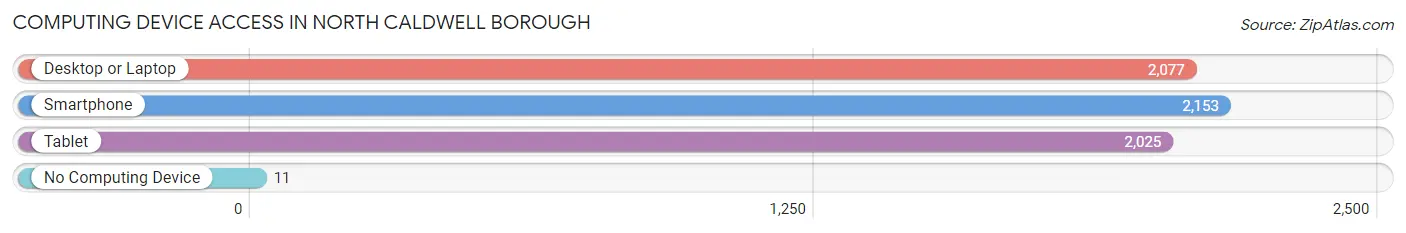
| Device Type | # Households | % Households |
| Desktop or Laptop | 2,077 | 94.1% |
| Smartphone | 2,153 | 97.5% |
| Tablet | 2,025 | 91.7% |
| No Computing Device | 11 | 0.5% |
| Total | 2,208 | 100.0% |
Internet Access in North Caldwell borough
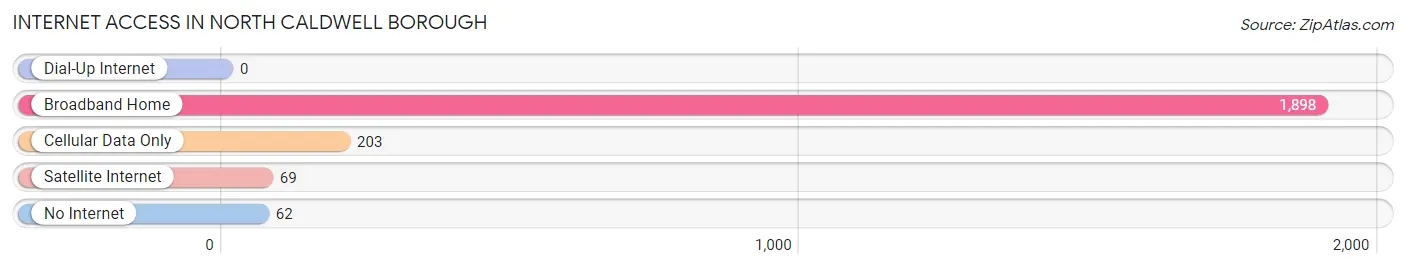
| Internet Type | # Households | % Households |
| Dial-Up Internet | 0 | 0.0% |
| Broadband Home | 1,898 | 86.0% |
| Cellular Data Only | 203 | 9.2% |
| Satellite Internet | 69 | 3.1% |
| No Internet | 62 | 2.8% |
| Total | 2,208 | 100.0% |
North Caldwell borough Summary
Caldwell Borough, NJ is a small borough located in Essex County, New Jersey. It is part of the larger city of Newark and is located just west of the city. The borough is bordered by the towns of West Caldwell, North Caldwell, and Fairfield. The population of the borough was 7,822 as of the 2010 census.
History
The area that is now Caldwell Borough was originally inhabited by the Lenape Native Americans. The area was first settled by Europeans in the late 17th century. The area was part of the Horseneck Tract, which was a parcel of land that was purchased by a group of settlers from Newark in 1676. The area was known as Horseneck until 1798, when it was incorporated as Caldwell Township. The name was chosen in honor of James Caldwell, a local minister and Revolutionary War hero.
In 1892, the area was split into two separate municipalities, North Caldwell and West Caldwell. North Caldwell was incorporated as a borough in 1898.
Geography
Caldwell Borough is located at 40°49'17" North, 74°14'45" West (40.8213, -74.2458). It is located in the northern part of Essex County, New Jersey. The borough is bordered by the towns of West Caldwell, North Caldwell, and Fairfield.
The borough has a total area of 1.3 square miles, all of which is land. The borough is located in the Watchung Mountains, which are part of the larger Appalachian Mountains.
Economy
The economy of Caldwell Borough is largely based on the service industry. The borough is home to a number of small businesses, including restaurants, retail stores, and professional services. The borough is also home to a number of corporate offices, including those of Prudential Financial, Panasonic, and Verizon.
Demographics
As of the 2010 census, the population of Caldwell Borough was 7,822. The racial makeup of the borough was 79.2% White, 8.2% African American, 0.3% Native American, 8.2% Asian, 0.1% Pacific Islander, and 3.2% from other races. Hispanic or Latino of any race were 11.3% of the population.
The median household income in the borough was $90,945, and the median family income was $106,945. The per capita income for the borough was $41,945. About 3.2% of families and 4.3% of the population were below the poverty line, including 5.2% of those under age 18 and 4.2% of those age 65 or over.
The population of Caldwell Borough is well-educated, with 92.2% of residents over the age of 25 having a high school diploma or higher, and 57.2% having a bachelor's degree or higher. The borough is also home to a number of private schools, including the North Caldwell Academy and the West Essex Academy.
Common Questions
What is Per Capita Income in North Caldwell borough?
Per Capita income in North Caldwell borough is $101,872.
What is the Median Family Income in North Caldwell borough?
Median Family Income in North Caldwell borough is $237,500.
What is the Median Household income in North Caldwell borough?
Median Household Income in North Caldwell borough is $215,000.
What is Income or Wage Gap in North Caldwell borough?
Income or Wage Gap in North Caldwell borough is 49.7%.
Women in North Caldwell borough earn 50.3 cents for every dollar earned by a man.
What is Inequality or Gini Index in North Caldwell borough?
Inequality or Gini Index in North Caldwell borough is 0.44.
What is the Total Population of North Caldwell borough?
Total Population of North Caldwell borough is 6,625.
What is the Total Male Population of North Caldwell borough?
Total Male Population of North Caldwell borough is 3,231.
What is the Total Female Population of North Caldwell borough?
Total Female Population of North Caldwell borough is 3,394.
What is the Ratio of Males per 100 Females in North Caldwell borough?
There are 95.20 Males per 100 Females in North Caldwell borough.
What is the Ratio of Females per 100 Males in North Caldwell borough?
There are 105.04 Females per 100 Males in North Caldwell borough.
What is the Median Population Age in North Caldwell borough?
Median Population Age in North Caldwell borough is 46.5 Years.
What is the Average Family Size in North Caldwell borough
Average Family Size in North Caldwell borough is 3.1 People.
What is the Average Household Size in North Caldwell borough
Average Household Size in North Caldwell borough is 3.0 People.
How Large is the Labor Force in North Caldwell borough?
There are 3,473 People in the Labor Forcein in North Caldwell borough.
What is the Percentage of People in the Labor Force in North Caldwell borough?
67.7% of People are in the Labor Force in North Caldwell borough.
What is the Unemployment Rate in North Caldwell borough?
Unemployment Rate in North Caldwell borough is 5.8%.