Little Silver borough, NJ Map & Demographics
Little Silver borough Overview
$102,990
PER CAPITA INCOME
$229,393
AVG FAMILY INCOME
$216,974
AVG HOUSEHOLD INCOME
59.6%
WAGE / INCOME GAP [ % ]
40.4¢/ $1
WAGE / INCOME GAP [ $ ]
0.43
INEQUALITY / GINI INDEX
6,104
TOTAL POPULATION
3,131
MALE POPULATION
2,973
FEMALE POPULATION
105.31
MALES / 100 FEMALES
94.95
FEMALES / 100 MALES
46.3
MEDIAN AGE
3.0
AVG FAMILY SIZE
2.7
AVG HOUSEHOLD SIZE
3,339
LABOR FORCE [ PEOPLE ]
69.7%
PERCENT IN LABOR FORCE
3.3%
UNEMPLOYMENT RATE
Income in Little Silver borough
Income Overview in Little Silver borough
Per Capita Income in Little Silver borough is $102,990, while median incomes of families and households are $229,393 and $216,974 respectively.
| Characteristic | Number | Measure |
| Per Capita Income | 6,104 | $102,990 |
| Median Family Income | 1,801 | $229,393 |
| Mean Family Income | 1,801 | $304,330 |
| Median Household Income | 2,248 | $216,974 |
| Mean Household Income | 2,248 | $278,125 |
| Income Deficit | 1,801 | $0 |
| Wage / Income Gap (%) | 6,104 | 59.56% |
| Wage / Income Gap ($) | 6,104 | 40.44¢ per $1 |
| Gini / Inequality Index | 6,104 | 0.43 |
Earnings by Sex in Little Silver borough
Average Earnings in Little Silver borough are $76,978, $143,056 for men and $57,857 for women, a difference of 59.6%.
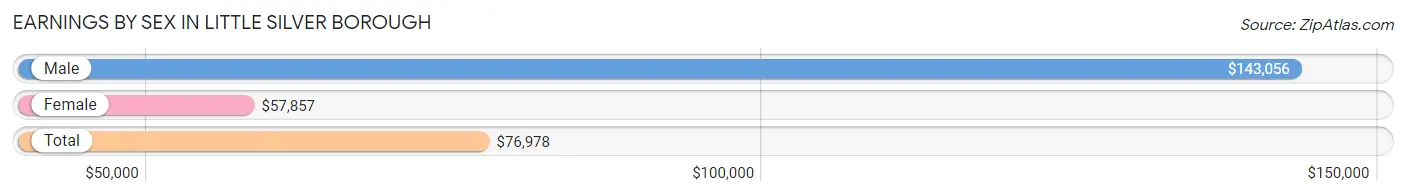
| Sex | Number | Average Earnings |
| Male | 2,016 (57.3%) | $143,056 |
| Female | 1,502 (42.7%) | $57,857 |
| Total | 3,518 (100.0%) | $76,978 |
Earnings by Sex by Income Bracket in Little Silver borough
The most common earnings brackets in Little Silver borough are $100,000+ for men (1,176 | 58.3%) and $100,000+ for women (330 | 22.0%).
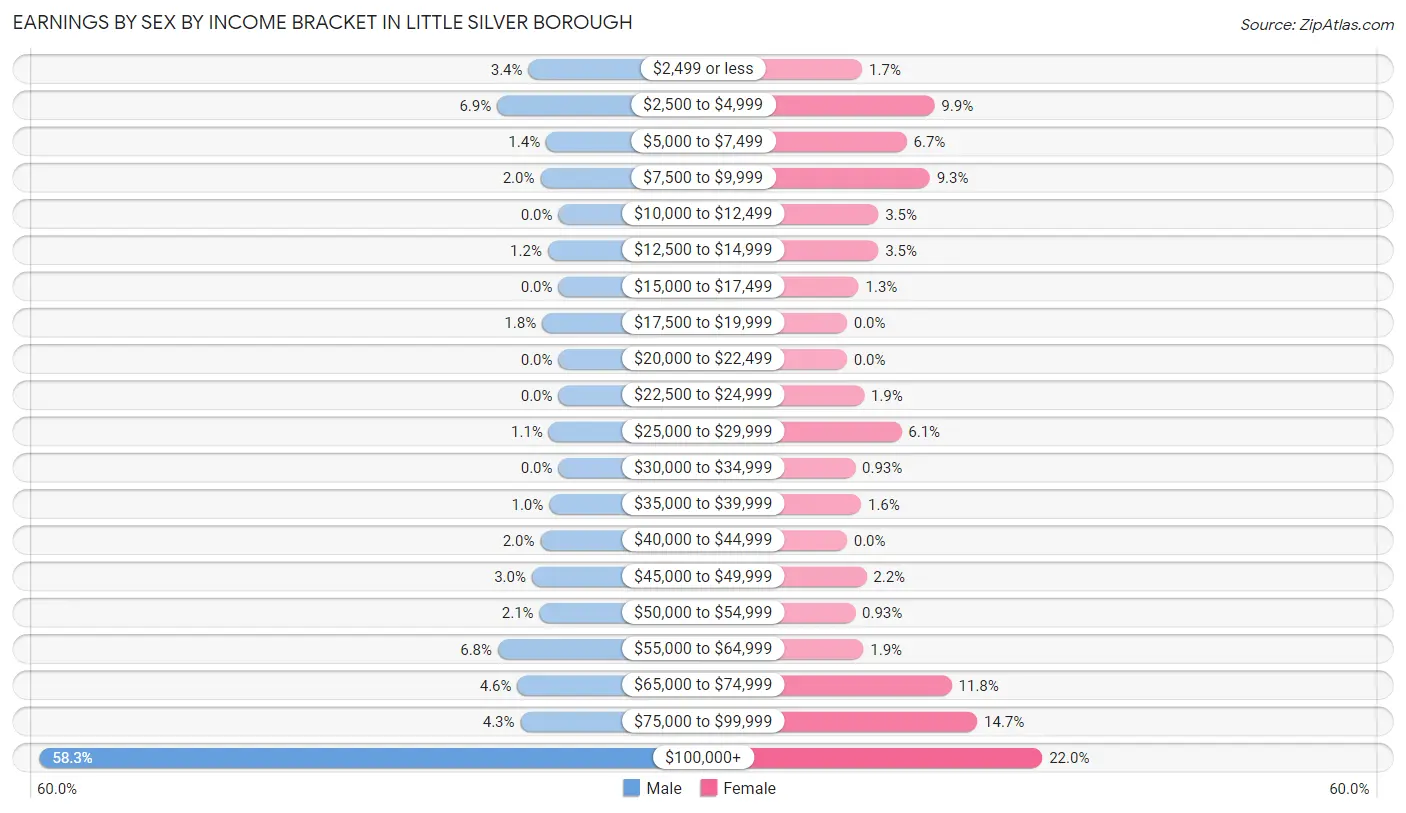
| Income | Male | Female |
| $2,499 or less | 68 (3.4%) | 26 (1.7%) |
| $2,500 to $4,999 | 139 (6.9%) | 148 (9.9%) |
| $5,000 to $7,499 | 28 (1.4%) | 101 (6.7%) |
| $7,500 to $9,999 | 41 (2.0%) | 140 (9.3%) |
| $10,000 to $12,499 | 0 (0.0%) | 53 (3.5%) |
| $12,500 to $14,999 | 24 (1.2%) | 53 (3.5%) |
| $15,000 to $17,499 | 0 (0.0%) | 20 (1.3%) |
| $17,500 to $19,999 | 37 (1.8%) | 0 (0.0%) |
| $20,000 to $22,499 | 0 (0.0%) | 0 (0.0%) |
| $22,500 to $24,999 | 0 (0.0%) | 29 (1.9%) |
| $25,000 to $29,999 | 22 (1.1%) | 92 (6.1%) |
| $30,000 to $34,999 | 0 (0.0%) | 14 (0.9%) |
| $35,000 to $39,999 | 21 (1.0%) | 24 (1.6%) |
| $40,000 to $44,999 | 41 (2.0%) | 0 (0.0%) |
| $45,000 to $49,999 | 60 (3.0%) | 33 (2.2%) |
| $50,000 to $54,999 | 43 (2.1%) | 14 (0.9%) |
| $55,000 to $64,999 | 137 (6.8%) | 28 (1.9%) |
| $65,000 to $74,999 | 93 (4.6%) | 177 (11.8%) |
| $75,000 to $99,999 | 86 (4.3%) | 220 (14.6%) |
| $100,000+ | 1,176 (58.3%) | 330 (22.0%) |
| Total | 2,016 (100.0%) | 1,502 (100.0%) |
Earnings by Sex by Educational Attainment in Little Silver borough
Average earnings in Little Silver borough are $186,328 for men and $69,236 for women, a difference of 62.8%. Men with an educational attainment of graduate degree enjoy the highest average annual earnings of $250,001, while those with high school diploma education earn the least with $56,705. Women with an educational attainment of bachelor's degree earn the most with the average annual earnings of $88,333, while those with college or associate's degree education have the smallest earnings of $11,985.
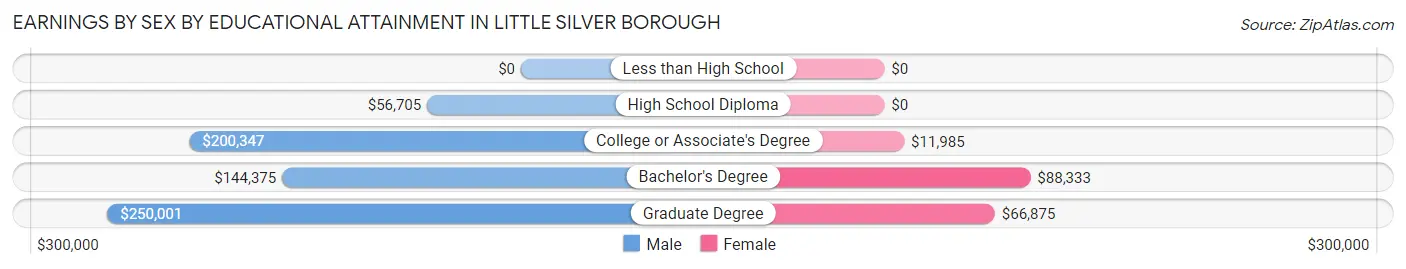
| Educational Attainment | Male Income | Female Income |
| Less than High School | - | - |
| High School Diploma | $56,705 | $0 |
| College or Associate's Degree | $200,347 | $11,985 |
| Bachelor's Degree | $144,375 | $88,333 |
| Graduate Degree | $250,001 | $66,875 |
| Total | $186,328 | $69,236 |
Family Income in Little Silver borough
Family Income Brackets in Little Silver borough
According to the Little Silver borough family income data, there are 1,027 families falling into the $200,000+ income range, which is the most common income bracket and makes up 57.0% of all families.
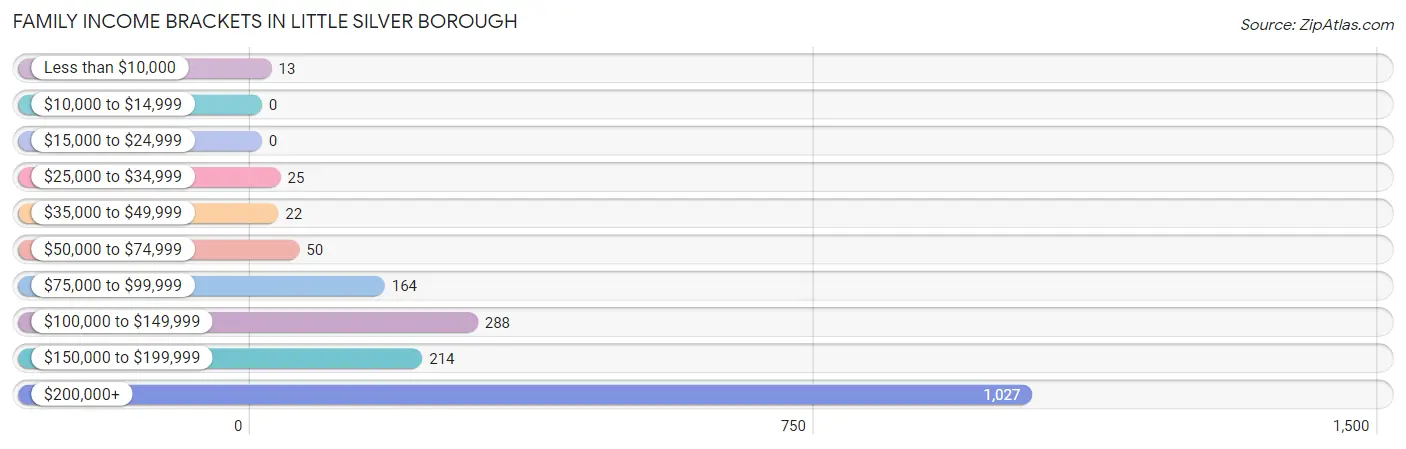
| Income Bracket | # Families | % Families |
| Less than $10,000 | 13 | 0.7% |
| $10,000 to $14,999 | 0 | 0.0% |
| $15,000 to $24,999 | 0 | 0.0% |
| $25,000 to $34,999 | 25 | 1.4% |
| $35,000 to $49,999 | 22 | 1.2% |
| $50,000 to $74,999 | 50 | 2.8% |
| $75,000 to $99,999 | 164 | 9.1% |
| $100,000 to $149,999 | 288 | 16.0% |
| $150,000 to $199,999 | 214 | 11.9% |
| $200,000+ | 1,027 | 57.0% |
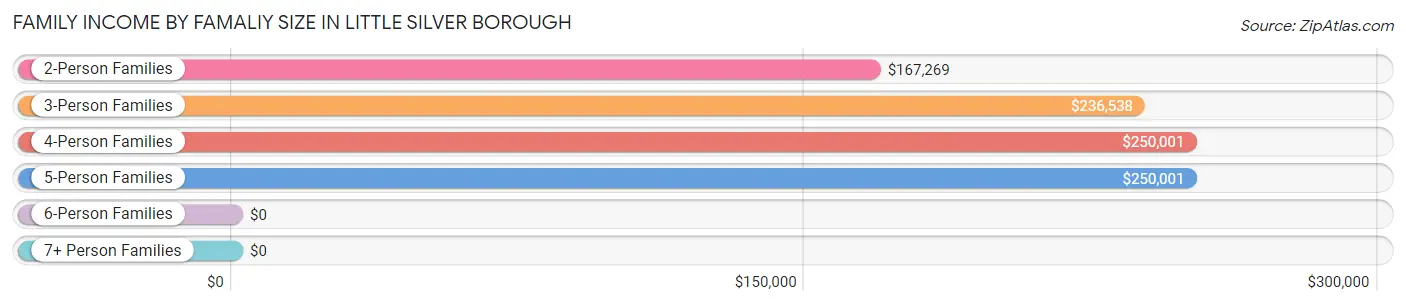
Family Income by Famaliy Size in Little Silver borough
4-person families (371 | 20.6%) account for the highest median family income in Little Silver borough with $250,001 per family, while 2-person families (683 | 37.9%) have the highest median income of $83,634 per family member.
| Income Bracket | # Families | Median Income |
| 2-Person Families | 683 (37.9%) | $167,269 |
| 3-Person Families | 600 (33.3%) | $236,538 |
| 4-Person Families | 371 (20.6%) | $250,001 |
| 5-Person Families | 116 (6.4%) | $250,001 |
| 6-Person Families | 31 (1.7%) | $0 |
| 7+ Person Families | 0 (0.0%) | $0 |
| Total | 1,801 (100.0%) | $229,393 |
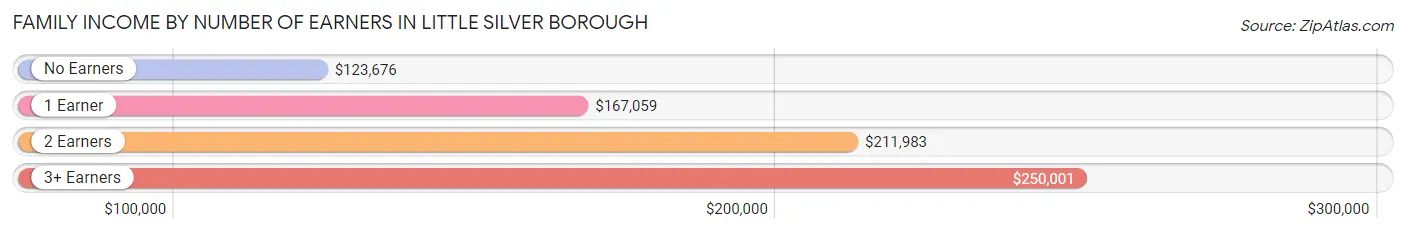
Family Income by Number of Earners in Little Silver borough
The median family income in Little Silver borough is $229,393, with families comprising 3+ earners (289) having the highest median family income of $250,001, while families with no earners (106) have the lowest median family income of $123,676, accounting for 16.1% and 5.9% of families, respectively.
| Number of Earners | # Families | Median Income |
| No Earners | 106 (5.9%) | $123,676 |
| 1 Earner | 568 (31.5%) | $167,059 |
| 2 Earners | 838 (46.5%) | $211,983 |
| 3+ Earners | 289 (16.1%) | $250,001 |
| Total | 1,801 (100.0%) | $229,393 |
Household Income in Little Silver borough
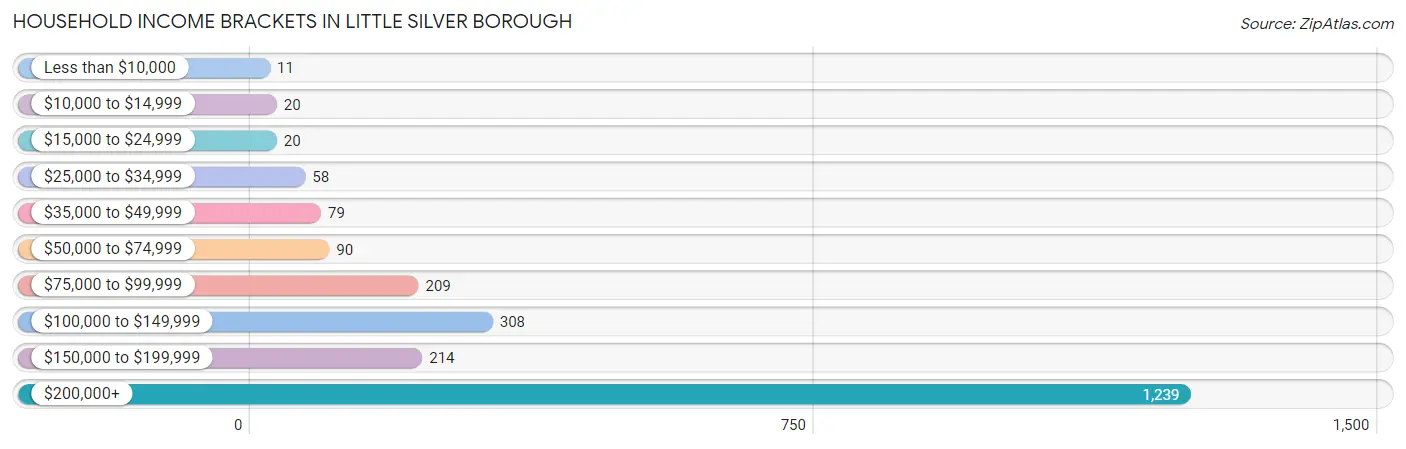
Household Income Brackets in Little Silver borough
With 1,239 households falling in the category, the $200,000+ income range is the most frequent in Little Silver borough, accounting for 55.1% of all households. In contrast, only 11 households (0.5%) fall into the less than $10,000 income bracket, making it the least populous group.
| Income Bracket | # Households | % Households |
| Less than $10,000 | 11 | 0.5% |
| $10,000 to $14,999 | 20 | 0.9% |
| $15,000 to $24,999 | 20 | 0.9% |
| $25,000 to $34,999 | 58 | 2.6% |
| $35,000 to $49,999 | 79 | 3.5% |
| $50,000 to $74,999 | 90 | 4.0% |
| $75,000 to $99,999 | 209 | 9.3% |
| $100,000 to $149,999 | 308 | 13.7% |
| $150,000 to $199,999 | 214 | 9.5% |
| $200,000+ | 1,239 | 55.1% |
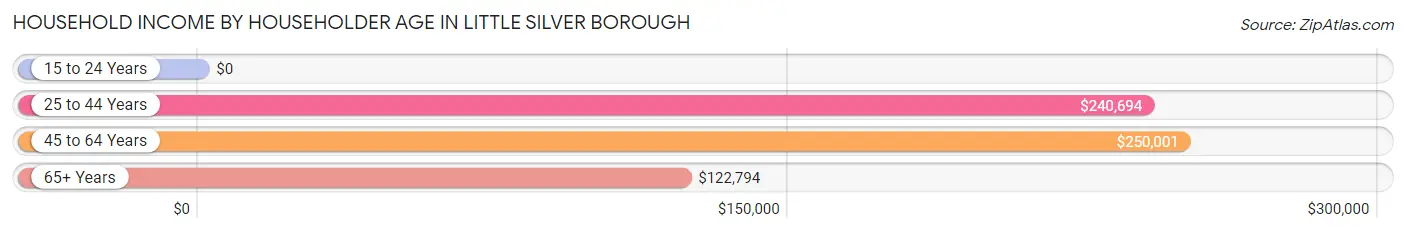
Household Income by Householder Age in Little Silver borough
The median household income in Little Silver borough is $216,974, with the highest median household income of $250,001 found in the 45 to 64 years age bracket for the primary householder. A total of 1,100 households (48.9%) fall into this category.
| Income Bracket | # Households | Median Income |
| 15 to 24 Years | 0 (0.0%) | $0 |
| 25 to 44 Years | 438 (19.5%) | $240,694 |
| 45 to 64 Years | 1,100 (48.9%) | $250,001 |
| 65+ Years | 710 (31.6%) | $122,794 |
| Total | 2,248 (100.0%) | $216,974 |
Poverty in Little Silver borough
Income Below Poverty by Sex and Age in Little Silver borough
With 0.5% poverty level for males and 1.9% for females among the residents of Little Silver borough, 18 to 24 year old males and 75 year old and over females are the most vulnerable to poverty, with 15 males (6.9%) and 21 females (7.1%) in their respective age groups living below the poverty level.
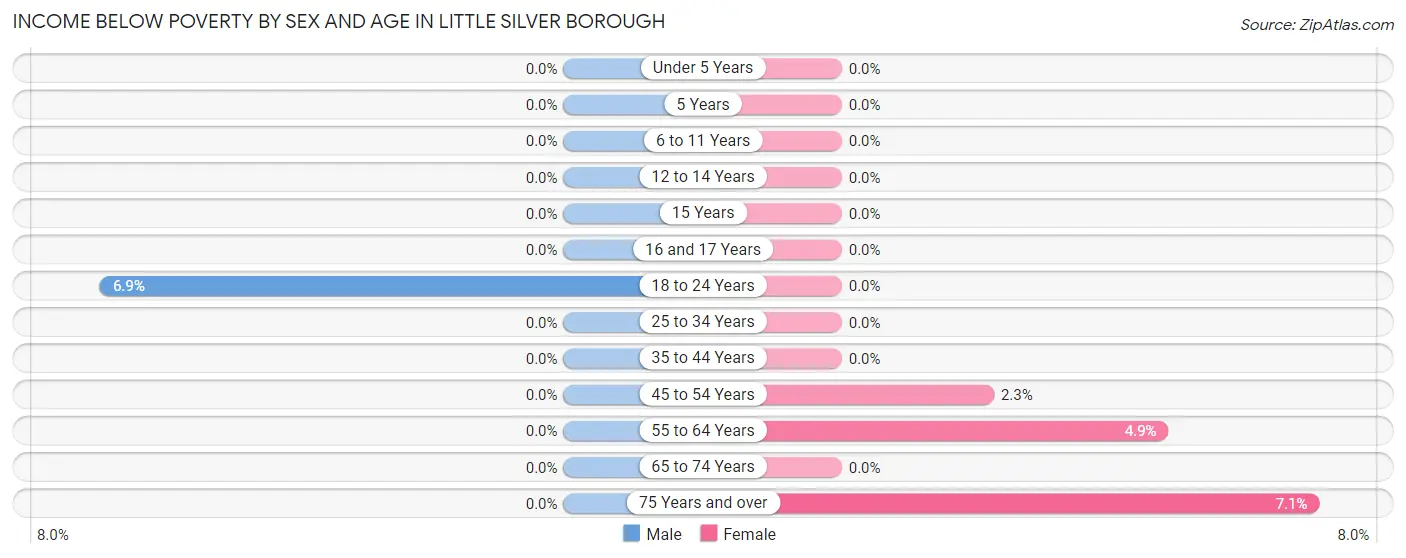
| Age Bracket | Male | Female |
| Under 5 Years | 0 (0.0%) | 0 (0.0%) |
| 5 Years | 0 (0.0%) | 0 (0.0%) |
| 6 to 11 Years | 0 (0.0%) | 0 (0.0%) |
| 12 to 14 Years | 0 (0.0%) | 0 (0.0%) |
| 15 Years | 0 (0.0%) | 0 (0.0%) |
| 16 and 17 Years | 0 (0.0%) | 0 (0.0%) |
| 18 to 24 Years | 15 (6.9%) | 0 (0.0%) |
| 25 to 34 Years | 0 (0.0%) | 0 (0.0%) |
| 35 to 44 Years | 0 (0.0%) | 0 (0.0%) |
| 45 to 54 Years | 0 (0.0%) | 12 (2.3%) |
| 55 to 64 Years | 0 (0.0%) | 24 (4.9%) |
| 65 to 74 Years | 0 (0.0%) | 0 (0.0%) |
| 75 Years and over | 0 (0.0%) | 21 (7.1%) |
| Total | 15 (0.5%) | 57 (1.9%) |
Income Above Poverty by Sex and Age in Little Silver borough
According to the poverty statistics in Little Silver borough, males aged under 5 years and females aged under 5 years are the age groups that are most secure financially, with 100.0% of males and 100.0% of females in these age groups living above the poverty line.
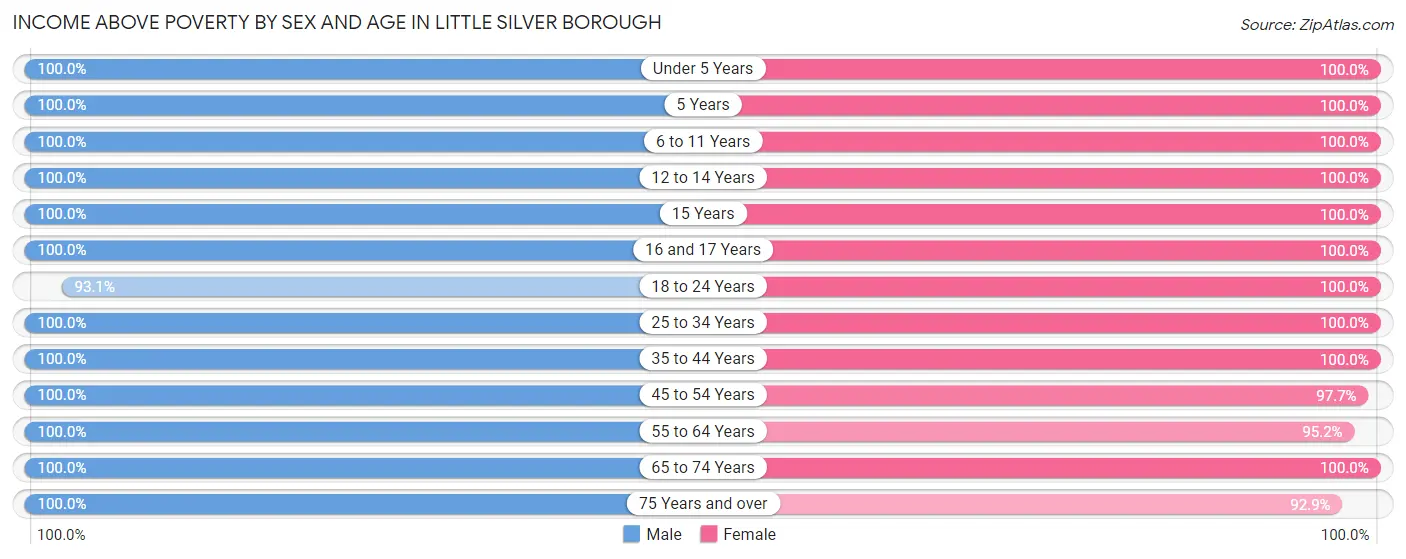
| Age Bracket | Male | Female |
| Under 5 Years | 237 (100.0%) | 140 (100.0%) |
| 5 Years | 32 (100.0%) | 41 (100.0%) |
| 6 to 11 Years | 324 (100.0%) | 202 (100.0%) |
| 12 to 14 Years | 97 (100.0%) | 152 (100.0%) |
| 15 Years | 56 (100.0%) | 32 (100.0%) |
| 16 and 17 Years | 93 (100.0%) | 37 (100.0%) |
| 18 to 24 Years | 203 (93.1%) | 161 (100.0%) |
| 25 to 34 Years | 274 (100.0%) | 218 (100.0%) |
| 35 to 44 Years | 286 (100.0%) | 339 (100.0%) |
| 45 to 54 Years | 502 (100.0%) | 518 (97.7%) |
| 55 to 64 Years | 548 (100.0%) | 471 (95.2%) |
| 65 to 74 Years | 259 (100.0%) | 330 (100.0%) |
| 75 Years and over | 205 (100.0%) | 275 (92.9%) |
| Total | 3,116 (99.5%) | 2,916 (98.1%) |
Income Below Poverty Among Married-Couple Families in Little Silver borough
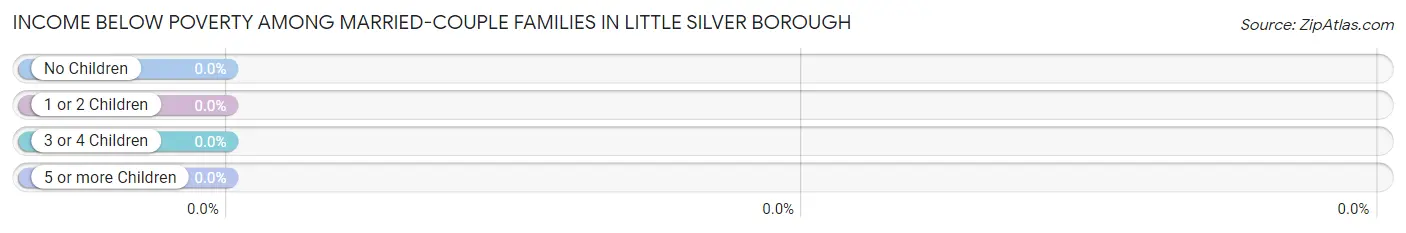
| Children | Above Poverty | Below Poverty |
| No Children | 873 (100.0%) | 0 (0.0%) |
| 1 or 2 Children | 651 (100.0%) | 0 (0.0%) |
| 3 or 4 Children | 104 (100.0%) | 0 (0.0%) |
| 5 or more Children | 0 (0.0%) | 0 (0.0%) |
| Total | 1,628 (100.0%) | 0 (0.0%) |
Income Below Poverty Among Single-Parent Households in Little Silver borough
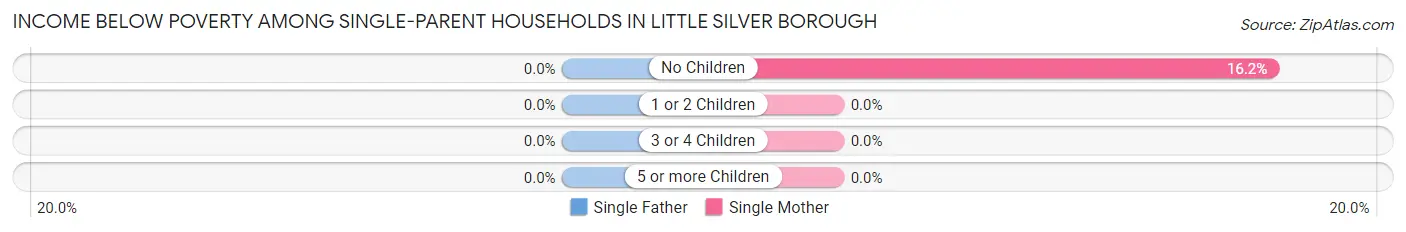
| Children | Single Father | Single Mother |
| No Children | 0 (0.0%) | 12 (16.2%) |
| 1 or 2 Children | 0 (0.0%) | 0 (0.0%) |
| 3 or 4 Children | 0 (0.0%) | 0 (0.0%) |
| 5 or more Children | 0 (0.0%) | 0 (0.0%) |
| Total | 0 (0.0%) | 12 (9.6%) |
Income Below Poverty Among Married-Couple vs Single-Parent Households in Little Silver borough
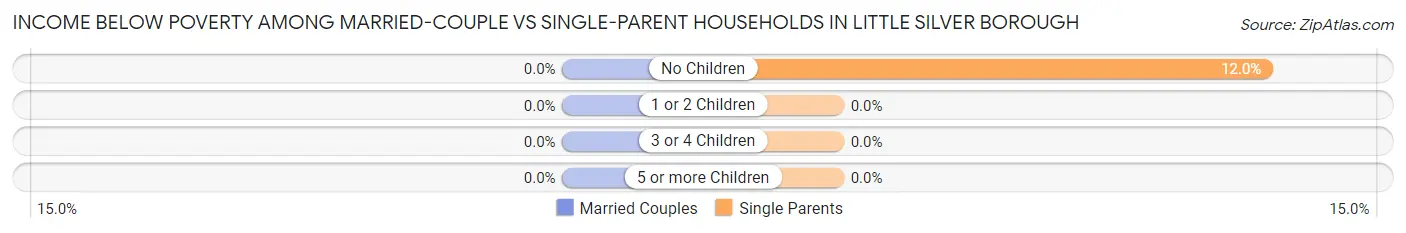
| Children | Married-Couple Families | Single-Parent Households |
| No Children | 0 (0.0%) | 12 (12.0%) |
| 1 or 2 Children | 0 (0.0%) | 0 (0.0%) |
| 3 or 4 Children | 0 (0.0%) | 0 (0.0%) |
| 5 or more Children | 0 (0.0%) | 0 (0.0%) |
| Total | 0 (0.0%) | 12 (6.9%) |
Race in Little Silver borough
The most populous races in Little Silver borough are White / Caucasian (6,075 | 99.5%), Hispanic or Latino (53 | 0.9%), and Hawaiian / Pacific (29 | 0.5%).
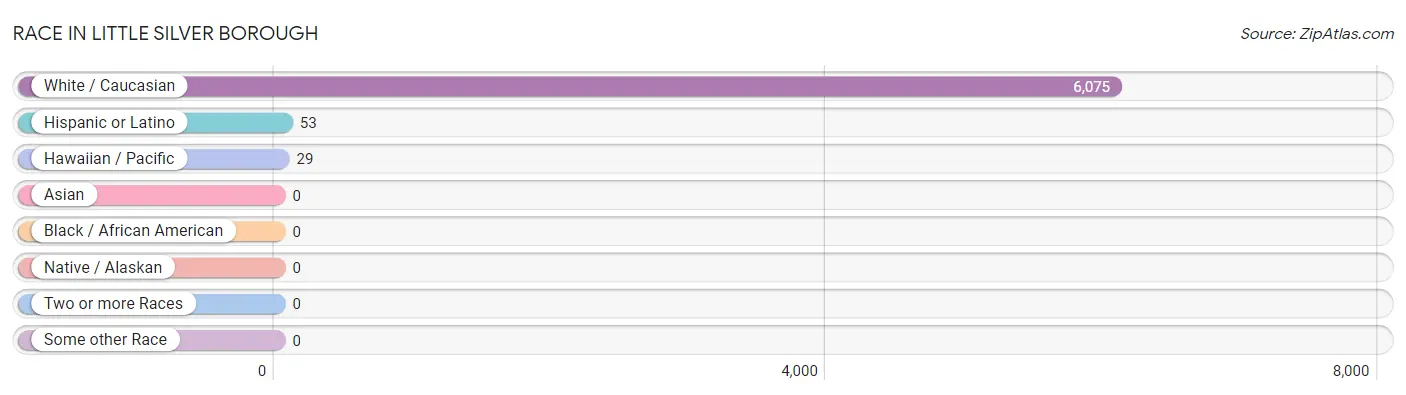
| Race | # Population | % Population |
| Asian | 0 | 0.0% |
| Black / African American | 0 | 0.0% |
| Hawaiian / Pacific | 29 | 0.5% |
| Hispanic or Latino | 53 | 0.9% |
| Native / Alaskan | 0 | 0.0% |
| White / Caucasian | 6,075 | 99.5% |
| Two or more Races | 0 | 0.0% |
| Some other Race | 0 | 0.0% |
| Total | 6,104 | 100.0% |
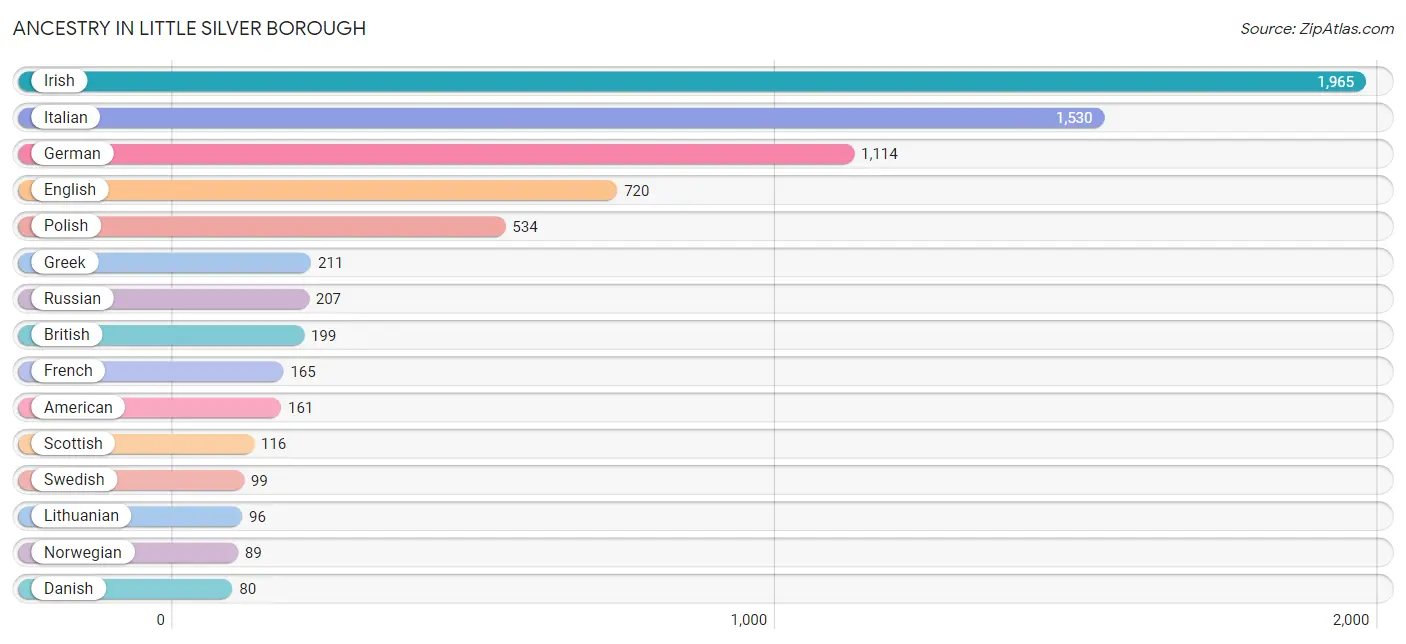
Ancestry in Little Silver borough
The most populous ancestries reported in Little Silver borough are Irish (1,965 | 32.2%), Italian (1,530 | 25.1%), German (1,114 | 18.2%), English (720 | 11.8%), and Polish (534 | 8.7%), together accounting for 96.1% of all Little Silver borough residents.
| Ancestry | # Population | % Population |
| Alsatian | 34 | 0.6% |
| American | 161 | 2.6% |
| Armenian | 10 | 0.2% |
| British | 199 | 3.3% |
| Croatian | 11 | 0.2% |
| Czech | 16 | 0.3% |
| Danish | 80 | 1.3% |
| Dutch | 38 | 0.6% |
| Eastern European | 69 | 1.1% |
| English | 720 | 11.8% |
| European | 26 | 0.4% |
| French | 165 | 2.7% |
| German | 1,114 | 18.2% |
| Greek | 211 | 3.5% |
| Guamanian / Chamorro | 29 | 0.5% |
| Hungarian | 28 | 0.5% |
| Irish | 1,965 | 32.2% |
| Italian | 1,530 | 25.1% |
| Lithuanian | 96 | 1.6% |
| Maltese | 17 | 0.3% |
| Mexican | 35 | 0.6% |
| Norwegian | 89 | 1.5% |
| Polish | 534 | 8.7% |
| Portuguese | 14 | 0.2% |
| Puerto Rican | 18 | 0.3% |
| Romanian | 37 | 0.6% |
| Russian | 207 | 3.4% |
| Scotch-Irish | 63 | 1.0% |
| Scottish | 116 | 1.9% |
| Swedish | 99 | 1.6% |
| Swiss | 63 | 1.0% |
| Ukrainian | 34 | 0.6% |
| Welsh | 28 | 0.5% | View All 33 Rows |
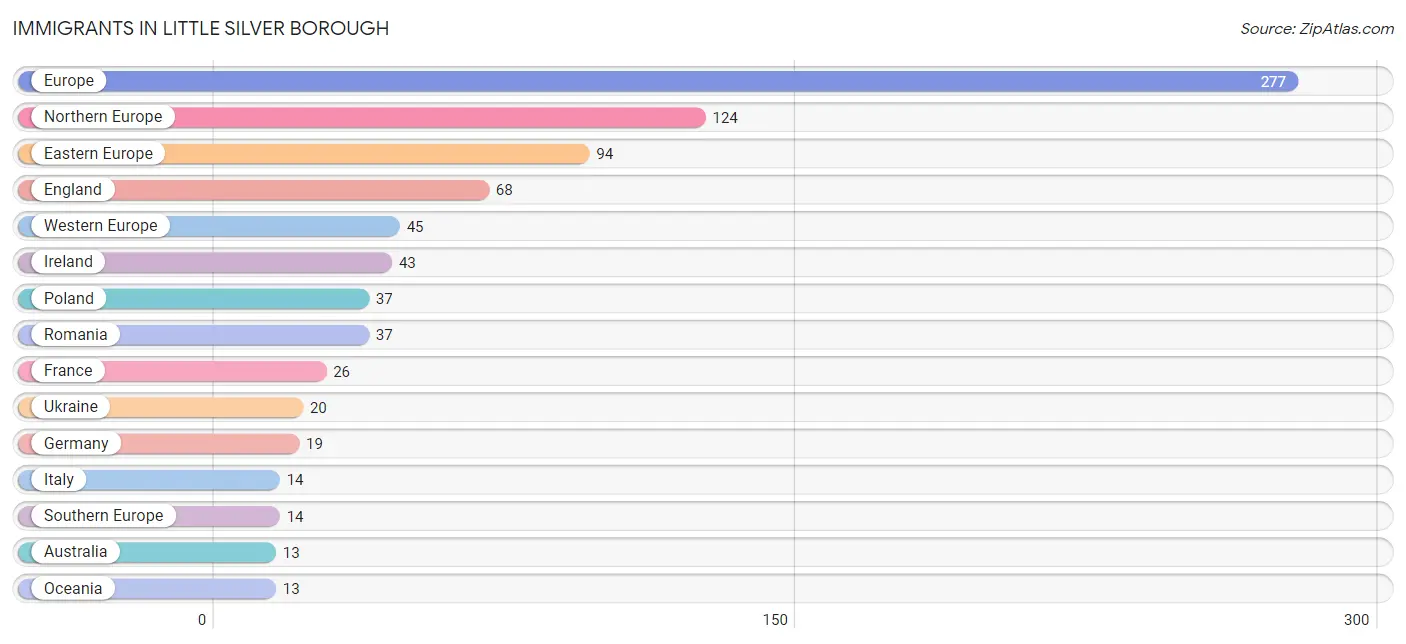
Immigrants in Little Silver borough
The most numerous immigrant groups reported in Little Silver borough came from Europe (277 | 4.5%), Northern Europe (124 | 2.0%), Eastern Europe (94 | 1.5%), England (68 | 1.1%), and Western Europe (45 | 0.7%), together accounting for 10.0% of all Little Silver borough residents.
| Immigration Origin | # Population | % Population |
| Australia | 13 | 0.2% |
| Eastern Europe | 94 | 1.5% |
| England | 68 | 1.1% |
| Europe | 277 | 4.5% |
| France | 26 | 0.4% |
| Germany | 19 | 0.3% |
| Ireland | 43 | 0.7% |
| Italy | 14 | 0.2% |
| Northern Europe | 124 | 2.0% |
| Oceania | 13 | 0.2% |
| Poland | 37 | 0.6% |
| Romania | 37 | 0.6% |
| Southern Europe | 14 | 0.2% |
| Ukraine | 20 | 0.3% |
| Western Europe | 45 | 0.7% | View All 15 Rows |
Sex and Age in Little Silver borough
Sex and Age in Little Silver borough
The most populous age groups in Little Silver borough are 60 to 64 Years (368 | 11.7%) for men and 60 to 64 Years (423 | 14.2%) for women.
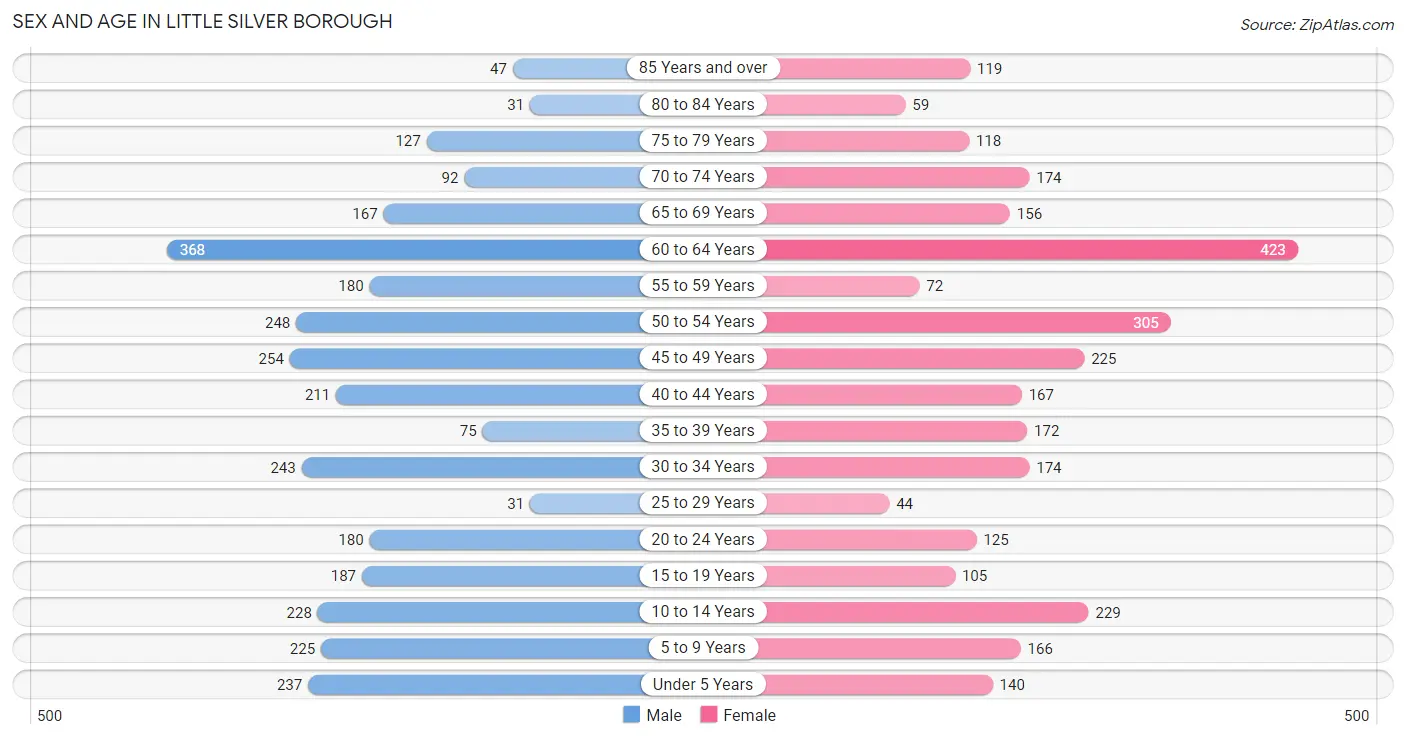
| Age Bracket | Male | Female |
| Under 5 Years | 237 (7.6%) | 140 (4.7%) |
| 5 to 9 Years | 225 (7.2%) | 166 (5.6%) |
| 10 to 14 Years | 228 (7.3%) | 229 (7.7%) |
| 15 to 19 Years | 187 (6.0%) | 105 (3.5%) |
| 20 to 24 Years | 180 (5.8%) | 125 (4.2%) |
| 25 to 29 Years | 31 (1.0%) | 44 (1.5%) |
| 30 to 34 Years | 243 (7.8%) | 174 (5.9%) |
| 35 to 39 Years | 75 (2.4%) | 172 (5.8%) |
| 40 to 44 Years | 211 (6.7%) | 167 (5.6%) |
| 45 to 49 Years | 254 (8.1%) | 225 (7.6%) |
| 50 to 54 Years | 248 (7.9%) | 305 (10.3%) |
| 55 to 59 Years | 180 (5.8%) | 72 (2.4%) |
| 60 to 64 Years | 368 (11.7%) | 423 (14.2%) |
| 65 to 69 Years | 167 (5.3%) | 156 (5.2%) |
| 70 to 74 Years | 92 (2.9%) | 174 (5.9%) |
| 75 to 79 Years | 127 (4.1%) | 118 (4.0%) |
| 80 to 84 Years | 31 (1.0%) | 59 (2.0%) |
| 85 Years and over | 47 (1.5%) | 119 (4.0%) |
| Total | 3,131 (100.0%) | 2,973 (100.0%) |
Families and Households in Little Silver borough
Median Family Size in Little Silver borough
The median family size in Little Silver borough is 3.02 persons per family, with married-couple families (1,628 | 90.4%) accounting for the largest median family size of 3.08 persons per family. On the other hand, single female/mother families (125 | 6.9%) represent the smallest median family size with 2.48 persons per family.
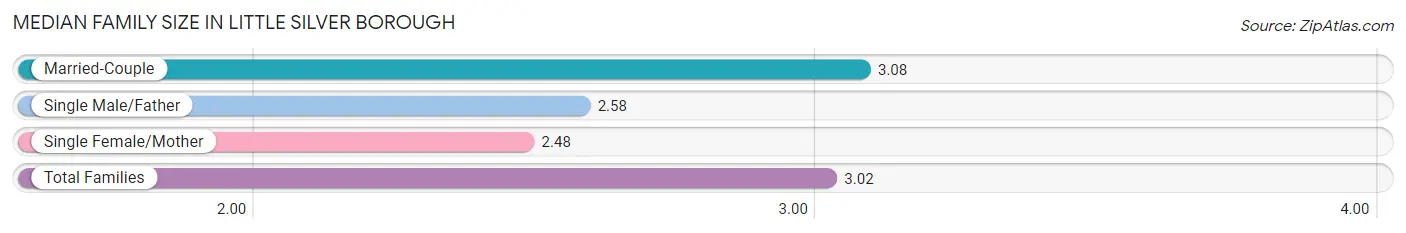
| Family Type | # Families | Family Size |
| Married-Couple | 1,628 (90.4%) | 3.08 |
| Single Male/Father | 48 (2.7%) | 2.58 |
| Single Female/Mother | 125 (6.9%) | 2.48 |
| Total Families | 1,801 (100.0%) | 3.02 |
Median Household Size in Little Silver borough
The median household size in Little Silver borough is 2.72 persons per household, with single male/father households (48 | 2.1%) accounting for the largest median household size of 3.54 persons per household. non-family households (447 | 19.9%) represent the smallest median household size with 1.32 persons per household.
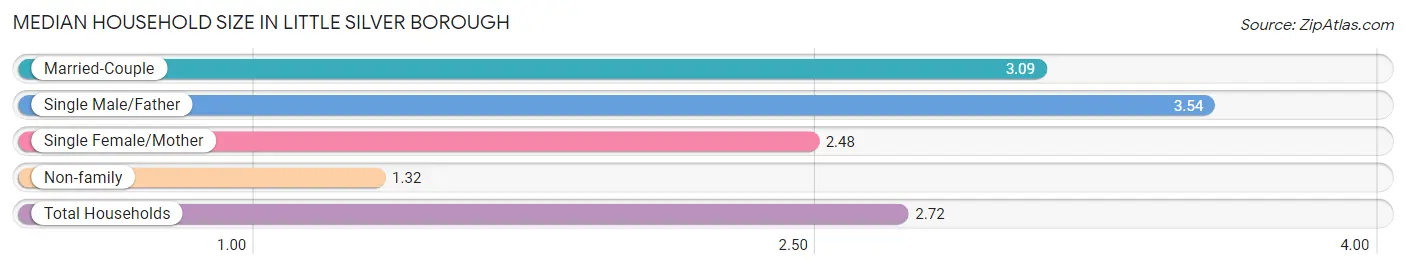
| Household Type | # Households | Household Size |
| Married-Couple | 1,628 (72.4%) | 3.09 |
| Single Male/Father | 48 (2.1%) | 3.54 |
| Single Female/Mother | 125 (5.6%) | 2.48 |
| Non-family | 447 (19.9%) | 1.32 |
| Total Households | 2,248 (100.0%) | 2.72 |
Household Size by Marriage Status in Little Silver borough
Out of a total of 2,248 households in Little Silver borough, 1,801 (80.1%) are family households, while 447 (19.9%) are nonfamily households. The most numerous type of family households are 2-person households, comprising 657, and the most common type of nonfamily households are 1-person households, comprising 300.
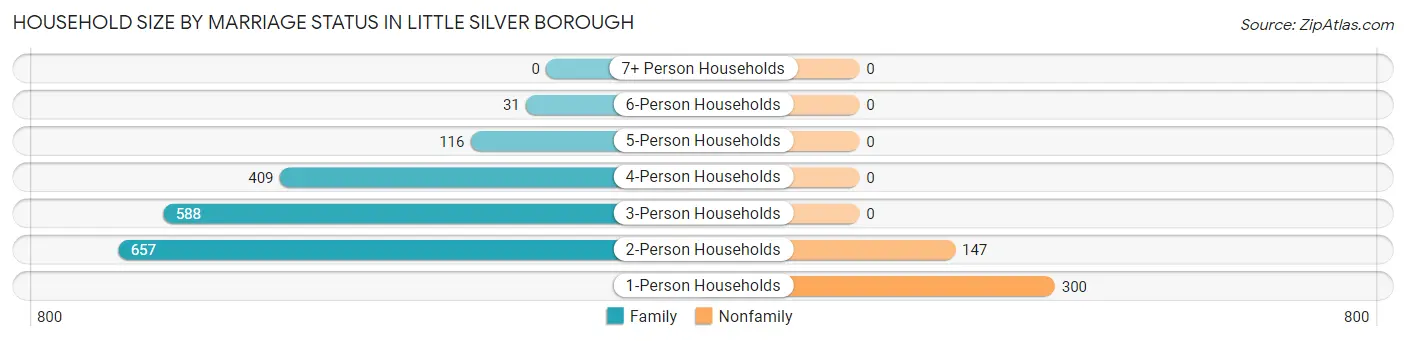
| Household Size | Family Households | Nonfamily Households |
| 1-Person Households | - | 300 (13.4%) |
| 2-Person Households | 657 (29.2%) | 147 (6.5%) |
| 3-Person Households | 588 (26.2%) | 0 (0.0%) |
| 4-Person Households | 409 (18.2%) | 0 (0.0%) |
| 5-Person Households | 116 (5.2%) | 0 (0.0%) |
| 6-Person Households | 31 (1.4%) | 0 (0.0%) |
| 7+ Person Households | 0 (0.0%) | 0 (0.0%) |
| Total | 1,801 (80.1%) | 447 (19.9%) |
Female Fertility in Little Silver borough
Fertility by Age in Little Silver borough
Average fertility rate in Little Silver borough is 58.0 births per 1,000 women. Women in the age bracket of 35 to 50 years have the highest fertility rate with 75.0 births per 1,000 women. Women in the age bracket of 35 to 50 years acount for 73.8% of all women with births.
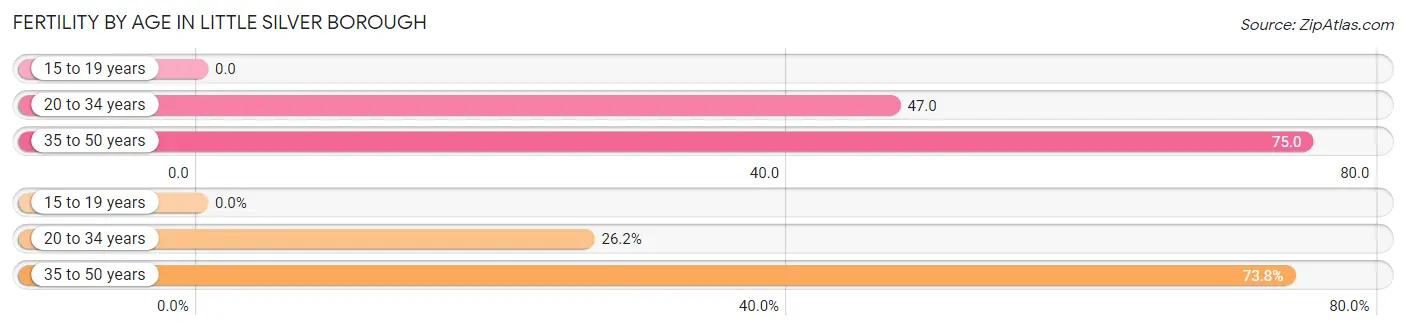
| Age Bracket | Women with Births | Births / 1,000 Women |
| 15 to 19 years | 0 (0.0%) | 0.0 |
| 20 to 34 years | 16 (26.2%) | 47.0 |
| 35 to 50 years | 45 (73.8%) | 75.0 |
| Total | 61 (100.0%) | 58.0 |
Fertility by Age by Marriage Status in Little Silver borough
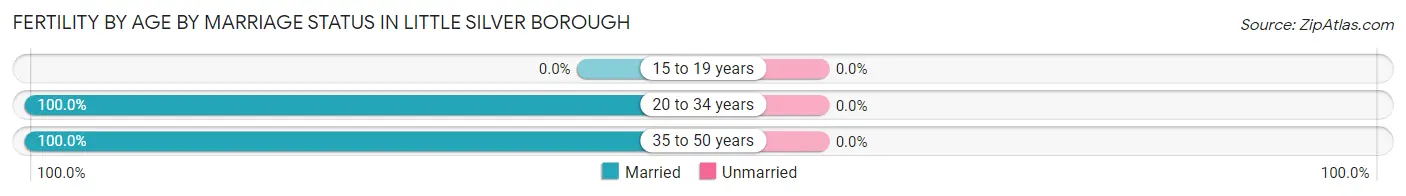
| Age Bracket | Married | Unmarried |
| 15 to 19 years | 0 (0.0%) | 0 (0.0%) |
| 20 to 34 years | 16 (100.0%) | 0 (0.0%) |
| 35 to 50 years | 45 (100.0%) | 0 (0.0%) |
| Total | 61 (100.0%) | 0 (0.0%) |
Fertility by Education in Little Silver borough
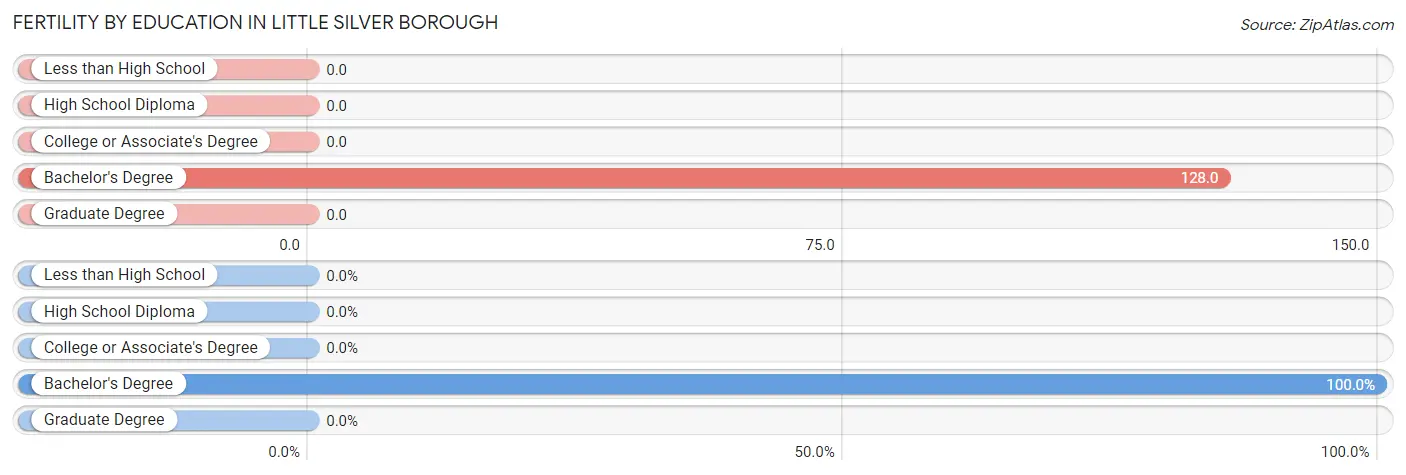
| Educational Attainment | Women with Births | Births / 1,000 Women |
| Less than High School | 0 (0.0%) | 0.0 |
| High School Diploma | 0 (0.0%) | 0.0 |
| College or Associate's Degree | 0 (0.0%) | 0.0 |
| Bachelor's Degree | 61 (100.0%) | 128.0 |
| Graduate Degree | 0 (0.0%) | 0.0 |
| Total | 61 (100.0%) | 58.0 |
Fertility by Education by Marriage Status in Little Silver borough
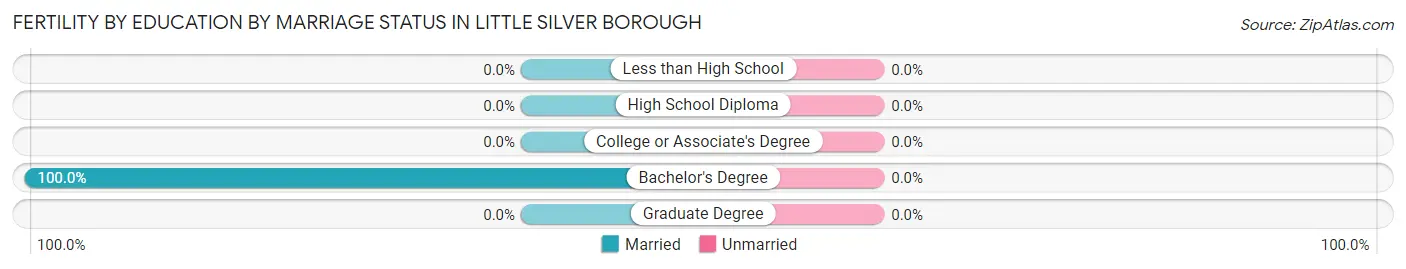
| Educational Attainment | Married | Unmarried |
| Less than High School | 0 (0.0%) | 0 (0.0%) |
| High School Diploma | 0 (0.0%) | 0 (0.0%) |
| College or Associate's Degree | 0 (0.0%) | 0 (0.0%) |
| Bachelor's Degree | 61 (100.0%) | 0 (0.0%) |
| Graduate Degree | 0 (0.0%) | 0 (0.0%) |
| Total | 61 (100.0%) | 0 (0.0%) |
Employment Characteristics in Little Silver borough
Employment by Class of Employer in Little Silver borough
Among the 3,165 employed individuals in Little Silver borough, private company employees (2,196 | 69.4%), self-employed (not incorporated) (275 | 8.7%), and self-employed (incorporated) (250 | 7.9%) make up the most common classes of employment.
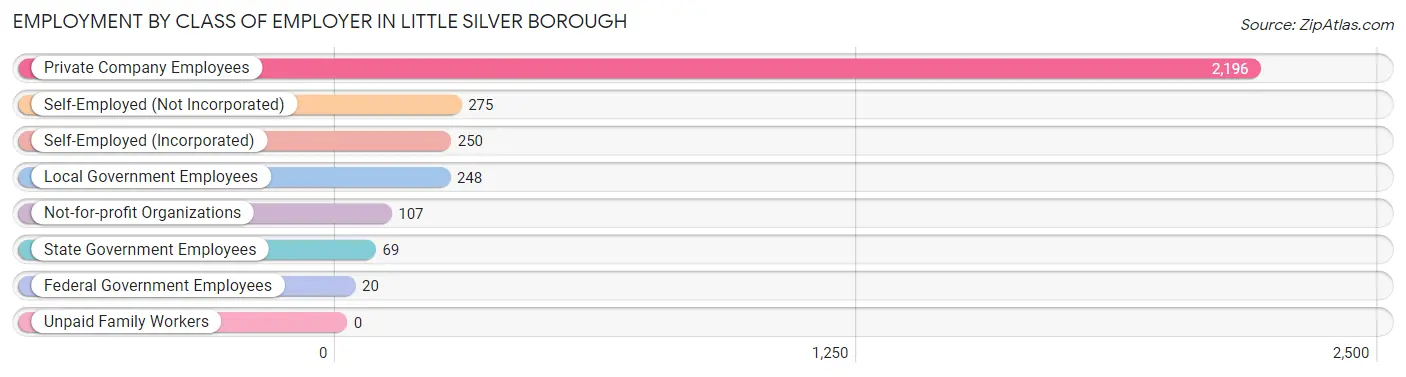
| Employer Class | # Employees | % Employees |
| Private Company Employees | 2,196 | 69.4% |
| Self-Employed (Incorporated) | 250 | 7.9% |
| Self-Employed (Not Incorporated) | 275 | 8.7% |
| Not-for-profit Organizations | 107 | 3.4% |
| Local Government Employees | 248 | 7.8% |
| State Government Employees | 69 | 2.2% |
| Federal Government Employees | 20 | 0.6% |
| Unpaid Family Workers | 0 | 0.0% |
| Total | 3,165 | 100.0% |
Employment Status by Age in Little Silver borough
According to the labor force statistics for Little Silver borough, out of the total population over 16 years of age (4,791), 69.7% or 3,339 individuals are in the labor force, with 3.3% or 110 of them unemployed. The age group with the highest labor force participation rate is 25 to 29 years, with 100.0% or 75 individuals in the labor force. Within the labor force, the 25 to 29 years age range has the highest percentage of unemployed individuals, with 24.0% or 18 of them being unemployed.
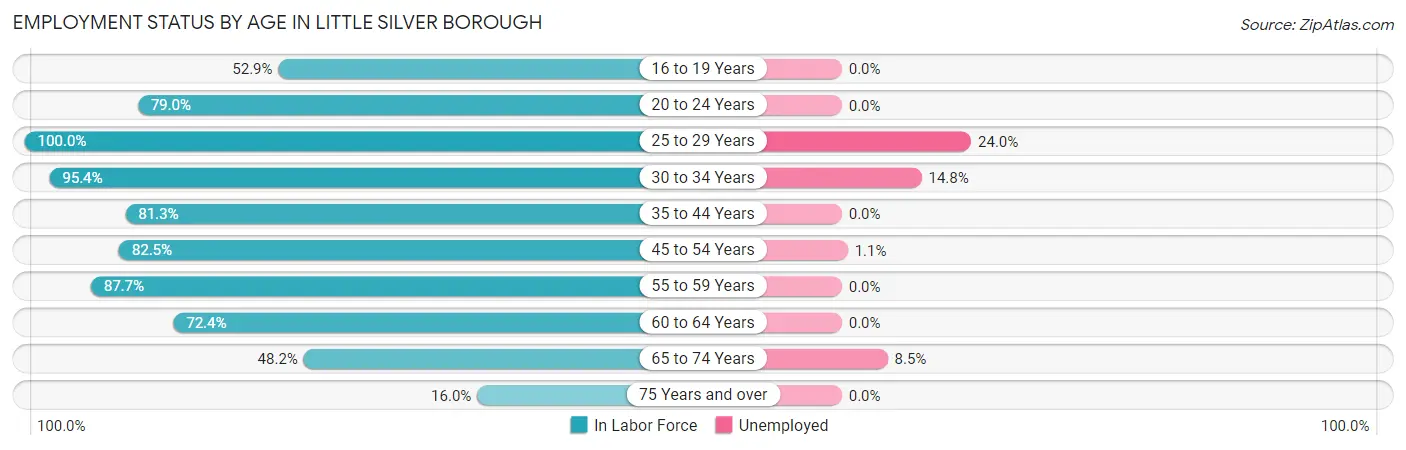
| Age Bracket | In Labor Force | Unemployed |
| 16 to 19 Years | 108 (52.9%) | 0 (0.0%) |
| 20 to 24 Years | 241 (79.0%) | 0 (0.0%) |
| 25 to 29 Years | 75 (100.0%) | 18 (24.0%) |
| 30 to 34 Years | 398 (95.4%) | 59 (14.8%) |
| 35 to 44 Years | 508 (81.3%) | 0 (0.0%) |
| 45 to 54 Years | 851 (82.5%) | 9 (1.1%) |
| 55 to 59 Years | 221 (87.7%) | 0 (0.0%) |
| 60 to 64 Years | 573 (72.4%) | 0 (0.0%) |
| 65 to 74 Years | 284 (48.2%) | 24 (8.5%) |
| 75 Years and over | 80 (16.0%) | 0 (0.0%) |
| Total | 3,339 (69.7%) | 110 (3.3%) |
Employment Status by Educational Attainment in Little Silver borough
According to labor force statistics for Little Silver borough, 82.3% of individuals (2,627) out of the total population between 25 and 64 years of age (3,192) are in the labor force, with 3.3% or 87 of them being unemployed. The group with the highest labor force participation rate are those with the educational attainment of college / associate degree, with 91.7% or 321 individuals in the labor force. Within the labor force, individuals with bachelor's degree or higher education have the highest percentage of unemployment, with 4.0% or 86 of them being unemployed.
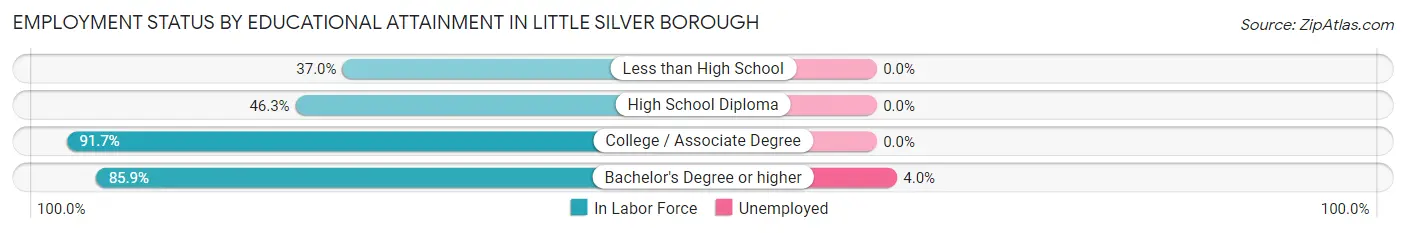
| Educational Attainment | In Labor Force | Unemployed |
| Less than High School | 17 (37.0%) | 0 (0.0%) |
| High School Diploma | 133 (46.3%) | 0 (0.0%) |
| College / Associate Degree | 321 (91.7%) | 0 (0.0%) |
| Bachelor's Degree or higher | 2,155 (85.9%) | 100 (4.0%) |
| Total | 2,627 (82.3%) | 105 (3.3%) |
Employment Occupations by Sex in Little Silver borough
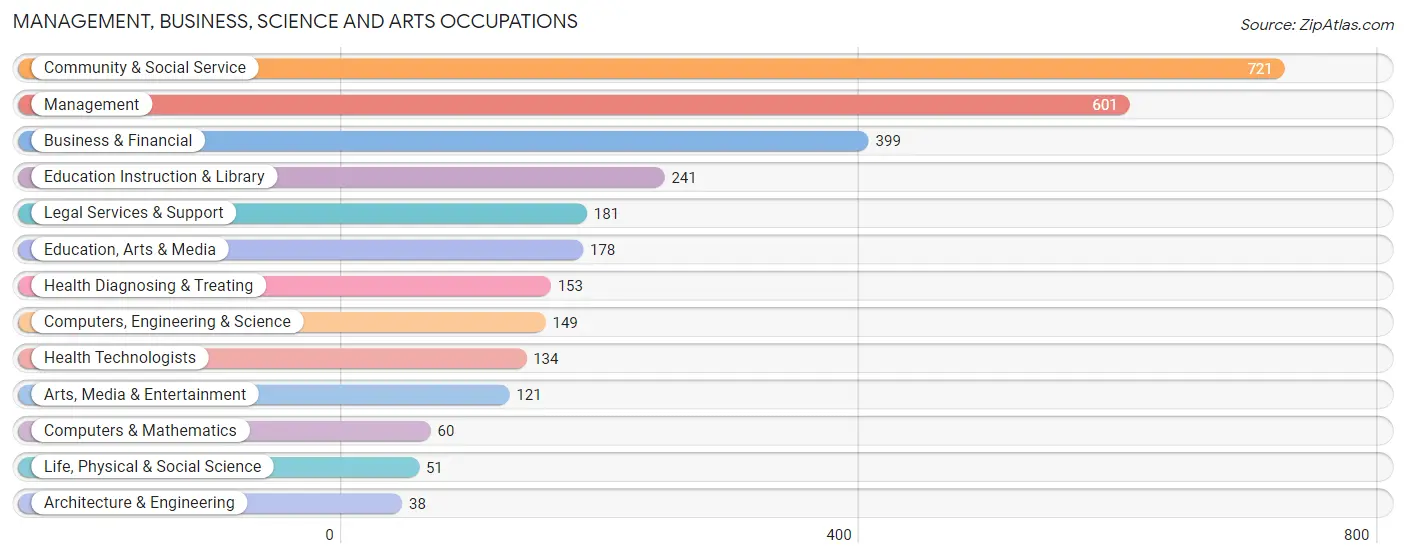
Management, Business, Science and Arts Occupations
The most common Management, Business, Science and Arts occupations in Little Silver borough are Community & Social Service (721 | 22.3%), Management (601 | 18.6%), Business & Financial (399 | 12.4%), Education Instruction & Library (241 | 7.5%), and Legal Services & Support (181 | 5.6%).
Management, Business, Science and Arts Occupations by Sex
Within the Management, Business, Science and Arts occupations in Little Silver borough, the most male-oriented occupations are Life, Physical & Social Science (100.0%), Legal Services & Support (79.0%), and Business & Financial (74.9%), while the most female-oriented occupations are Computers & Mathematics (100.0%), Education, Arts & Media (94.4%), and Education Instruction & Library (90.9%).
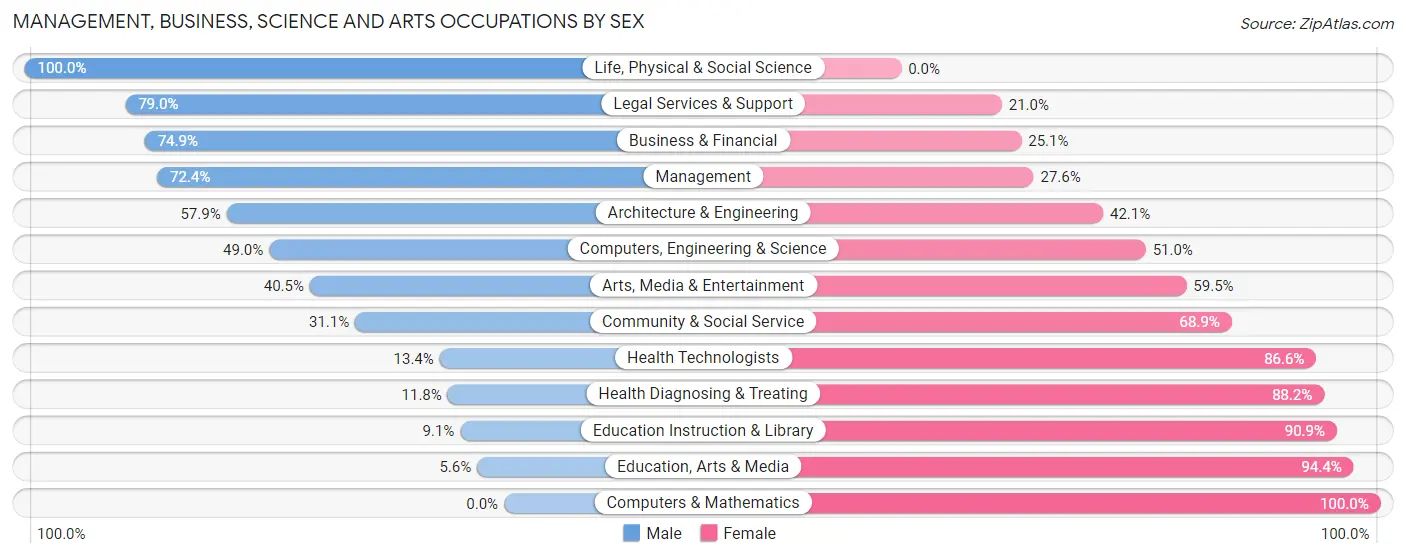
| Occupation | Male | Female |
| Management | 435 (72.4%) | 166 (27.6%) |
| Business & Financial | 299 (74.9%) | 100 (25.1%) |
| Computers, Engineering & Science | 73 (49.0%) | 76 (51.0%) |
| Computers & Mathematics | 0 (0.0%) | 60 (100.0%) |
| Architecture & Engineering | 22 (57.9%) | 16 (42.1%) |
| Life, Physical & Social Science | 51 (100.0%) | 0 (0.0%) |
| Community & Social Service | 224 (31.1%) | 497 (68.9%) |
| Education, Arts & Media | 10 (5.6%) | 168 (94.4%) |
| Legal Services & Support | 143 (79.0%) | 38 (21.0%) |
| Education Instruction & Library | 22 (9.1%) | 219 (90.9%) |
| Arts, Media & Entertainment | 49 (40.5%) | 72 (59.5%) |
| Health Diagnosing & Treating | 18 (11.8%) | 135 (88.2%) |
| Health Technologists | 18 (13.4%) | 116 (86.6%) |
| Total (Category) | 1,049 (51.8%) | 974 (48.1%) |
| Total (Overall) | 1,876 (58.1%) | 1,353 (41.9%) |
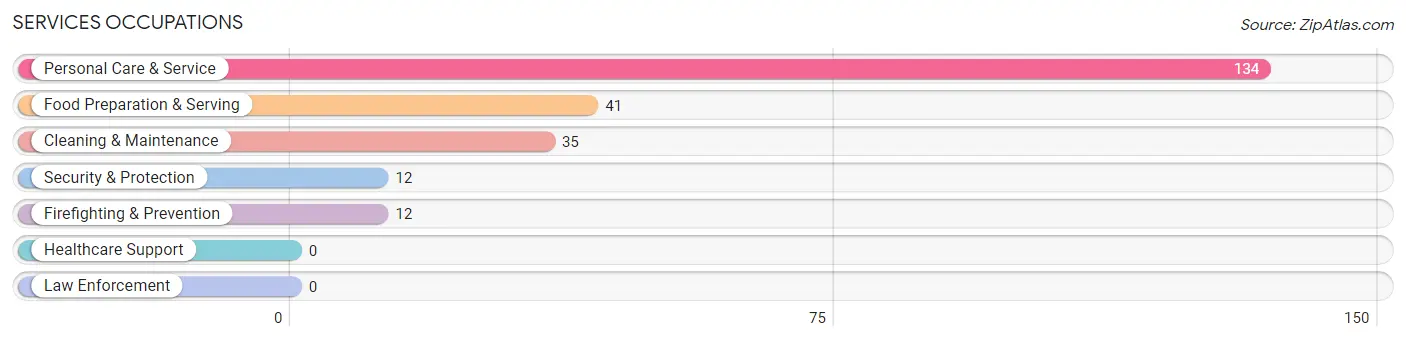
Services Occupations
The most common Services occupations in Little Silver borough are Personal Care & Service (134 | 4.2%), Food Preparation & Serving (41 | 1.3%), Cleaning & Maintenance (35 | 1.1%), Security & Protection (12 | 0.4%), and Firefighting & Prevention (12 | 0.4%).
Services Occupations by Sex
Within the Services occupations in Little Silver borough, the most male-oriented occupations are Security & Protection (100.0%), Firefighting & Prevention (100.0%), and Food Preparation & Serving (100.0%), while the most female-oriented occupations are Cleaning & Maintenance (57.1%), and Personal Care & Service (42.5%).
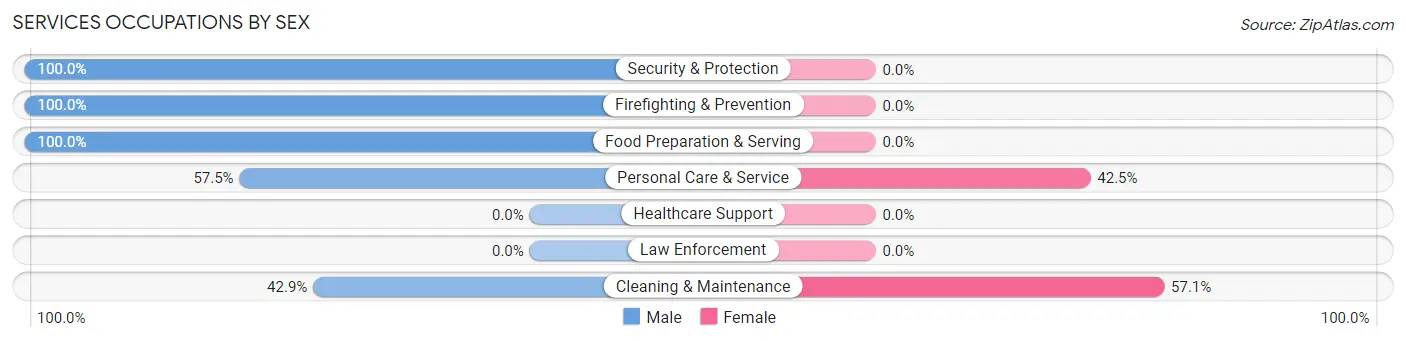
| Occupation | Male | Female |
| Healthcare Support | 0 (0.0%) | 0 (0.0%) |
| Security & Protection | 12 (100.0%) | 0 (0.0%) |
| Firefighting & Prevention | 12 (100.0%) | 0 (0.0%) |
| Law Enforcement | 0 (0.0%) | 0 (0.0%) |
| Food Preparation & Serving | 41 (100.0%) | 0 (0.0%) |
| Cleaning & Maintenance | 15 (42.9%) | 20 (57.1%) |
| Personal Care & Service | 77 (57.5%) | 57 (42.5%) |
| Total (Category) | 145 (65.3%) | 77 (34.7%) |
| Total (Overall) | 1,876 (58.1%) | 1,353 (41.9%) |
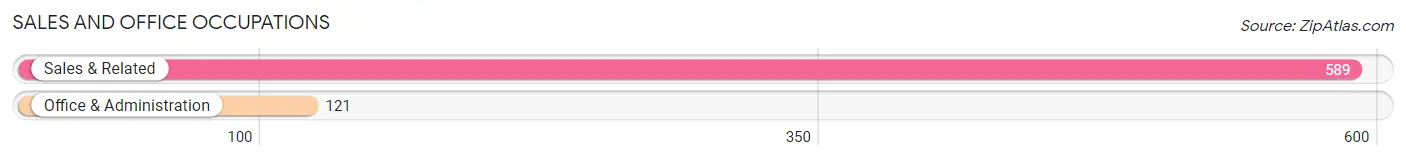
Sales and Office Occupations
The most common Sales and Office occupations in Little Silver borough are Sales & Related (589 | 18.2%), and Office & Administration (121 | 3.7%).
Sales and Office Occupations by Sex
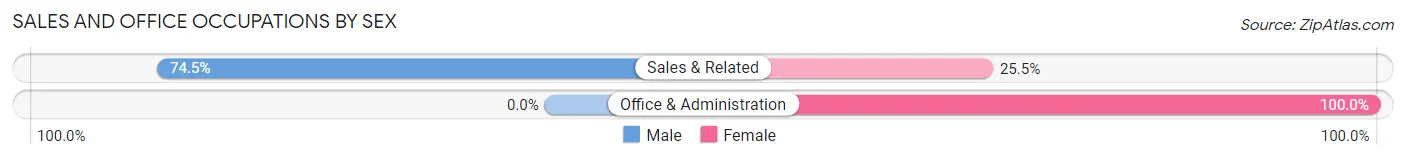
| Occupation | Male | Female |
| Sales & Related | 439 (74.5%) | 150 (25.5%) |
| Office & Administration | 0 (0.0%) | 121 (100.0%) |
| Total (Category) | 439 (61.8%) | 271 (38.2%) |
| Total (Overall) | 1,876 (58.1%) | 1,353 (41.9%) |
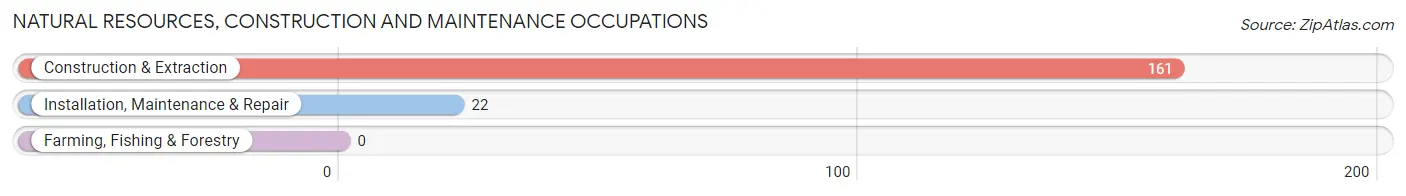
Natural Resources, Construction and Maintenance Occupations
The most common Natural Resources, Construction and Maintenance occupations in Little Silver borough are Construction & Extraction (161 | 5.0%), and Installation, Maintenance & Repair (22 | 0.7%).
Natural Resources, Construction and Maintenance Occupations by Sex
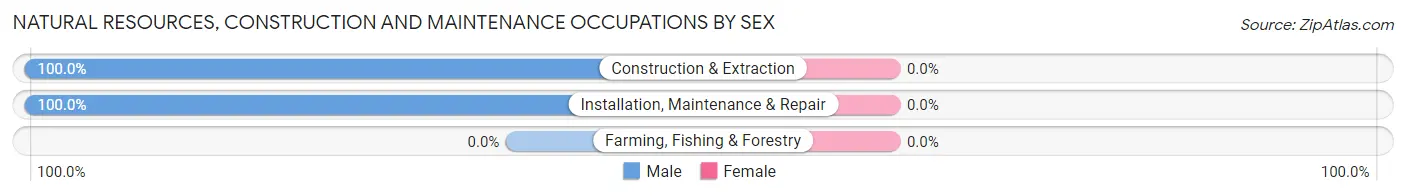
| Occupation | Male | Female |
| Farming, Fishing & Forestry | 0 (0.0%) | 0 (0.0%) |
| Construction & Extraction | 161 (100.0%) | 0 (0.0%) |
| Installation, Maintenance & Repair | 22 (100.0%) | 0 (0.0%) |
| Total (Category) | 183 (100.0%) | 0 (0.0%) |
| Total (Overall) | 1,876 (58.1%) | 1,353 (41.9%) |
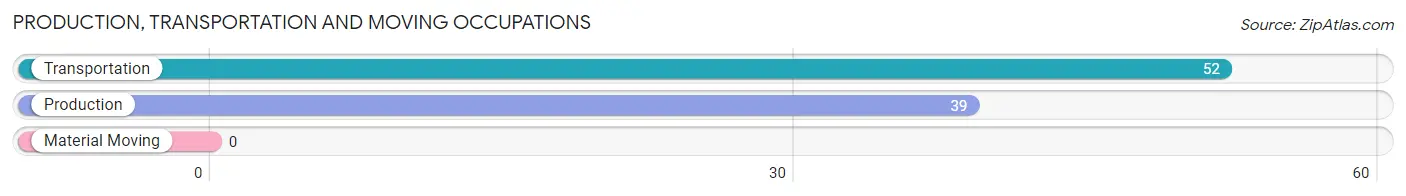
Production, Transportation and Moving Occupations
The most common Production, Transportation and Moving occupations in Little Silver borough are Transportation (52 | 1.6%), and Production (39 | 1.2%).
Production, Transportation and Moving Occupations by Sex
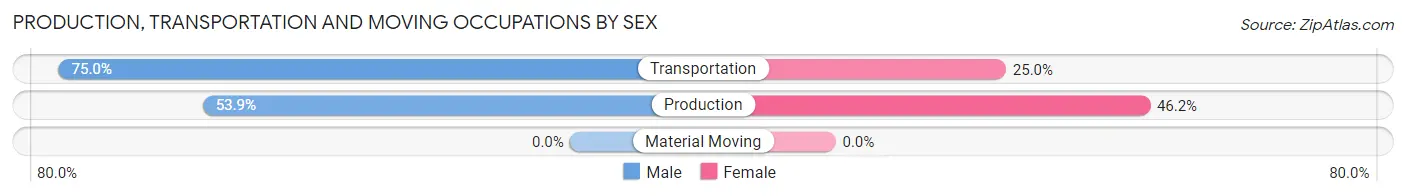
| Occupation | Male | Female |
| Production | 21 (53.8%) | 18 (46.2%) |
| Transportation | 39 (75.0%) | 13 (25.0%) |
| Material Moving | 0 (0.0%) | 0 (0.0%) |
| Total (Category) | 60 (65.9%) | 31 (34.1%) |
| Total (Overall) | 1,876 (58.1%) | 1,353 (41.9%) |
Employment Industries by Sex in Little Silver borough
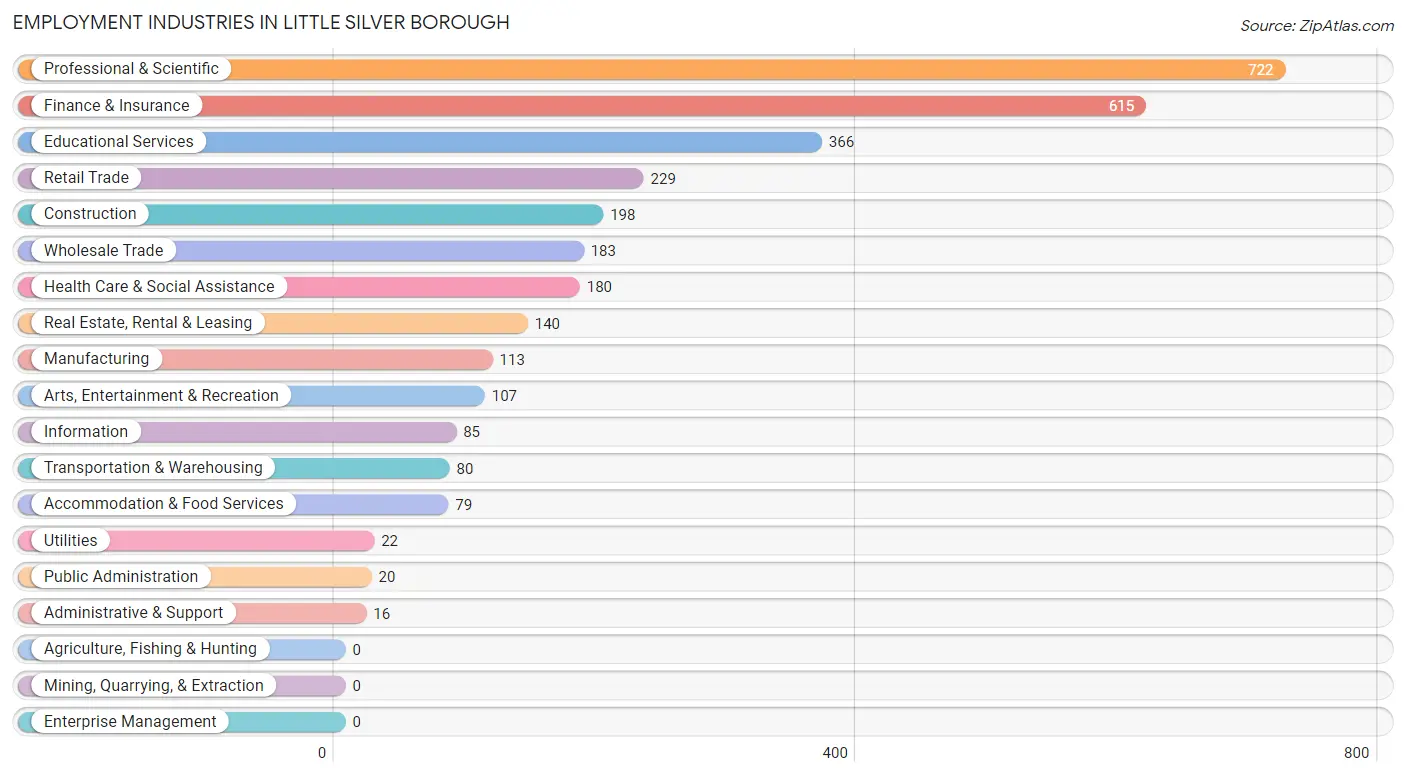
Employment Industries in Little Silver borough
The major employment industries in Little Silver borough include Professional & Scientific (722 | 22.4%), Finance & Insurance (615 | 19.1%), Educational Services (366 | 11.3%), Retail Trade (229 | 7.1%), and Construction (198 | 6.1%).
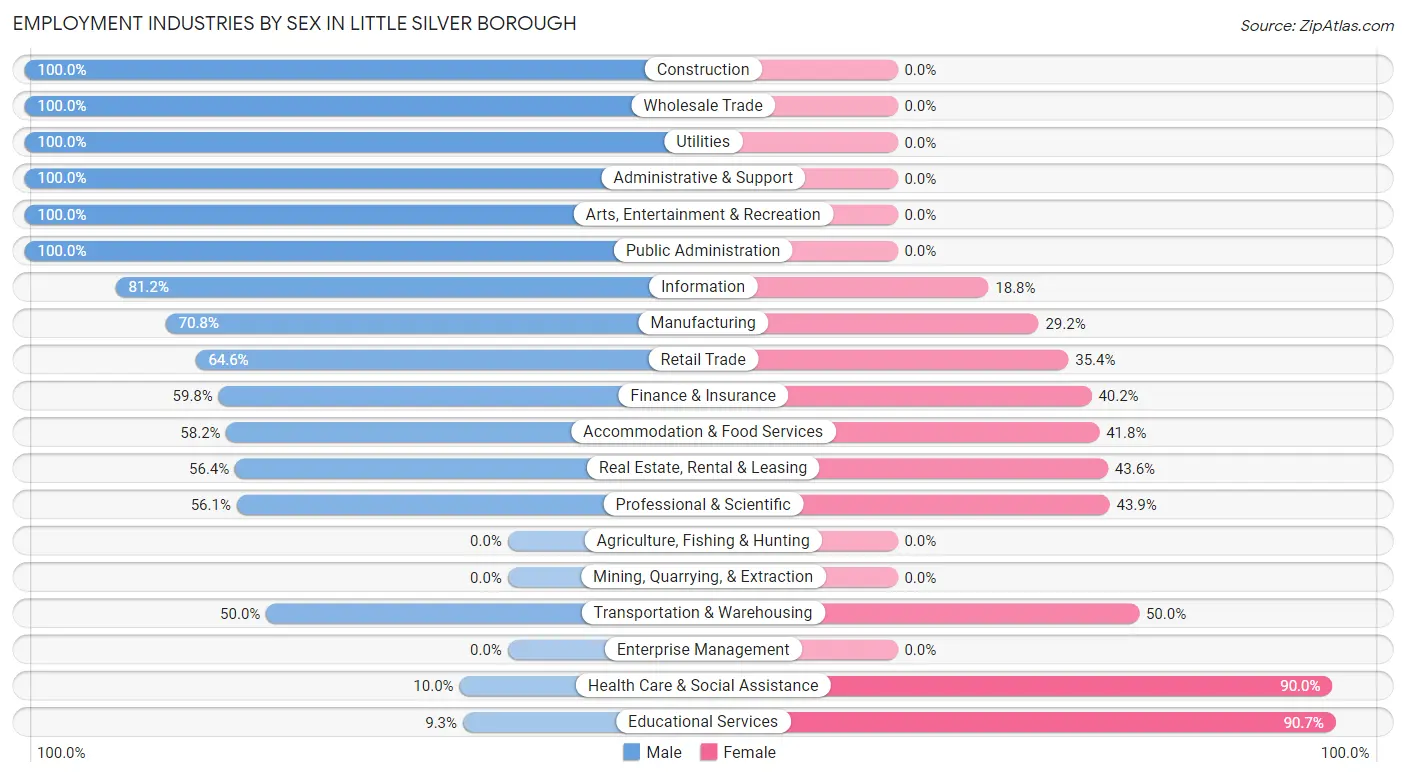
Employment Industries by Sex in Little Silver borough
The Little Silver borough industries that see more men than women are Construction (100.0%), Wholesale Trade (100.0%), and Utilities (100.0%), whereas the industries that tend to have a higher number of women are Educational Services (90.7%), Health Care & Social Assistance (90.0%), and Transportation & Warehousing (50.0%).
| Industry | Male | Female |
| Agriculture, Fishing & Hunting | 0 (0.0%) | 0 (0.0%) |
| Mining, Quarrying, & Extraction | 0 (0.0%) | 0 (0.0%) |
| Construction | 198 (100.0%) | 0 (0.0%) |
| Manufacturing | 80 (70.8%) | 33 (29.2%) |
| Wholesale Trade | 183 (100.0%) | 0 (0.0%) |
| Retail Trade | 148 (64.6%) | 81 (35.4%) |
| Transportation & Warehousing | 40 (50.0%) | 40 (50.0%) |
| Utilities | 22 (100.0%) | 0 (0.0%) |
| Information | 69 (81.2%) | 16 (18.8%) |
| Finance & Insurance | 368 (59.8%) | 247 (40.2%) |
| Real Estate, Rental & Leasing | 79 (56.4%) | 61 (43.6%) |
| Professional & Scientific | 405 (56.1%) | 317 (43.9%) |
| Enterprise Management | 0 (0.0%) | 0 (0.0%) |
| Administrative & Support | 16 (100.0%) | 0 (0.0%) |
| Educational Services | 34 (9.3%) | 332 (90.7%) |
| Health Care & Social Assistance | 18 (10.0%) | 162 (90.0%) |
| Arts, Entertainment & Recreation | 107 (100.0%) | 0 (0.0%) |
| Accommodation & Food Services | 46 (58.2%) | 33 (41.8%) |
| Public Administration | 20 (100.0%) | 0 (0.0%) |
| Total | 1,876 (58.1%) | 1,353 (41.9%) |
Education in Little Silver borough
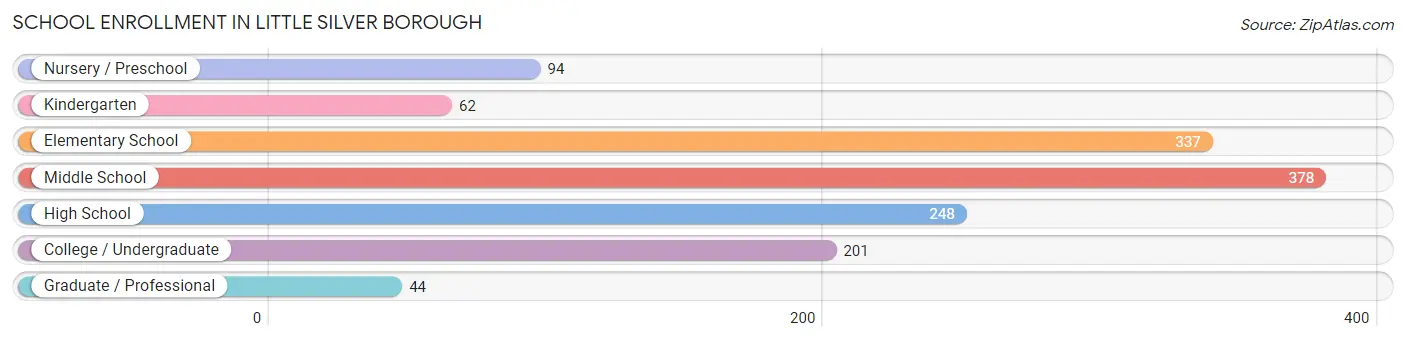
School Enrollment in Little Silver borough
The most common levels of schooling among the 1,364 students in Little Silver borough are middle school (378 | 27.7%), elementary school (337 | 24.7%), and high school (248 | 18.2%).
| School Level | # Students | % Students |
| Nursery / Preschool | 94 | 6.9% |
| Kindergarten | 62 | 4.5% |
| Elementary School | 337 | 24.7% |
| Middle School | 378 | 27.7% |
| High School | 248 | 18.2% |
| College / Undergraduate | 201 | 14.7% |
| Graduate / Professional | 44 | 3.2% |
| Total | 1,364 | 100.0% |
School Enrollment by Age by Funding Source in Little Silver borough
Out of a total of 1,364 students who are enrolled in schools in Little Silver borough, 421 (30.9%) attend a private institution, while the remaining 943 (69.1%) are enrolled in public schools. The age group of 25 to 34 year olds has the highest likelihood of being enrolled in private schools, with 18 (100.0% in the age bracket) enrolled. Conversely, the age group of 35 years and over has the lowest likelihood of being enrolled in a private school, with 9 (100.0% in the age bracket) attending a public institution.
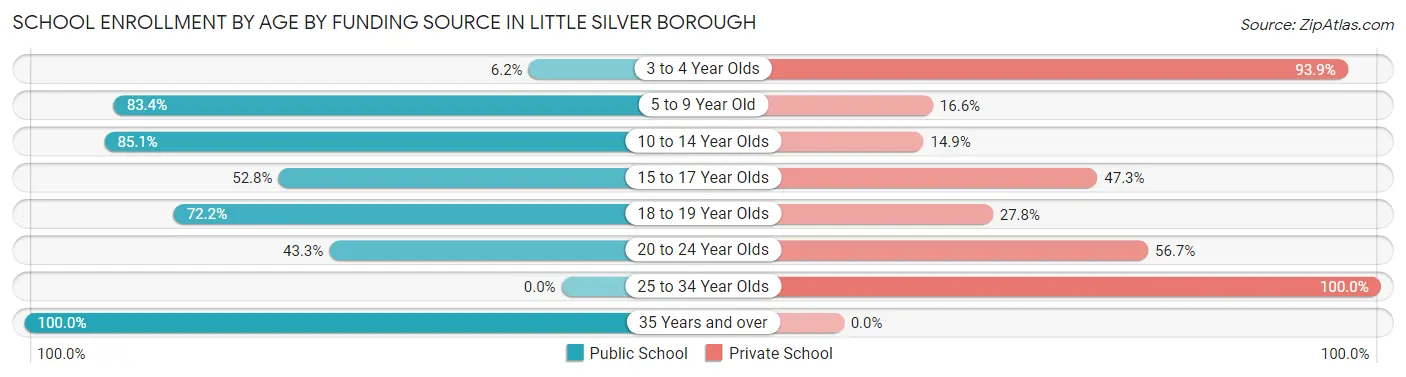
| Age Bracket | Public School | Private School |
| 3 to 4 Year Olds | 4 (6.1%) | 61 (93.9%) |
| 5 to 9 Year Old | 316 (83.4%) | 63 (16.6%) |
| 10 to 14 Year Olds | 389 (85.1%) | 68 (14.9%) |
| 15 to 17 Year Olds | 115 (52.7%) | 103 (47.2%) |
| 18 to 19 Year Olds | 39 (72.2%) | 15 (27.8%) |
| 20 to 24 Year Olds | 71 (43.3%) | 93 (56.7%) |
| 25 to 34 Year Olds | 0 (0.0%) | 18 (100.0%) |
| 35 Years and over | 9 (100.0%) | 0 (0.0%) |
| Total | 943 (69.1%) | 421 (30.9%) |
Educational Attainment by Field of Study in Little Silver borough
Business (928 | 26.7%), education (373 | 10.7%), social sciences (343 | 9.9%), psychology (324 | 9.3%), and literature & languages (296 | 8.5%) are the most common fields of study among 3,473 individuals in Little Silver borough who have obtained a bachelor's degree or higher.
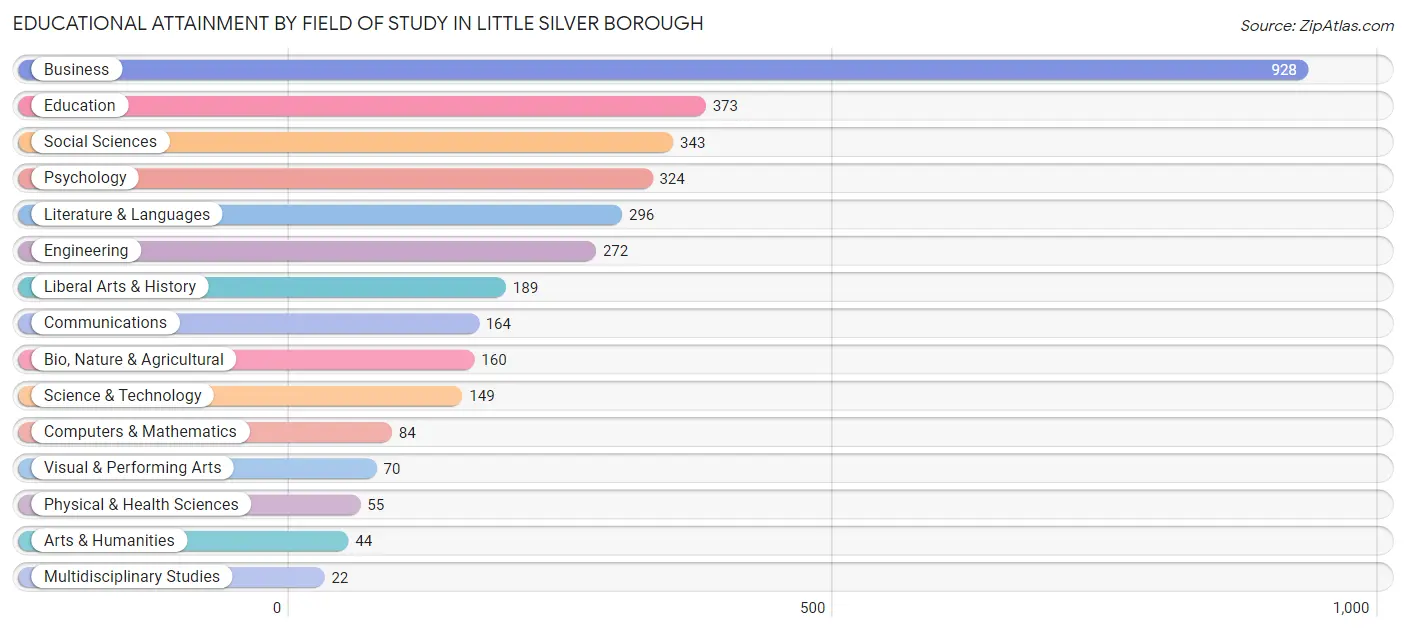
| Field of Study | # Graduates | % Graduates |
| Computers & Mathematics | 84 | 2.4% |
| Bio, Nature & Agricultural | 160 | 4.6% |
| Physical & Health Sciences | 55 | 1.6% |
| Psychology | 324 | 9.3% |
| Social Sciences | 343 | 9.9% |
| Engineering | 272 | 7.8% |
| Multidisciplinary Studies | 22 | 0.6% |
| Science & Technology | 149 | 4.3% |
| Business | 928 | 26.7% |
| Education | 373 | 10.7% |
| Literature & Languages | 296 | 8.5% |
| Liberal Arts & History | 189 | 5.4% |
| Visual & Performing Arts | 70 | 2.0% |
| Communications | 164 | 4.7% |
| Arts & Humanities | 44 | 1.3% |
| Total | 3,473 | 100.0% |
Transportation & Commute in Little Silver borough
Vehicle Availability by Sex in Little Silver borough
The most prevalent vehicle ownership categories in Little Silver borough are males with 2 vehicles (1,261, accounting for 67.2%) and females with 2 vehicles (764, making up 97.8%).
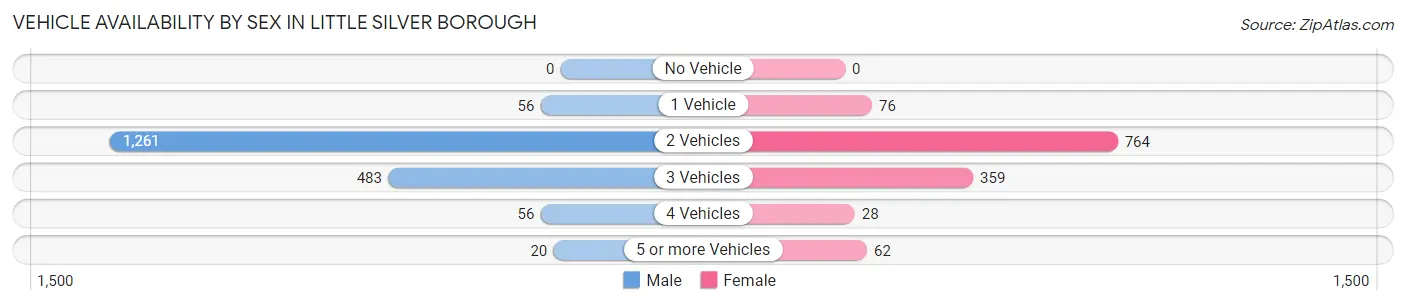
| Vehicles Available | Male | Female |
| No Vehicle | 0 (0.0%) | 0 (0.0%) |
| 1 Vehicle | 56 (3.0%) | 76 (5.9%) |
| 2 Vehicles | 1,261 (67.2%) | 764 (59.3%) |
| 3 Vehicles | 483 (25.8%) | 359 (27.9%) |
| 4 Vehicles | 56 (3.0%) | 28 (2.2%) |
| 5 or more Vehicles | 20 (1.1%) | 62 (4.8%) |
| Total | 1,876 (100.0%) | 1,289 (100.0%) |
Commute Time in Little Silver borough
The most frequently occuring commute durations in Little Silver borough are 10 to 14 minutes (526 commuters, 22.0%), 5 to 9 minutes (479 commuters, 20.1%), and 90 or more minutes (449 commuters, 18.8%).
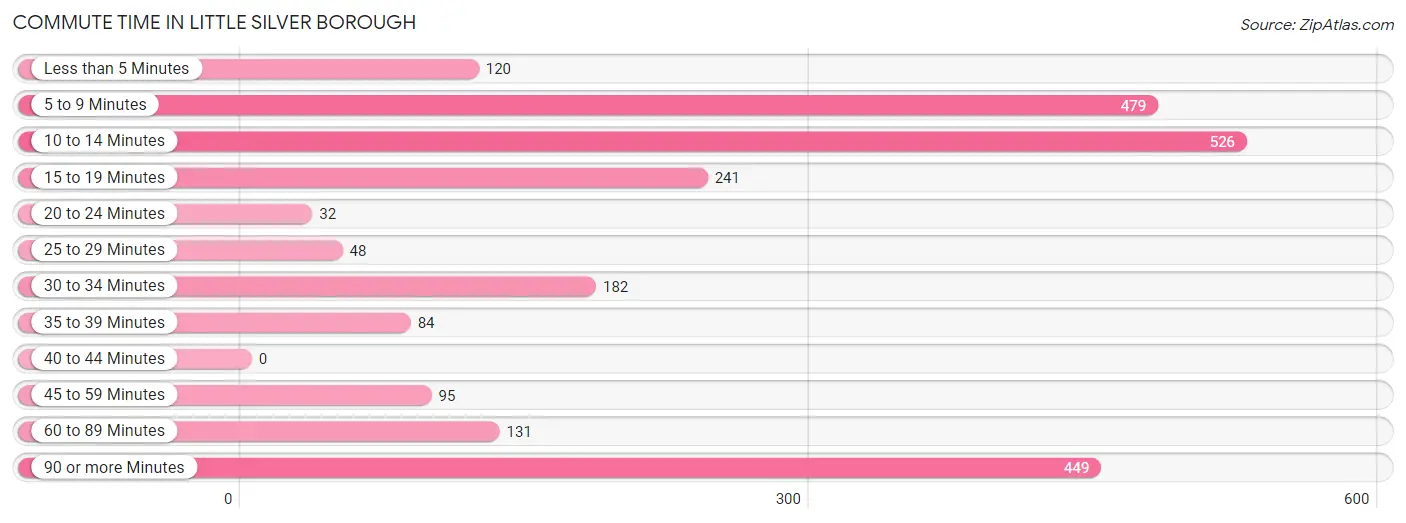
| Commute Time | # Commuters | % Commuters |
| Less than 5 Minutes | 120 | 5.0% |
| 5 to 9 Minutes | 479 | 20.1% |
| 10 to 14 Minutes | 526 | 22.0% |
| 15 to 19 Minutes | 241 | 10.1% |
| 20 to 24 Minutes | 32 | 1.3% |
| 25 to 29 Minutes | 48 | 2.0% |
| 30 to 34 Minutes | 182 | 7.6% |
| 35 to 39 Minutes | 84 | 3.5% |
| 40 to 44 Minutes | 0 | 0.0% |
| 45 to 59 Minutes | 95 | 4.0% |
| 60 to 89 Minutes | 131 | 5.5% |
| 90 or more Minutes | 449 | 18.8% |
Commute Time by Sex in Little Silver borough
The most common commute times in Little Silver borough are 90 or more minutes (311 commuters, 22.0%) for males and 10 to 14 minutes (270 commuters, 27.8%) for females.
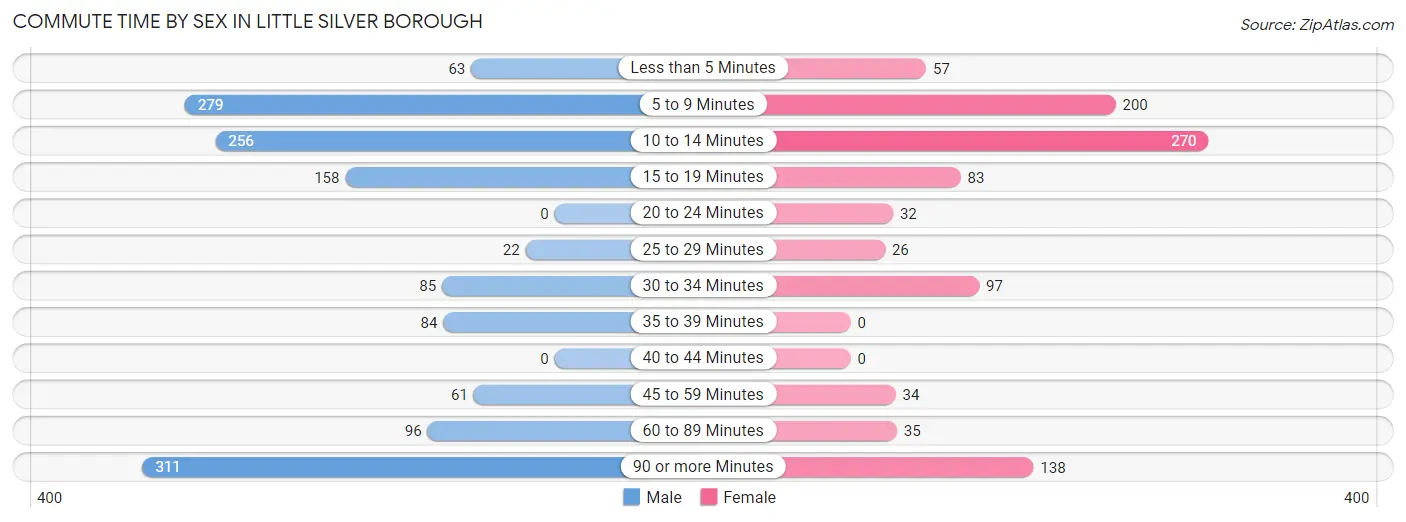
| Commute Time | Male | Female |
| Less than 5 Minutes | 63 (4.4%) | 57 (5.9%) |
| 5 to 9 Minutes | 279 (19.7%) | 200 (20.6%) |
| 10 to 14 Minutes | 256 (18.1%) | 270 (27.8%) |
| 15 to 19 Minutes | 158 (11.2%) | 83 (8.5%) |
| 20 to 24 Minutes | 0 (0.0%) | 32 (3.3%) |
| 25 to 29 Minutes | 22 (1.5%) | 26 (2.7%) |
| 30 to 34 Minutes | 85 (6.0%) | 97 (10.0%) |
| 35 to 39 Minutes | 84 (5.9%) | 0 (0.0%) |
| 40 to 44 Minutes | 0 (0.0%) | 0 (0.0%) |
| 45 to 59 Minutes | 61 (4.3%) | 34 (3.5%) |
| 60 to 89 Minutes | 96 (6.8%) | 35 (3.6%) |
| 90 or more Minutes | 311 (22.0%) | 138 (14.2%) |
Time of Departure to Work by Sex in Little Silver borough
The most frequent times of departure to work in Little Silver borough are 7:30 AM to 7:59 AM (271, 19.2%) for males and 7:30 AM to 7:59 AM (272, 28.0%) for females.
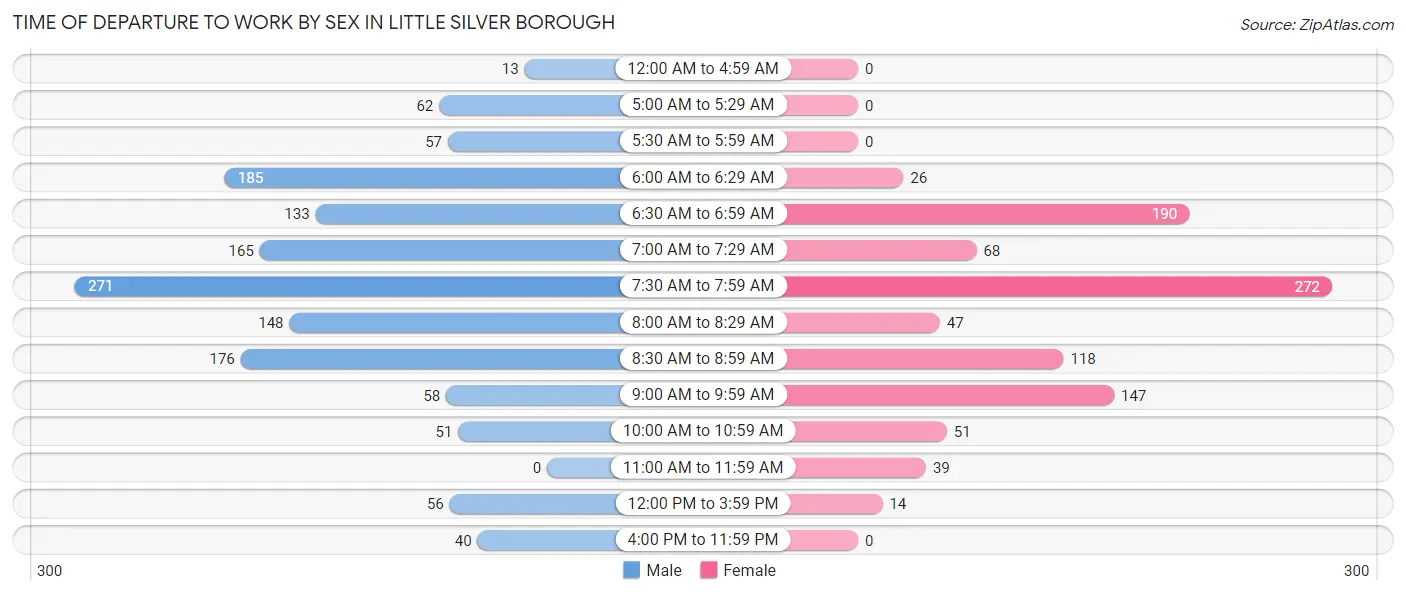
| Time of Departure | Male | Female |
| 12:00 AM to 4:59 AM | 13 (0.9%) | 0 (0.0%) |
| 5:00 AM to 5:29 AM | 62 (4.4%) | 0 (0.0%) |
| 5:30 AM to 5:59 AM | 57 (4.0%) | 0 (0.0%) |
| 6:00 AM to 6:29 AM | 185 (13.1%) | 26 (2.7%) |
| 6:30 AM to 6:59 AM | 133 (9.4%) | 190 (19.6%) |
| 7:00 AM to 7:29 AM | 165 (11.7%) | 68 (7.0%) |
| 7:30 AM to 7:59 AM | 271 (19.2%) | 272 (28.0%) |
| 8:00 AM to 8:29 AM | 148 (10.5%) | 47 (4.8%) |
| 8:30 AM to 8:59 AM | 176 (12.4%) | 118 (12.1%) |
| 9:00 AM to 9:59 AM | 58 (4.1%) | 147 (15.1%) |
| 10:00 AM to 10:59 AM | 51 (3.6%) | 51 (5.2%) |
| 11:00 AM to 11:59 AM | 0 (0.0%) | 39 (4.0%) |
| 12:00 PM to 3:59 PM | 56 (4.0%) | 14 (1.4%) |
| 4:00 PM to 11:59 PM | 40 (2.8%) | 0 (0.0%) |
| Total | 1,415 (100.0%) | 972 (100.0%) |
Housing Occupancy in Little Silver borough
Occupancy by Ownership in Little Silver borough
Of the total 2,248 dwellings in Little Silver borough, owner-occupied units account for 2,162 (96.2%), while renter-occupied units make up 86 (3.8%).
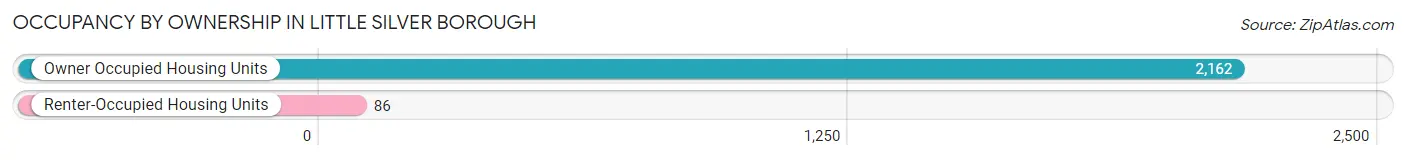
| Occupancy | # Housing Units | % Housing Units |
| Owner Occupied Housing Units | 2,162 | 96.2% |
| Renter-Occupied Housing Units | 86 | 3.8% |
| Total Occupied Housing Units | 2,248 | 100.0% |
Occupancy by Household Size in Little Silver borough
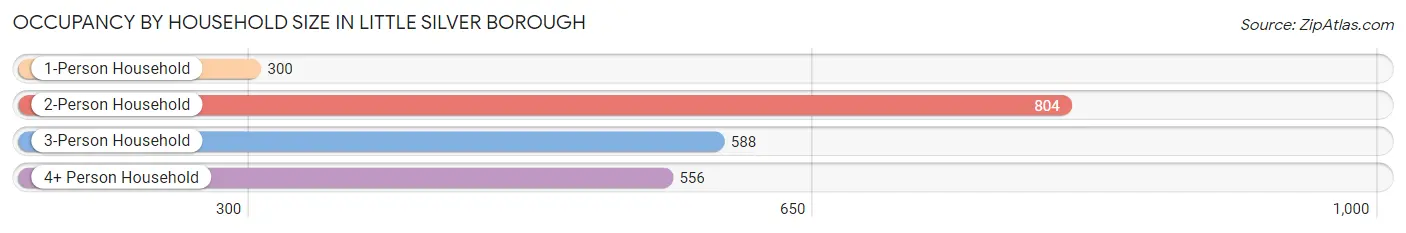
| Household Size | # Housing Units | % Housing Units |
| 1-Person Household | 300 | 13.4% |
| 2-Person Household | 804 | 35.8% |
| 3-Person Household | 588 | 26.2% |
| 4+ Person Household | 556 | 24.7% |
| Total Housing Units | 2,248 | 100.0% |
Occupancy by Ownership by Household Size in Little Silver borough
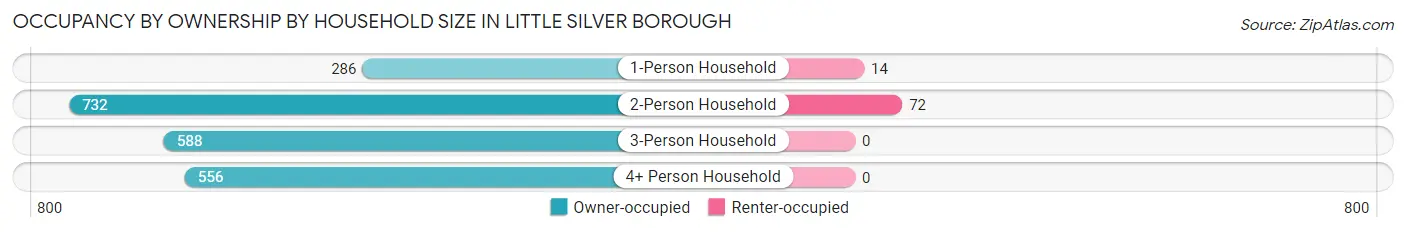
| Household Size | Owner-occupied | Renter-occupied |
| 1-Person Household | 286 (95.3%) | 14 (4.7%) |
| 2-Person Household | 732 (91.0%) | 72 (9.0%) |
| 3-Person Household | 588 (100.0%) | 0 (0.0%) |
| 4+ Person Household | 556 (100.0%) | 0 (0.0%) |
| Total Housing Units | 2,162 (96.2%) | 86 (3.8%) |
Occupancy by Educational Attainment in Little Silver borough
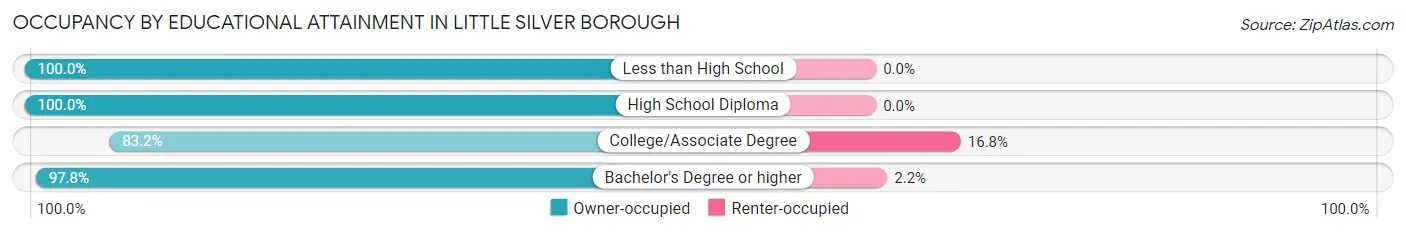
| Household Size | Owner-occupied | Renter-occupied |
| Less than High School | 29 (100.0%) | 0 (0.0%) |
| High School Diploma | 64 (100.0%) | 0 (0.0%) |
| College/Associate Degree | 218 (83.2%) | 44 (16.8%) |
| Bachelor's Degree or higher | 1,851 (97.8%) | 42 (2.2%) |
Occupancy by Age of Householder in Little Silver borough
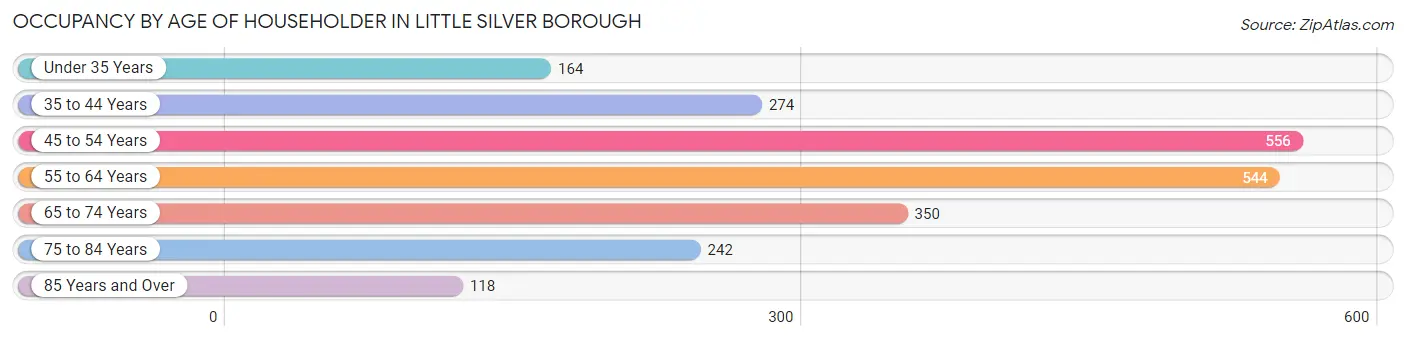
| Age Bracket | # Households | % Households |
| Under 35 Years | 164 | 7.3% |
| 35 to 44 Years | 274 | 12.2% |
| 45 to 54 Years | 556 | 24.7% |
| 55 to 64 Years | 544 | 24.2% |
| 65 to 74 Years | 350 | 15.6% |
| 75 to 84 Years | 242 | 10.8% |
| 85 Years and Over | 118 | 5.2% |
| Total | 2,248 | 100.0% |
Housing Finances in Little Silver borough
Median Income by Occupancy in Little Silver borough
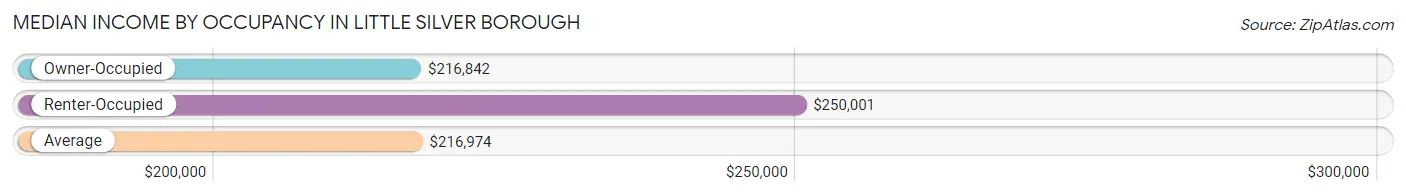
| Occupancy Type | # Households | Median Income |
| Owner-Occupied | 2,162 (96.2%) | $216,842 |
| Renter-Occupied | 86 (3.8%) | $250,001 |
| Average | 2,248 (100.0%) | $216,974 |
Occupancy by Householder Income Bracket in Little Silver borough
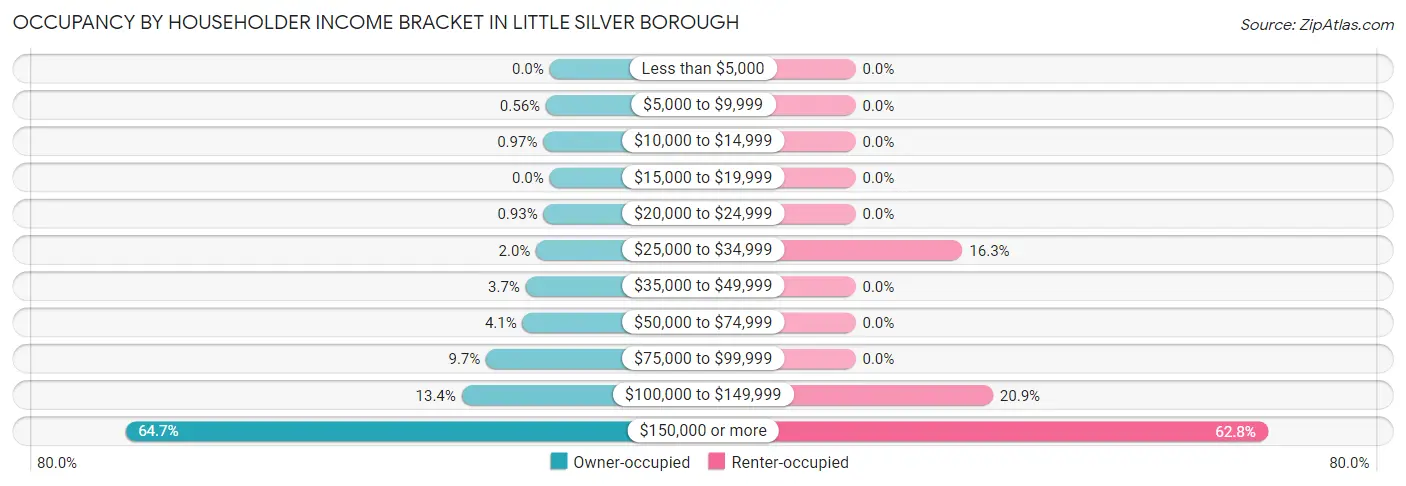
| Income Bracket | Owner-occupied | Renter-occupied |
| Less than $5,000 | 0 (0.0%) | 0 (0.0%) |
| $5,000 to $9,999 | 12 (0.6%) | 0 (0.0%) |
| $10,000 to $14,999 | 21 (1.0%) | 0 (0.0%) |
| $15,000 to $19,999 | 0 (0.0%) | 0 (0.0%) |
| $20,000 to $24,999 | 20 (0.9%) | 0 (0.0%) |
| $25,000 to $34,999 | 44 (2.0%) | 14 (16.3%) |
| $35,000 to $49,999 | 79 (3.6%) | 0 (0.0%) |
| $50,000 to $74,999 | 89 (4.1%) | 0 (0.0%) |
| $75,000 to $99,999 | 209 (9.7%) | 0 (0.0%) |
| $100,000 to $149,999 | 290 (13.4%) | 18 (20.9%) |
| $150,000 or more | 1,398 (64.7%) | 54 (62.8%) |
| Total | 2,162 (100.0%) | 86 (100.0%) |
Monthly Housing Cost Tiers in Little Silver borough
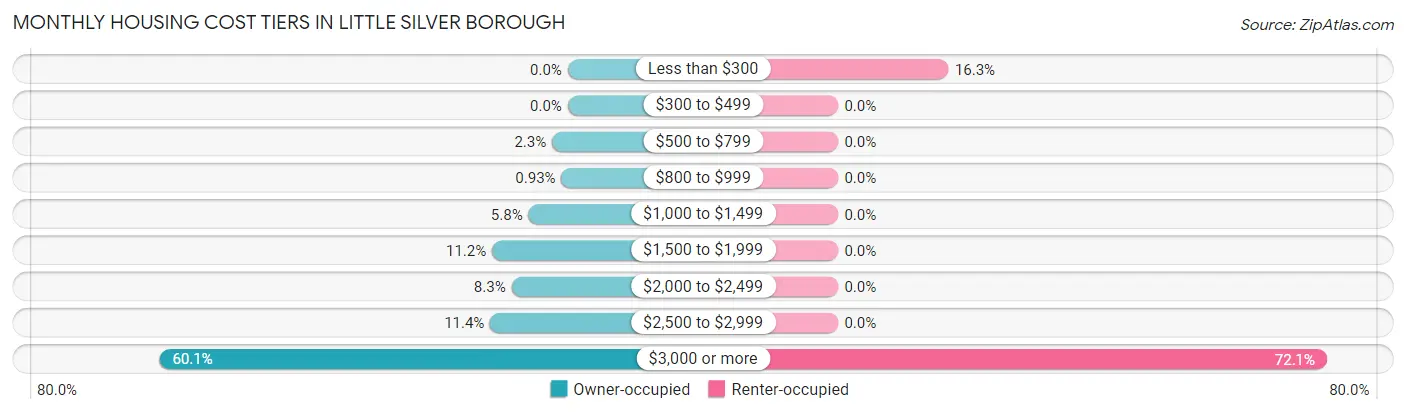
| Monthly Cost | Owner-occupied | Renter-occupied |
| Less than $300 | 0 (0.0%) | 14 (16.3%) |
| $300 to $499 | 0 (0.0%) | 0 (0.0%) |
| $500 to $799 | 50 (2.3%) | 0 (0.0%) |
| $800 to $999 | 20 (0.9%) | 0 (0.0%) |
| $1,000 to $1,499 | 125 (5.8%) | 0 (0.0%) |
| $1,500 to $1,999 | 241 (11.2%) | 0 (0.0%) |
| $2,000 to $2,499 | 179 (8.3%) | 0 (0.0%) |
| $2,500 to $2,999 | 247 (11.4%) | 0 (0.0%) |
| $3,000 or more | 1,300 (60.1%) | 62 (72.1%) |
| Total | 2,162 (100.0%) | 86 (100.0%) |
Physical Housing Characteristics in Little Silver borough
Housing Structures in Little Silver borough
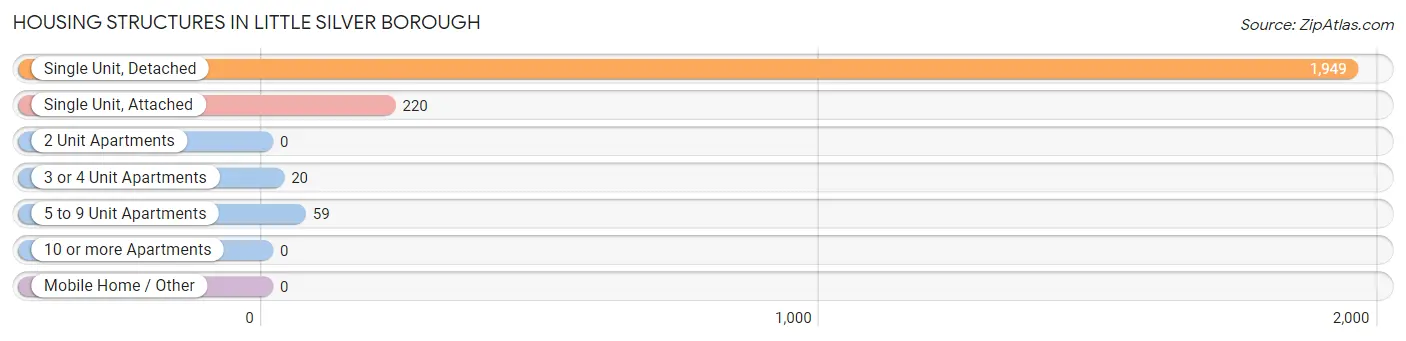
| Structure Type | # Housing Units | % Housing Units |
| Single Unit, Detached | 1,949 | 86.7% |
| Single Unit, Attached | 220 | 9.8% |
| 2 Unit Apartments | 0 | 0.0% |
| 3 or 4 Unit Apartments | 20 | 0.9% |
| 5 to 9 Unit Apartments | 59 | 2.6% |
| 10 or more Apartments | 0 | 0.0% |
| Mobile Home / Other | 0 | 0.0% |
| Total | 2,248 | 100.0% |
Housing Structures by Occupancy in Little Silver borough
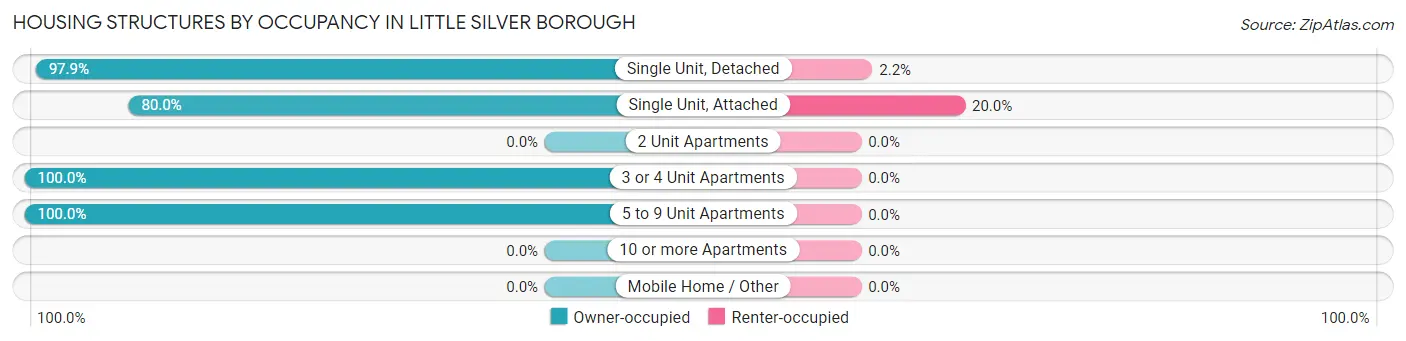
| Structure Type | Owner-occupied | Renter-occupied |
| Single Unit, Detached | 1,907 (97.9%) | 42 (2.1%) |
| Single Unit, Attached | 176 (80.0%) | 44 (20.0%) |
| 2 Unit Apartments | 0 (0.0%) | 0 (0.0%) |
| 3 or 4 Unit Apartments | 20 (100.0%) | 0 (0.0%) |
| 5 to 9 Unit Apartments | 59 (100.0%) | 0 (0.0%) |
| 10 or more Apartments | 0 (0.0%) | 0 (0.0%) |
| Mobile Home / Other | 0 (0.0%) | 0 (0.0%) |
| Total | 2,162 (96.2%) | 86 (3.8%) |
Housing Structures by Number of Rooms in Little Silver borough
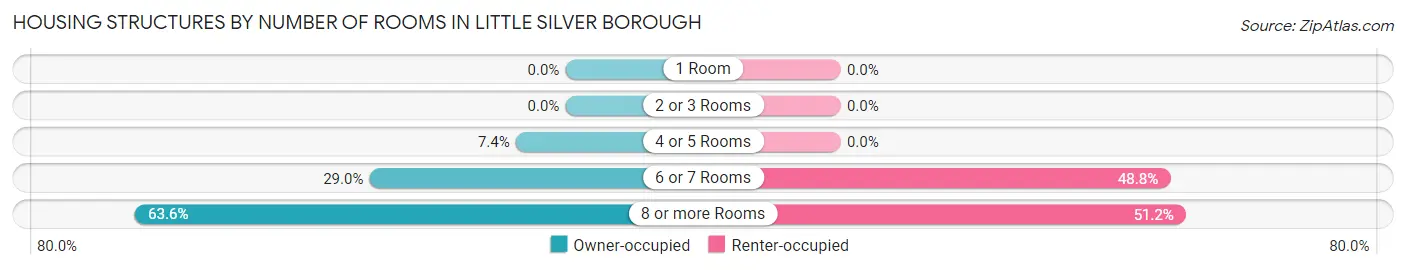
| Number of Rooms | Owner-occupied | Renter-occupied |
| 1 Room | 0 (0.0%) | 0 (0.0%) |
| 2 or 3 Rooms | 0 (0.0%) | 0 (0.0%) |
| 4 or 5 Rooms | 159 (7.3%) | 0 (0.0%) |
| 6 or 7 Rooms | 627 (29.0%) | 42 (48.8%) |
| 8 or more Rooms | 1,376 (63.6%) | 44 (51.2%) |
| Total | 2,162 (100.0%) | 86 (100.0%) |
Housing Structure by Heating Type in Little Silver borough
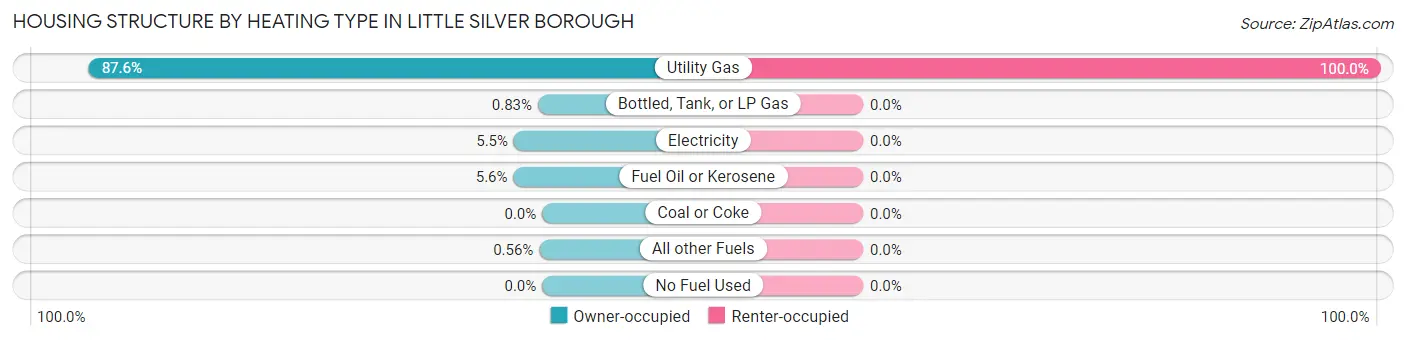
| Heating Type | Owner-occupied | Renter-occupied |
| Utility Gas | 1,894 (87.6%) | 86 (100.0%) |
| Bottled, Tank, or LP Gas | 18 (0.8%) | 0 (0.0%) |
| Electricity | 118 (5.5%) | 0 (0.0%) |
| Fuel Oil or Kerosene | 120 (5.6%) | 0 (0.0%) |
| Coal or Coke | 0 (0.0%) | 0 (0.0%) |
| All other Fuels | 12 (0.6%) | 0 (0.0%) |
| No Fuel Used | 0 (0.0%) | 0 (0.0%) |
| Total | 2,162 (100.0%) | 86 (100.0%) |
Household Vehicle Usage in Little Silver borough
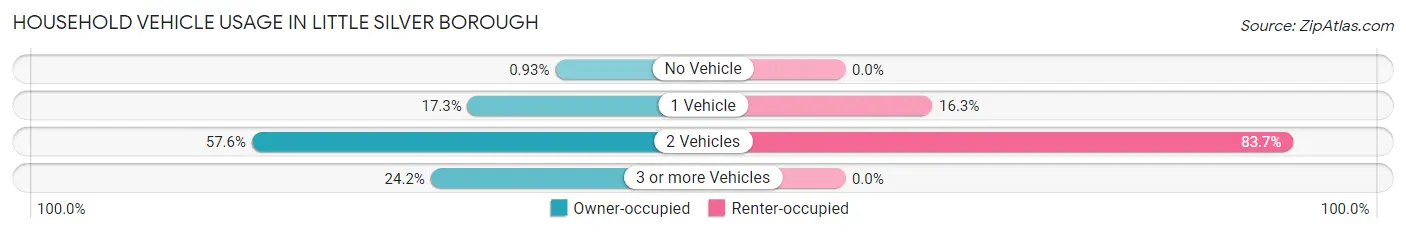
| Vehicles per Household | Owner-occupied | Renter-occupied |
| No Vehicle | 20 (0.9%) | 0 (0.0%) |
| 1 Vehicle | 374 (17.3%) | 14 (16.3%) |
| 2 Vehicles | 1,245 (57.6%) | 72 (83.7%) |
| 3 or more Vehicles | 523 (24.2%) | 0 (0.0%) |
| Total | 2,162 (100.0%) | 86 (100.0%) |
Real Estate & Mortgages in Little Silver borough
Real Estate and Mortgage Overview in Little Silver borough
| Characteristic | Without Mortgage | With Mortgage |
| Housing Units | 546 | 1,616 |
| Median Property Value | $867,600 | $799,200 |
| Median Household Income | $148,611 | $1,175 |
| Monthly Housing Costs | $1,501 | $1,280 |
| Real Estate Taxes | $10,001 | $0 |
Property Value by Mortgage Status in Little Silver borough
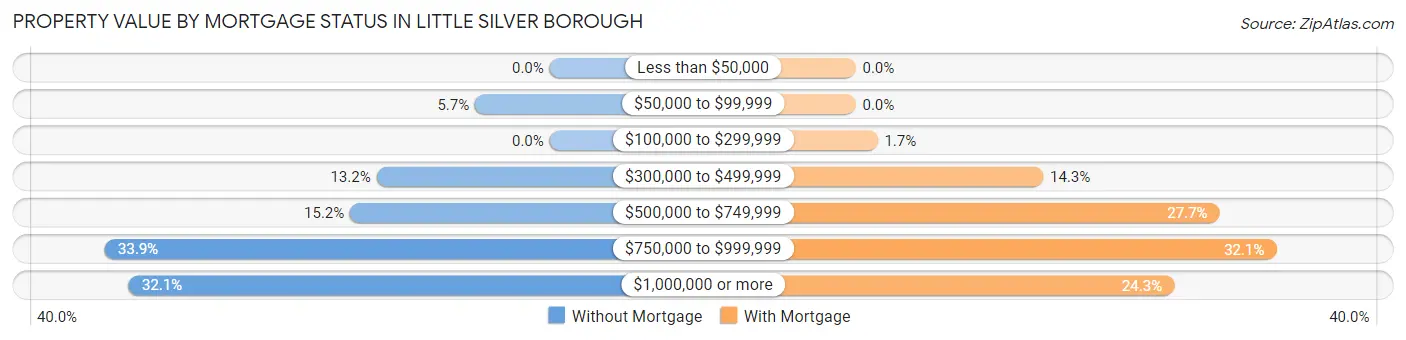
| Property Value | Without Mortgage | With Mortgage |
| Less than $50,000 | 0 (0.0%) | 0 (0.0%) |
| $50,000 to $99,999 | 31 (5.7%) | 0 (0.0%) |
| $100,000 to $299,999 | 0 (0.0%) | 27 (1.7%) |
| $300,000 to $499,999 | 72 (13.2%) | 231 (14.3%) |
| $500,000 to $749,999 | 83 (15.2%) | 448 (27.7%) |
| $750,000 to $999,999 | 185 (33.9%) | 518 (32.1%) |
| $1,000,000 or more | 175 (32.1%) | 392 (24.3%) |
| Total | 546 (100.0%) | 1,616 (100.0%) |
Household Income by Mortgage Status in Little Silver borough

| Household Income | Without Mortgage | With Mortgage |
| Less than $10,000 | 12 (2.2%) | 78 (4.8%) |
| $10,000 to $24,999 | 41 (7.5%) | 0 (0.0%) |
| $25,000 to $34,999 | 0 (0.0%) | 0 (0.0%) |
| $35,000 to $49,999 | 18 (3.3%) | 44 (2.7%) |
| $50,000 to $74,999 | 30 (5.5%) | 61 (3.8%) |
| $75,000 to $99,999 | 79 (14.5%) | 59 (3.6%) |
| $100,000 to $149,999 | 143 (26.2%) | 130 (8.0%) |
| $150,000 or more | 223 (40.8%) | 147 (9.1%) |
| Total | 546 (100.0%) | 1,616 (100.0%) |
Property Value to Household Income Ratio in Little Silver borough
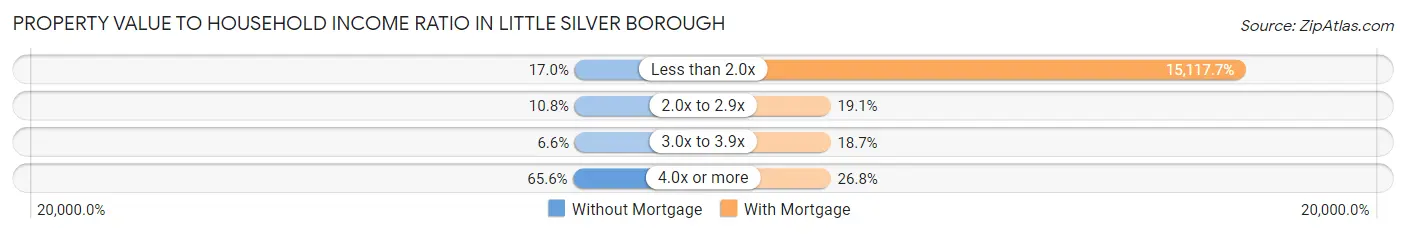
| Value-to-Income Ratio | Without Mortgage | With Mortgage |
| Less than 2.0x | 93 (17.0%) | 244,302 (15,117.7%) |
| 2.0x to 2.9x | 59 (10.8%) | 309 (19.1%) |
| 3.0x to 3.9x | 36 (6.6%) | 302 (18.7%) |
| 4.0x or more | 358 (65.6%) | 433 (26.8%) |
| Total | 546 (100.0%) | 1,616 (100.0%) |
Real Estate Taxes by Mortgage Status in Little Silver borough
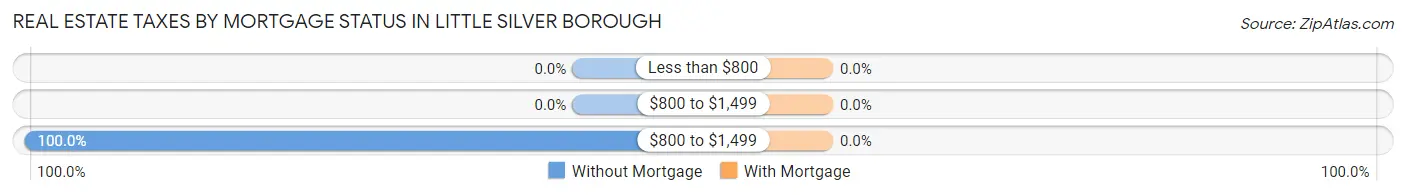
| Property Taxes | Without Mortgage | With Mortgage |
| Less than $800 | 0 (0.0%) | 0 (0.0%) |
| $800 to $1,499 | 0 (0.0%) | 0 (0.0%) |
| $800 to $1,499 | 546 (100.0%) | 0 (0.0%) |
| Total | 546 (100.0%) | 1,616 (100.0%) |
Health & Disability in Little Silver borough
Health Insurance Coverage by Age in Little Silver borough
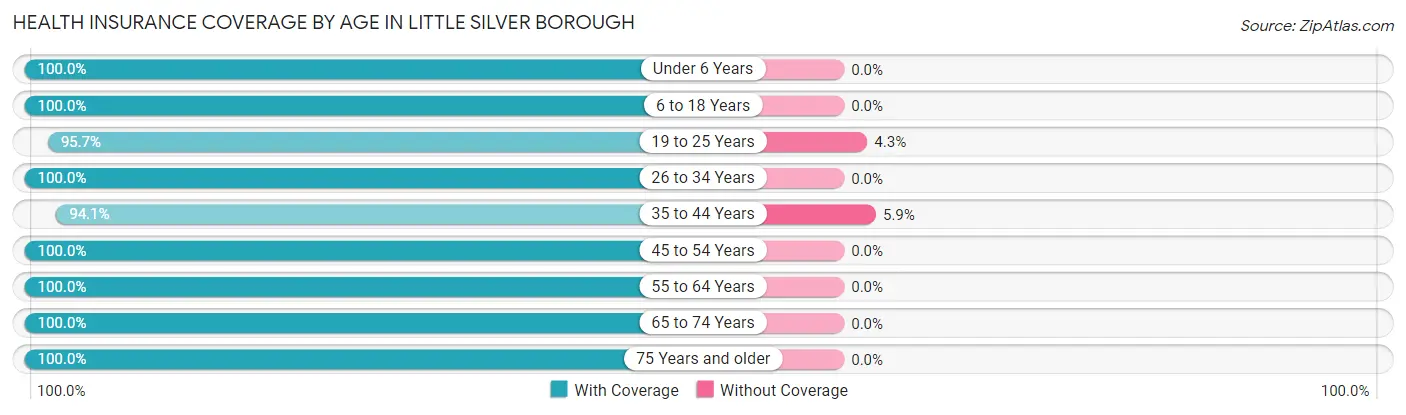
| Age Bracket | With Coverage | Without Coverage |
| Under 6 Years | 450 (100.0%) | 0 (0.0%) |
| 6 to 18 Years | 1,024 (100.0%) | 0 (0.0%) |
| 19 to 25 Years | 333 (95.7%) | 15 (4.3%) |
| 26 to 34 Years | 492 (100.0%) | 0 (0.0%) |
| 35 to 44 Years | 588 (94.1%) | 37 (5.9%) |
| 45 to 54 Years | 1,032 (100.0%) | 0 (0.0%) |
| 55 to 64 Years | 1,043 (100.0%) | 0 (0.0%) |
| 65 to 74 Years | 589 (100.0%) | 0 (0.0%) |
| 75 Years and older | 501 (100.0%) | 0 (0.0%) |
| Total | 6,052 (99.2%) | 52 (0.9%) |
Health Insurance Coverage by Citizenship Status in Little Silver borough
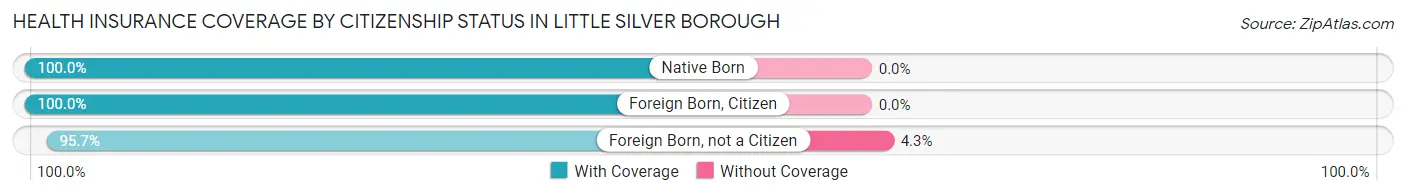
| Citizenship Status | With Coverage | Without Coverage |
| Native Born | 450 (100.0%) | 0 (0.0%) |
| Foreign Born, Citizen | 1,024 (100.0%) | 0 (0.0%) |
| Foreign Born, not a Citizen | 333 (95.7%) | 15 (4.3%) |
Health Insurance Coverage by Household Income in Little Silver borough
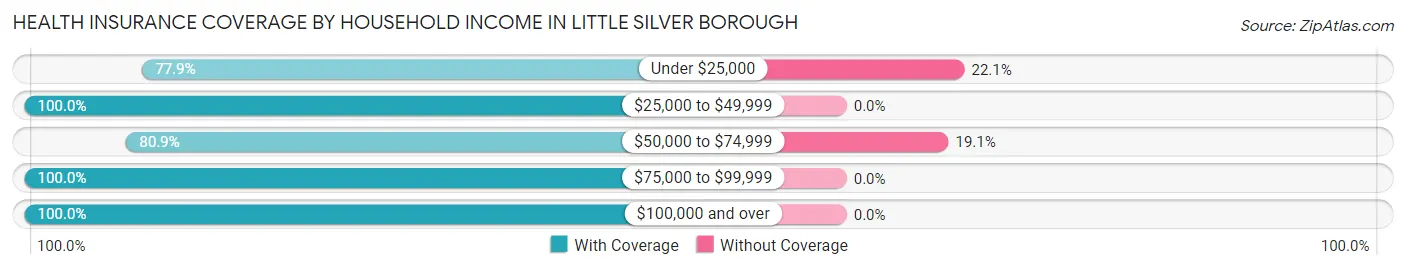
| Household Income | With Coverage | Without Coverage |
| Under $25,000 | 53 (77.9%) | 15 (22.1%) |
| $25,000 to $49,999 | 201 (100.0%) | 0 (0.0%) |
| $50,000 to $74,999 | 157 (80.9%) | 37 (19.1%) |
| $75,000 to $99,999 | 437 (100.0%) | 0 (0.0%) |
| $100,000 and over | 5,204 (100.0%) | 0 (0.0%) |
Public vs Private Health Insurance Coverage by Age in Little Silver borough
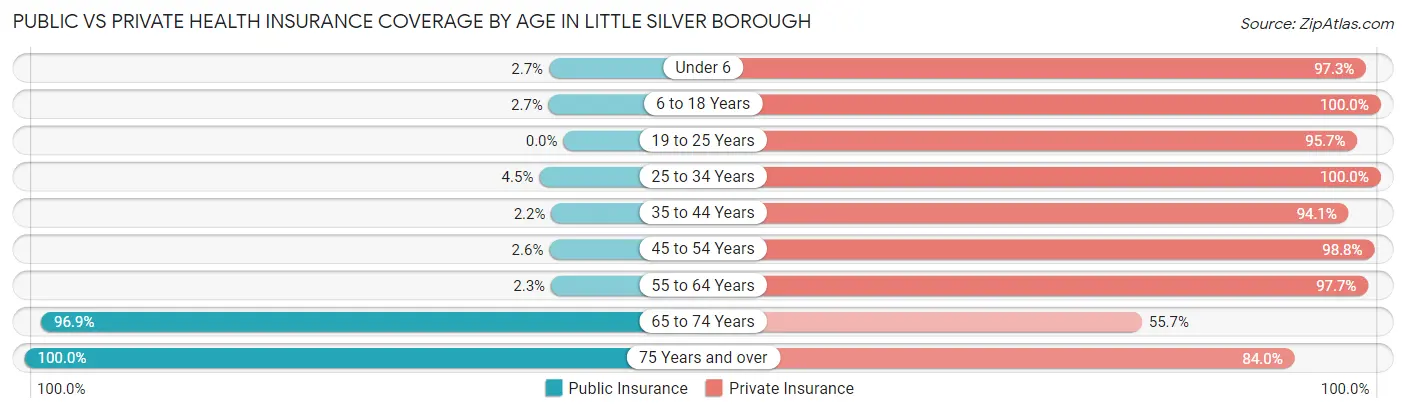
| Age Bracket | Public Insurance | Private Insurance |
| Under 6 | 12 (2.7%) | 438 (97.3%) |
| 6 to 18 Years | 28 (2.7%) | 1,024 (100.0%) |
| 19 to 25 Years | 0 (0.0%) | 333 (95.7%) |
| 25 to 34 Years | 22 (4.5%) | 492 (100.0%) |
| 35 to 44 Years | 14 (2.2%) | 588 (94.1%) |
| 45 to 54 Years | 27 (2.6%) | 1,020 (98.8%) |
| 55 to 64 Years | 24 (2.3%) | 1,019 (97.7%) |
| 65 to 74 Years | 571 (96.9%) | 328 (55.7%) |
| 75 Years and over | 501 (100.0%) | 421 (84.0%) |
| Total | 1,199 (19.6%) | 5,663 (92.8%) |
Disability Status by Sex by Age in Little Silver borough
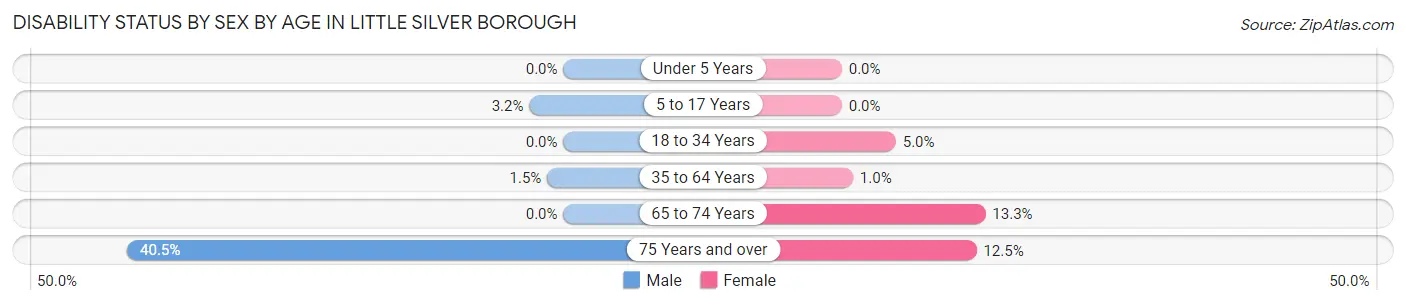
| Age Bracket | Male | Female |
| Under 5 Years | 0 (0.0%) | 0 (0.0%) |
| 5 to 17 Years | 19 (3.2%) | 0 (0.0%) |
| 18 to 34 Years | 0 (0.0%) | 19 (5.0%) |
| 35 to 64 Years | 20 (1.5%) | 14 (1.0%) |
| 65 to 74 Years | 0 (0.0%) | 44 (13.3%) |
| 75 Years and over | 83 (40.5%) | 37 (12.5%) |
Disability Class by Sex by Age in Little Silver borough
Disability Class: Hearing Difficulty
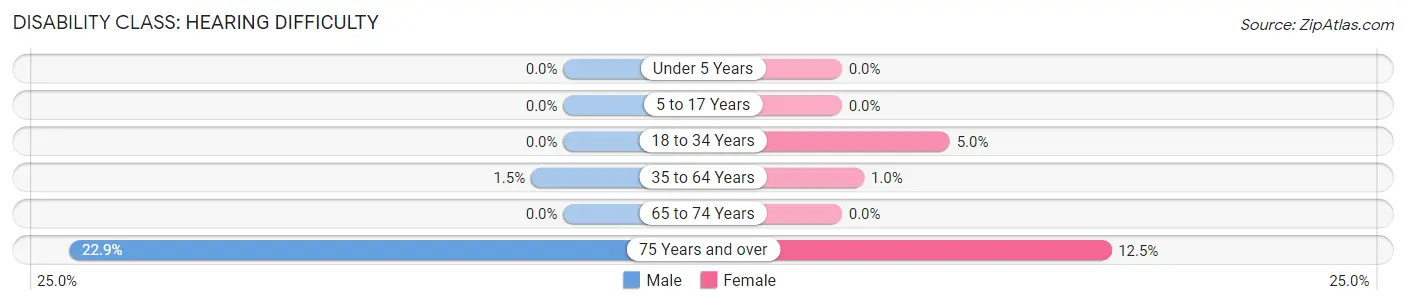
| Age Bracket | Male | Female |
| Under 5 Years | 0 (0.0%) | 0 (0.0%) |
| 5 to 17 Years | 0 (0.0%) | 0 (0.0%) |
| 18 to 34 Years | 0 (0.0%) | 19 (5.0%) |
| 35 to 64 Years | 20 (1.5%) | 14 (1.0%) |
| 65 to 74 Years | 0 (0.0%) | 0 (0.0%) |
| 75 Years and over | 47 (22.9%) | 37 (12.5%) |
Disability Class: Vision Difficulty
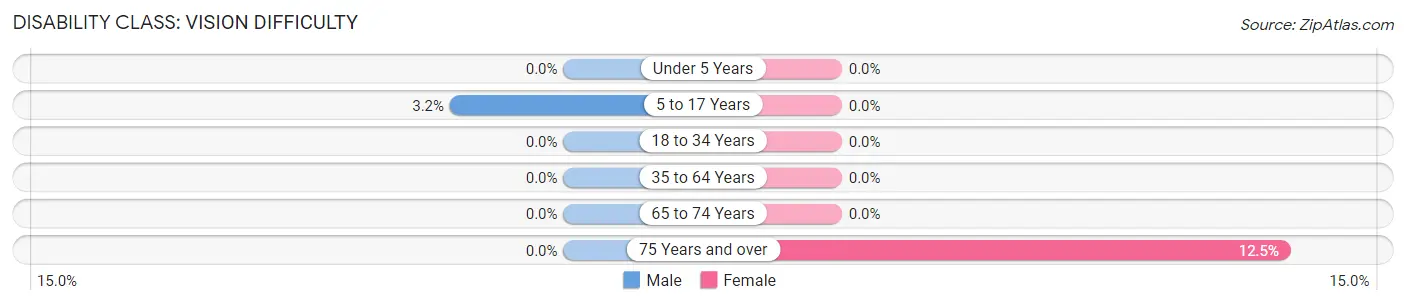
| Age Bracket | Male | Female |
| Under 5 Years | 0 (0.0%) | 0 (0.0%) |
| 5 to 17 Years | 19 (3.2%) | 0 (0.0%) |
| 18 to 34 Years | 0 (0.0%) | 0 (0.0%) |
| 35 to 64 Years | 0 (0.0%) | 0 (0.0%) |
| 65 to 74 Years | 0 (0.0%) | 0 (0.0%) |
| 75 Years and over | 0 (0.0%) | 37 (12.5%) |
Disability Class: Cognitive Difficulty
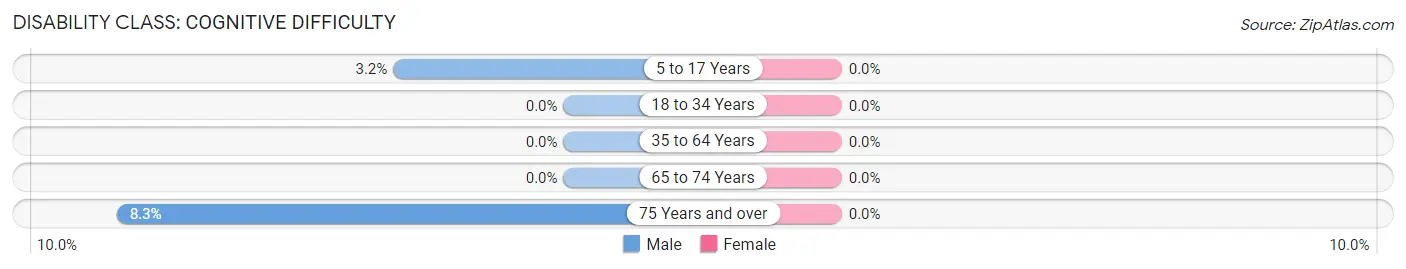
| Age Bracket | Male | Female |
| 5 to 17 Years | 19 (3.2%) | 0 (0.0%) |
| 18 to 34 Years | 0 (0.0%) | 0 (0.0%) |
| 35 to 64 Years | 0 (0.0%) | 0 (0.0%) |
| 65 to 74 Years | 0 (0.0%) | 0 (0.0%) |
| 75 Years and over | 17 (8.3%) | 0 (0.0%) |
Disability Class: Ambulatory Difficulty
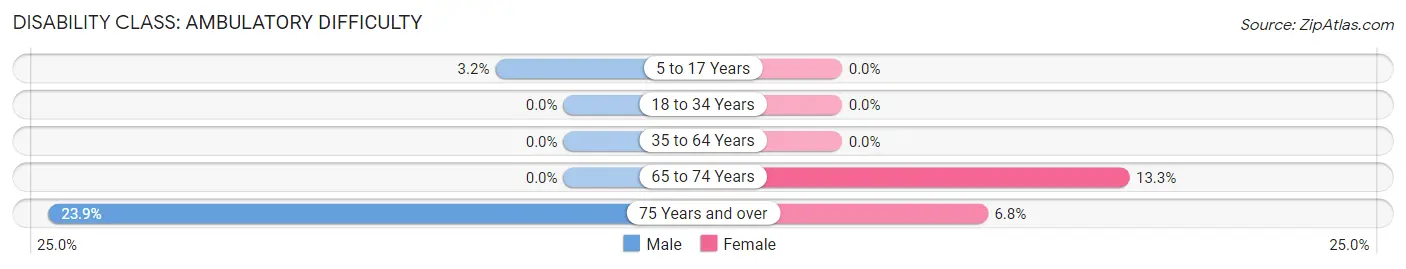
| Age Bracket | Male | Female |
| 5 to 17 Years | 19 (3.2%) | 0 (0.0%) |
| 18 to 34 Years | 0 (0.0%) | 0 (0.0%) |
| 35 to 64 Years | 0 (0.0%) | 0 (0.0%) |
| 65 to 74 Years | 0 (0.0%) | 44 (13.3%) |
| 75 Years and over | 49 (23.9%) | 20 (6.8%) |
Disability Class: Self-Care Difficulty
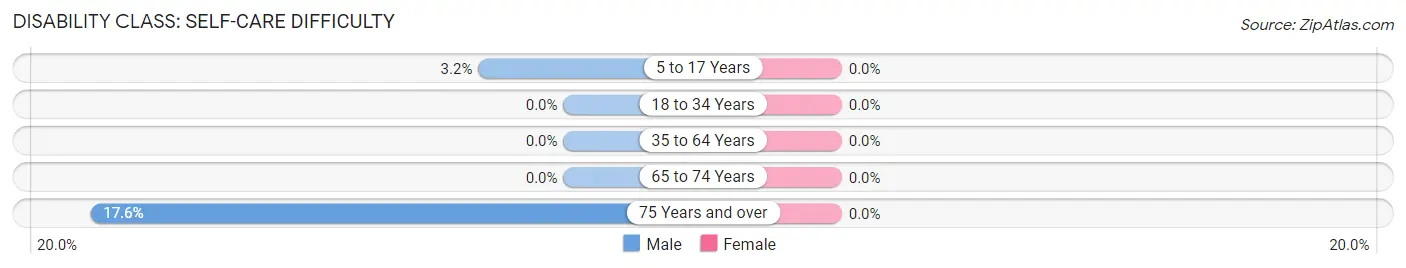
| Age Bracket | Male | Female |
| 5 to 17 Years | 19 (3.2%) | 0 (0.0%) |
| 18 to 34 Years | 0 (0.0%) | 0 (0.0%) |
| 35 to 64 Years | 0 (0.0%) | 0 (0.0%) |
| 65 to 74 Years | 0 (0.0%) | 0 (0.0%) |
| 75 Years and over | 36 (17.6%) | 0 (0.0%) |
Technology Access in Little Silver borough
Computing Device Access in Little Silver borough
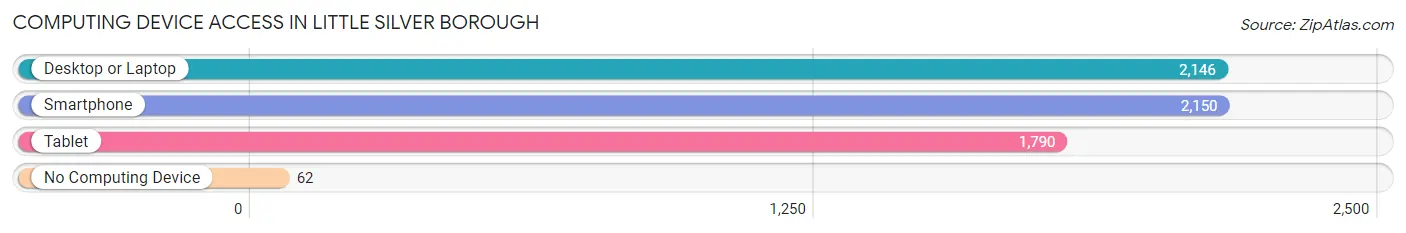
| Device Type | # Households | % Households |
| Desktop or Laptop | 2,146 | 95.5% |
| Smartphone | 2,150 | 95.6% |
| Tablet | 1,790 | 79.6% |
| No Computing Device | 62 | 2.8% |
| Total | 2,248 | 100.0% |
Internet Access in Little Silver borough
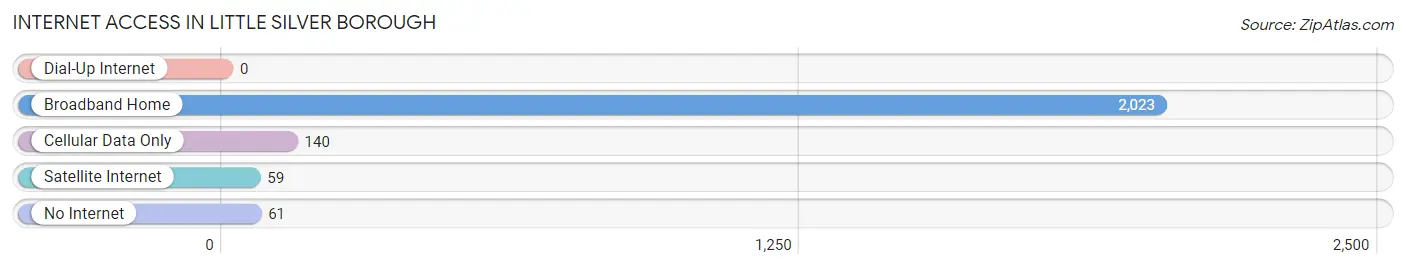
| Internet Type | # Households | % Households |
| Dial-Up Internet | 0 | 0.0% |
| Broadband Home | 2,023 | 90.0% |
| Cellular Data Only | 140 | 6.2% |
| Satellite Internet | 59 | 2.6% |
| No Internet | 61 | 2.7% |
| Total | 2,248 | 100.0% |
Little Silver borough Summary
Silver Borough, NJ is a small borough located in Monmouth County, New Jersey. It is situated on the Navesink River, and is part of the larger Red Bank-Shrewsbury metropolitan area. The borough has a population of 5,950 people, according to the 2010 census.
History
Little Silver was originally part of Shrewsbury Township, which was established in 1693. The area was first settled in 1667 by English settlers, and the town was officially incorporated in 1923. The name “Little Silver” was derived from the silver coins that were found in the area during the colonial period.
The borough was home to a number of prominent families, including the Red Bank family, who owned a large estate in the area. The Red Bank family was influential in the development of the borough, and their estate is now a historic site.
Geography
Little Silver is located in Monmouth County, New Jersey, and is situated on the Navesink River. The borough is bordered by the boroughs of Red Bank, Shrewsbury, and Rumson. The borough is approximately 4.5 square miles in size, and has a total population of 5,950 people, according to the 2010 census.
The borough is located in the central part of Monmouth County, and is part of the larger Red Bank-Shrewsbury metropolitan area. The borough is located approximately 25 miles south of New York City, and is accessible by the Garden State Parkway and the New Jersey Turnpike.
Economy
Little Silver has a diverse economy, with a variety of businesses and industries. The borough is home to a number of small businesses, including restaurants, retail stores, and professional services. The borough is also home to a number of larger businesses, including a medical center, a bank, and a number of technology companies.
The borough is also home to a number of educational institutions, including the Little Silver Public School District, which serves the borough and surrounding areas. The borough is also home to Monmouth University, which is located in the borough.
Demographics
According to the 2010 census, the population of Little Silver was 5,950 people. The racial makeup of the borough was 87.3% White, 5.3% African American, 0.3% Native American, 3.2% Asian, and 3.9% from other races. The median household income in the borough was $97,917, and the median age was 43.7 years.
Conclusion
Little Silver Borough, NJ is a small borough located in Monmouth County, New Jersey. It is situated on the Navesink River, and is part of the larger Red Bank-Shrewsbury metropolitan area. The borough has a population of 5,950 people, according to the 2010 census. The borough has a diverse economy, with a variety of businesses and industries. The racial makeup of the borough was 87.3% White, 5.3% African American, 0.3% Native American, 3.2% Asian, and 3.9% from other races. The median household income in the borough was $97,917, and the median age was 43.7 years. Little Silver is a vibrant community with a rich history and a bright future.
Common Questions
What is Per Capita Income in Little Silver borough?
Per Capita income in Little Silver borough is $102,990.
What is the Median Family Income in Little Silver borough?
Median Family Income in Little Silver borough is $229,393.
What is the Median Household income in Little Silver borough?
Median Household Income in Little Silver borough is $216,974.
What is Income or Wage Gap in Little Silver borough?
Income or Wage Gap in Little Silver borough is 59.6%.
Women in Little Silver borough earn 40.4 cents for every dollar earned by a man.
What is Inequality or Gini Index in Little Silver borough?
Inequality or Gini Index in Little Silver borough is 0.43.
What is the Total Population of Little Silver borough?
Total Population of Little Silver borough is 6,104.
What is the Total Male Population of Little Silver borough?
Total Male Population of Little Silver borough is 3,131.
What is the Total Female Population of Little Silver borough?
Total Female Population of Little Silver borough is 2,973.
What is the Ratio of Males per 100 Females in Little Silver borough?
There are 105.31 Males per 100 Females in Little Silver borough.
What is the Ratio of Females per 100 Males in Little Silver borough?
There are 94.95 Females per 100 Males in Little Silver borough.
What is the Median Population Age in Little Silver borough?
Median Population Age in Little Silver borough is 46.3 Years.
What is the Average Family Size in Little Silver borough
Average Family Size in Little Silver borough is 3.0 People.
What is the Average Household Size in Little Silver borough
Average Household Size in Little Silver borough is 2.7 People.
How Large is the Labor Force in Little Silver borough?
There are 3,339 People in the Labor Forcein in Little Silver borough.
What is the Percentage of People in the Labor Force in Little Silver borough?
69.7% of People are in the Labor Force in Little Silver borough.
What is the Unemployment Rate in Little Silver borough?
Unemployment Rate in Little Silver borough is 3.3%.