Hoboken, NJ Map & Demographics
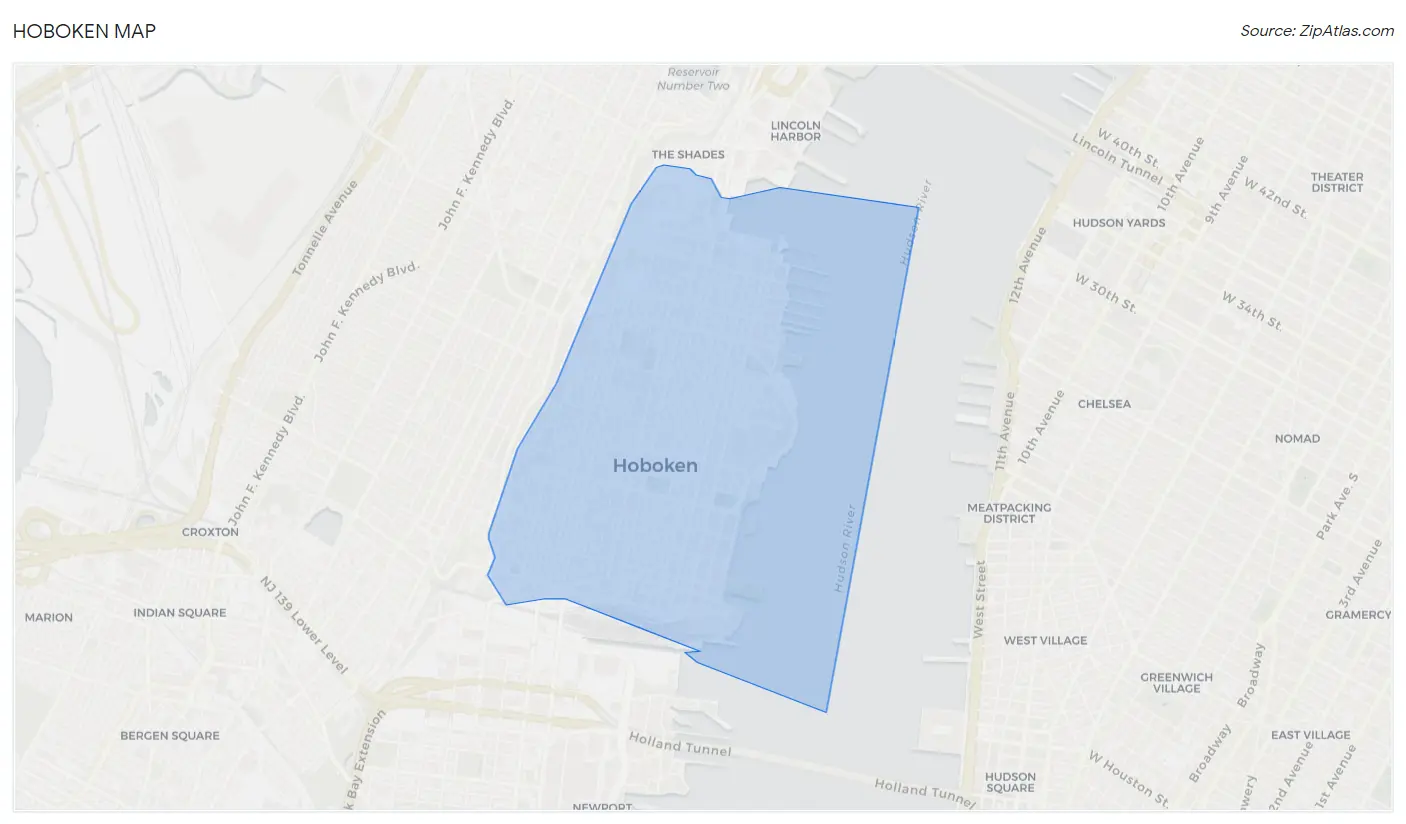
Hoboken Map
Hoboken Overview
$102,492
PER CAPITA INCOME
$236,742
AVG FAMILY INCOME
$168,137
AVG HOUSEHOLD INCOME
19.7%
WAGE / INCOME GAP [ % ]
80.3¢/ $1
WAGE / INCOME GAP [ $ ]
0.47
INEQUALITY / GINI INDEX
58,754
TOTAL POPULATION
28,954
MALE POPULATION
29,800
FEMALE POPULATION
97.16
MALES / 100 FEMALES
102.92
FEMALES / 100 MALES
32.0
MEDIAN AGE
2.7
AVG FAMILY SIZE
2.0
AVG HOUSEHOLD SIZE
40,400
LABOR FORCE [ PEOPLE ]
80.0%
PERCENT IN LABOR FORCE
3.5%
UNEMPLOYMENT RATE
Hoboken Zip Codes
Hoboken Area Codes
Income in Hoboken
Income Overview in Hoboken
Per Capita Income in Hoboken is $102,492, while median incomes of families and households are $236,742 and $168,137 respectively.
| Characteristic | Number | Measure |
| Per Capita Income | 58,754 | $102,492 |
| Median Family Income | 12,247 | $236,742 |
| Mean Family Income | 12,247 | $292,930 |
| Median Household Income | 27,879 | $168,137 |
| Mean Household Income | 27,879 | $217,330 |
| Income Deficit | 12,247 | $0 |
| Wage / Income Gap (%) | 58,754 | 19.65% |
| Wage / Income Gap ($) | 58,754 | 80.35¢ per $1 |
| Gini / Inequality Index | 58,754 | 0.47 |
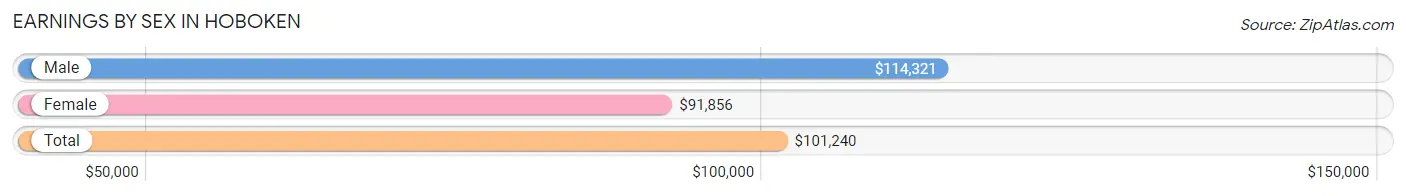
Earnings by Sex in Hoboken
Average Earnings in Hoboken are $101,240, $114,321 for men and $91,856 for women, a difference of 19.7%.
| Sex | Number | Average Earnings |
| Male | 21,296 (51.9%) | $114,321 |
| Female | 19,744 (48.1%) | $91,856 |
| Total | 41,040 (100.0%) | $101,240 |
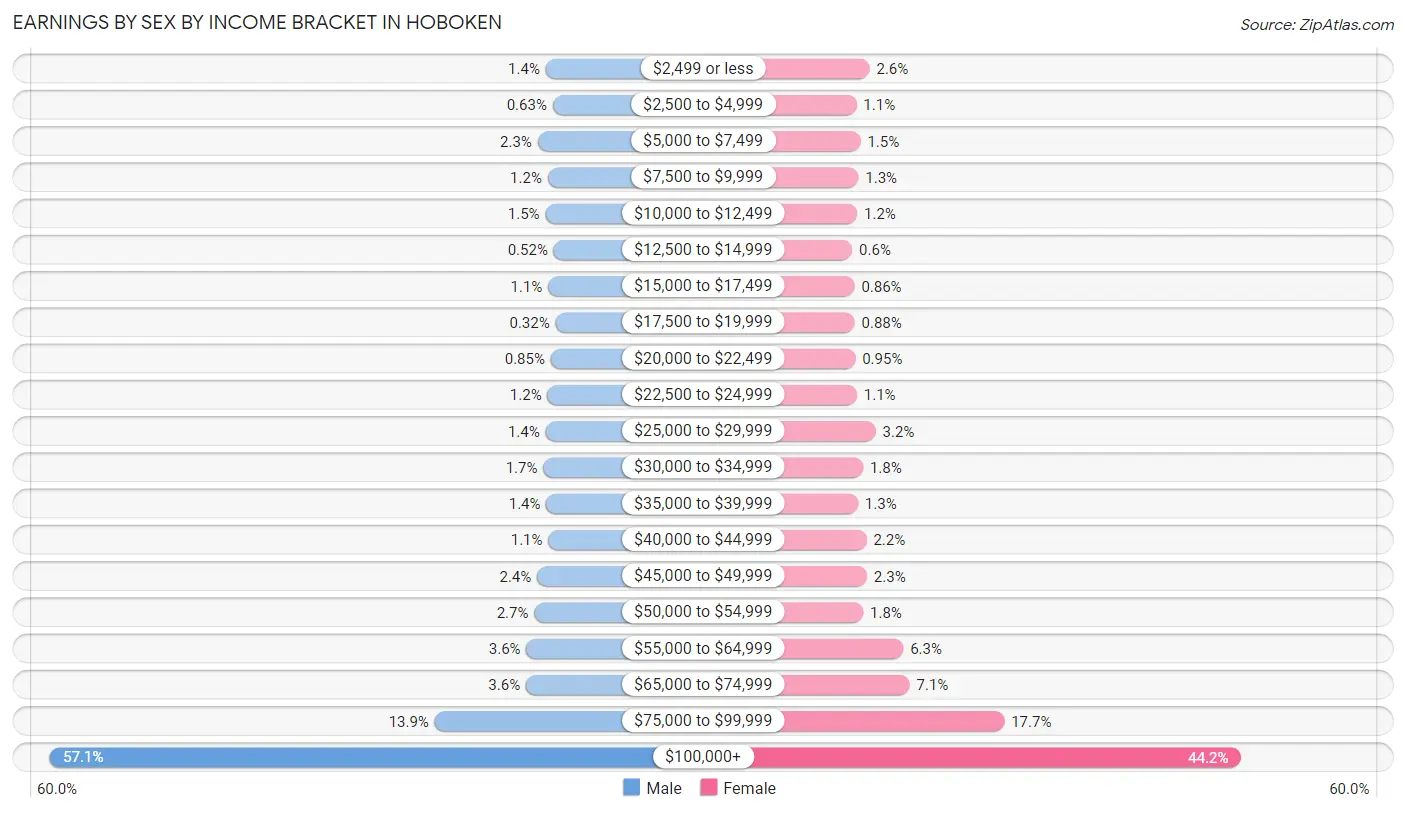
Earnings by Sex by Income Bracket in Hoboken
The most common earnings brackets in Hoboken are $100,000+ for men (12,167 | 57.1%) and $100,000+ for women (8,734 | 44.2%).
| Income | Male | Female |
| $2,499 or less | 303 (1.4%) | 505 (2.6%) |
| $2,500 to $4,999 | 134 (0.6%) | 213 (1.1%) |
| $5,000 to $7,499 | 494 (2.3%) | 304 (1.5%) |
| $7,500 to $9,999 | 253 (1.2%) | 257 (1.3%) |
| $10,000 to $12,499 | 308 (1.5%) | 229 (1.2%) |
| $12,500 to $14,999 | 110 (0.5%) | 118 (0.6%) |
| $15,000 to $17,499 | 243 (1.1%) | 169 (0.9%) |
| $17,500 to $19,999 | 68 (0.3%) | 174 (0.9%) |
| $20,000 to $22,499 | 182 (0.9%) | 187 (0.9%) |
| $22,500 to $24,999 | 259 (1.2%) | 223 (1.1%) |
| $25,000 to $29,999 | 306 (1.4%) | 640 (3.2%) |
| $30,000 to $34,999 | 359 (1.7%) | 359 (1.8%) |
| $35,000 to $39,999 | 287 (1.3%) | 247 (1.3%) |
| $40,000 to $44,999 | 239 (1.1%) | 437 (2.2%) |
| $45,000 to $49,999 | 508 (2.4%) | 446 (2.3%) |
| $50,000 to $54,999 | 576 (2.7%) | 361 (1.8%) |
| $55,000 to $64,999 | 765 (3.6%) | 1,252 (6.3%) |
| $65,000 to $74,999 | 775 (3.6%) | 1,394 (7.1%) |
| $75,000 to $99,999 | 2,960 (13.9%) | 3,495 (17.7%) |
| $100,000+ | 12,167 (57.1%) | 8,734 (44.2%) |
| Total | 21,296 (100.0%) | 19,744 (100.0%) |
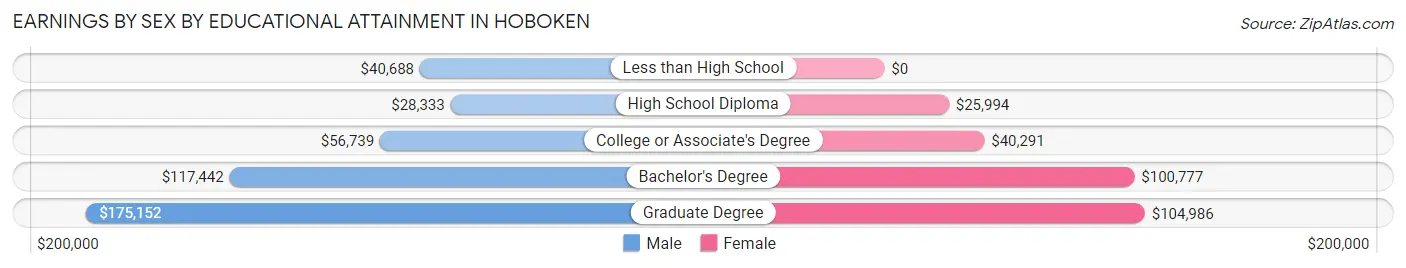
Earnings by Sex by Educational Attainment in Hoboken
Average earnings in Hoboken are $123,241 for men and $96,061 for women, a difference of 22.1%. Men with an educational attainment of graduate degree enjoy the highest average annual earnings of $175,152, while those with high school diploma education earn the least with $28,333. Women with an educational attainment of graduate degree earn the most with the average annual earnings of $104,986, while those with high school diploma education have the smallest earnings of $25,994.
| Educational Attainment | Male Income | Female Income |
| Less than High School | $40,688 | $0 |
| High School Diploma | $28,333 | $25,994 |
| College or Associate's Degree | $56,739 | $40,291 |
| Bachelor's Degree | $117,442 | $100,777 |
| Graduate Degree | $175,152 | $104,986 |
| Total | $123,241 | $96,061 |
Family Income in Hoboken
Family Income Brackets in Hoboken
According to the Hoboken family income data, there are 7,042 families falling into the $200,000+ income range, which is the most common income bracket and makes up 57.5% of all families. Conversely, the $10,000 to $14,999 income bracket is the least frequent group with only 37 families (0.3%) belonging to this category.
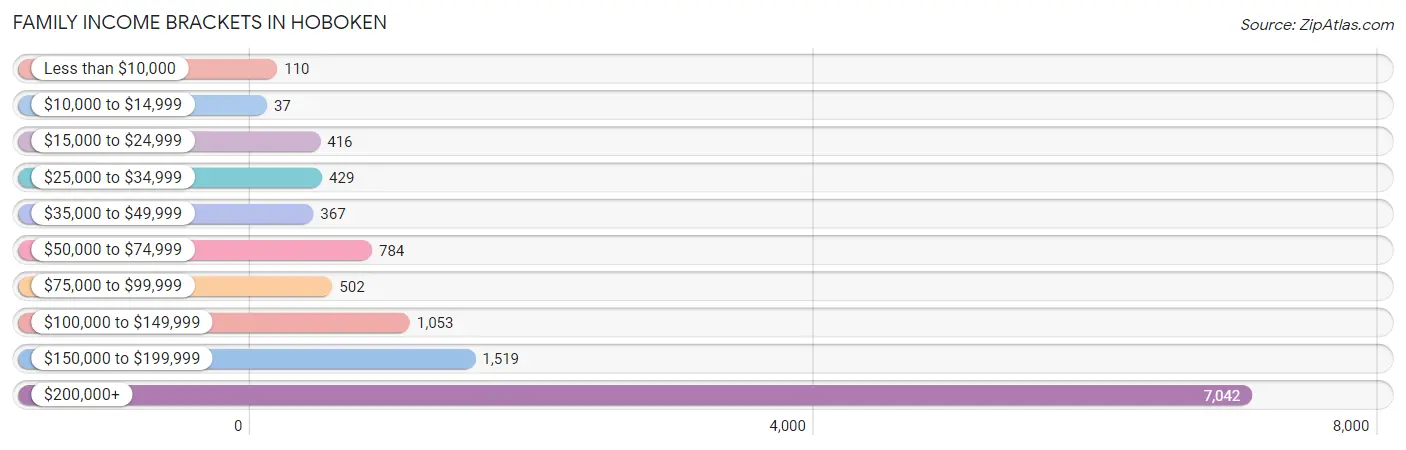
| Income Bracket | # Families | % Families |
| Less than $10,000 | 110 | 0.9% |
| $10,000 to $14,999 | 37 | 0.3% |
| $15,000 to $24,999 | 416 | 3.4% |
| $25,000 to $34,999 | 429 | 3.5% |
| $35,000 to $49,999 | 367 | 3.0% |
| $50,000 to $74,999 | 784 | 6.4% |
| $75,000 to $99,999 | 502 | 4.1% |
| $100,000 to $149,999 | 1,053 | 8.6% |
| $150,000 to $199,999 | 1,519 | 12.4% |
| $200,000+ | 7,042 | 57.5% |
Family Income by Famaliy Size in Hoboken
4-person families (2,112 | 17.2%) account for the highest median family income in Hoboken with $250,001 per family, while 2-person families (6,712 | 54.8%) have the highest median income of $103,125 per family member.
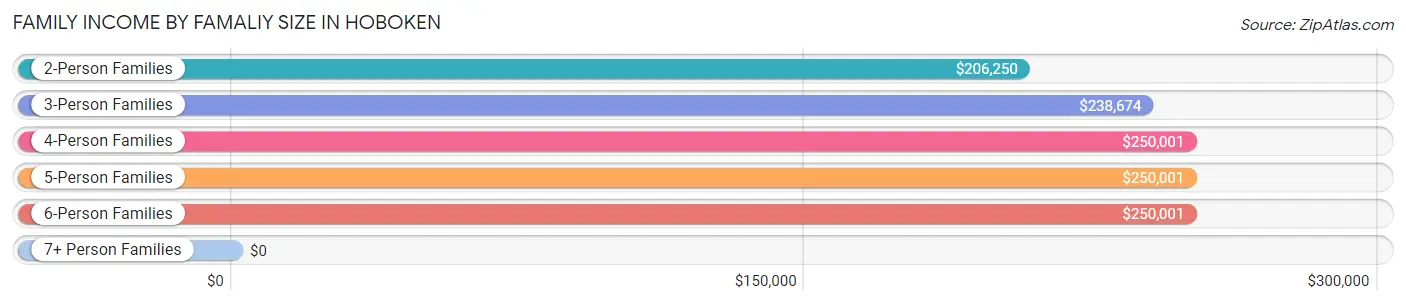
| Income Bracket | # Families | Median Income |
| 2-Person Families | 6,712 (54.8%) | $206,250 |
| 3-Person Families | 3,068 (25.1%) | $238,674 |
| 4-Person Families | 2,112 (17.2%) | $250,001 |
| 5-Person Families | 301 (2.5%) | $250,001 |
| 6-Person Families | 54 (0.4%) | $250,001 |
| 7+ Person Families | 0 (0.0%) | $0 |
| Total | 12,247 (100.0%) | $236,742 |
Family Income by Number of Earners in Hoboken
The median family income in Hoboken is $236,742, with families comprising 2 earners (7,876) having the highest median family income of $250,001, while families with no earners (624) have the lowest median family income of $39,167, accounting for 64.3% and 5.1% of families, respectively.
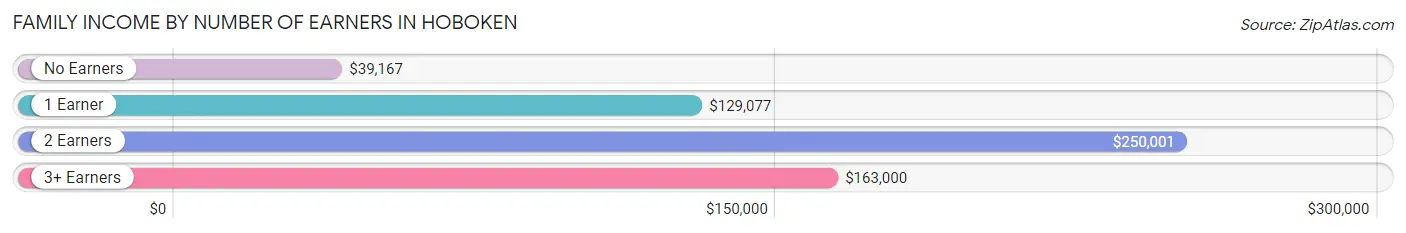
| Number of Earners | # Families | Median Income |
| No Earners | 624 (5.1%) | $39,167 |
| 1 Earner | 3,409 (27.8%) | $129,077 |
| 2 Earners | 7,876 (64.3%) | $250,001 |
| 3+ Earners | 338 (2.8%) | $163,000 |
| Total | 12,247 (100.0%) | $236,742 |
Household Income in Hoboken
Household Income Brackets in Hoboken
With 11,375 households falling in the category, the $200,000+ income range is the most frequent in Hoboken, accounting for 40.8% of all households. In contrast, only 753 households (2.7%) fall into the $10,000 to $14,999 income bracket, making it the least populous group.
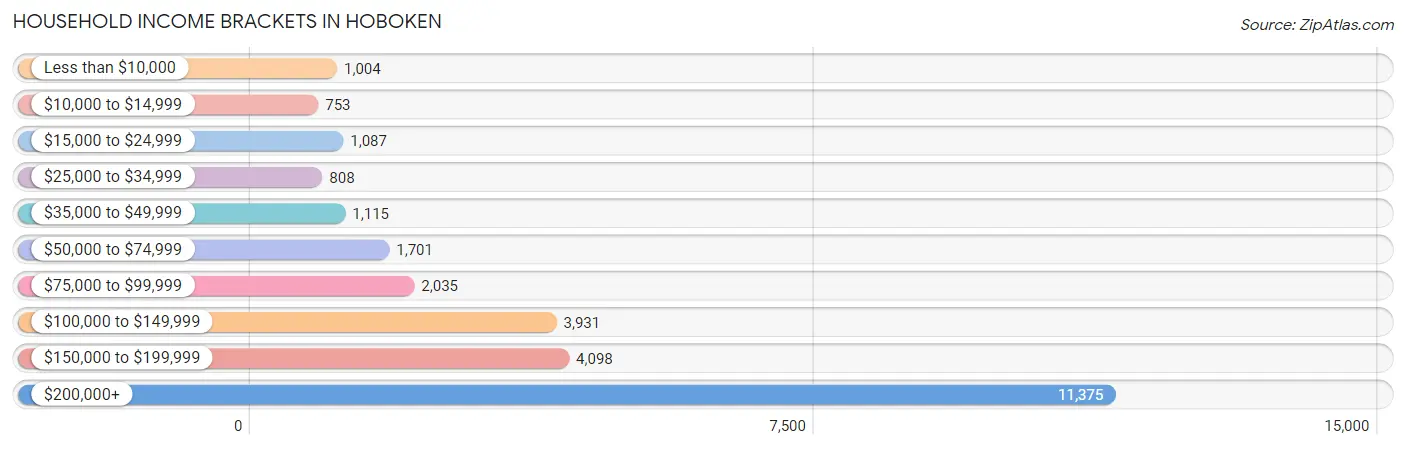
| Income Bracket | # Households | % Households |
| Less than $10,000 | 1,004 | 3.6% |
| $10,000 to $14,999 | 753 | 2.7% |
| $15,000 to $24,999 | 1,087 | 3.9% |
| $25,000 to $34,999 | 808 | 2.9% |
| $35,000 to $49,999 | 1,115 | 4.0% |
| $50,000 to $74,999 | 1,701 | 6.1% |
| $75,000 to $99,999 | 2,035 | 7.3% |
| $100,000 to $149,999 | 3,931 | 14.1% |
| $150,000 to $199,999 | 4,098 | 14.7% |
| $200,000+ | 11,375 | 40.8% |
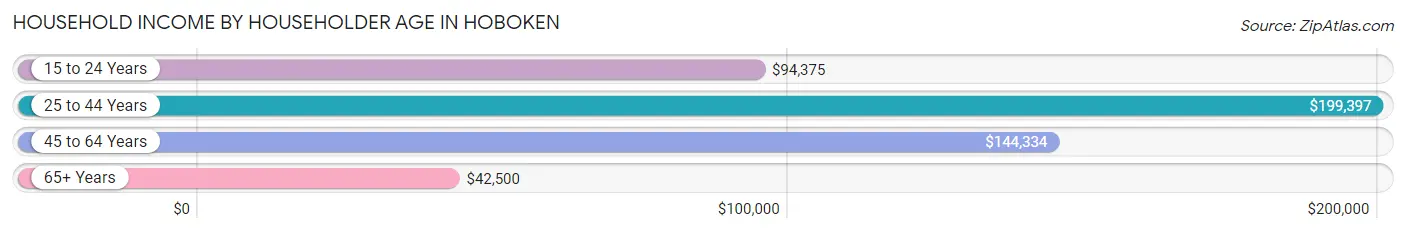
Household Income by Householder Age in Hoboken
The median household income in Hoboken is $168,137, with the highest median household income of $199,397 found in the 25 to 44 years age bracket for the primary householder. A total of 17,485 households (62.7%) fall into this category. Meanwhile, the 65+ years age bracket for the primary householder has the lowest median household income of $42,500, with 2,812 households (10.1%) in this group.
| Income Bracket | # Households | Median Income |
| 15 to 24 Years | 1,433 (5.1%) | $94,375 |
| 25 to 44 Years | 17,485 (62.7%) | $199,397 |
| 45 to 64 Years | 6,149 (22.1%) | $144,334 |
| 65+ Years | 2,812 (10.1%) | $42,500 |
| Total | 27,879 (100.0%) | $168,137 |
Poverty in Hoboken
Income Below Poverty by Sex and Age in Hoboken
With 8.4% poverty level for males and 7.4% for females among the residents of Hoboken, 18 to 24 year old males and 18 to 24 year old females are the most vulnerable to poverty, with 1,068 males (41.1%) and 363 females (22.6%) in their respective age groups living below the poverty level.
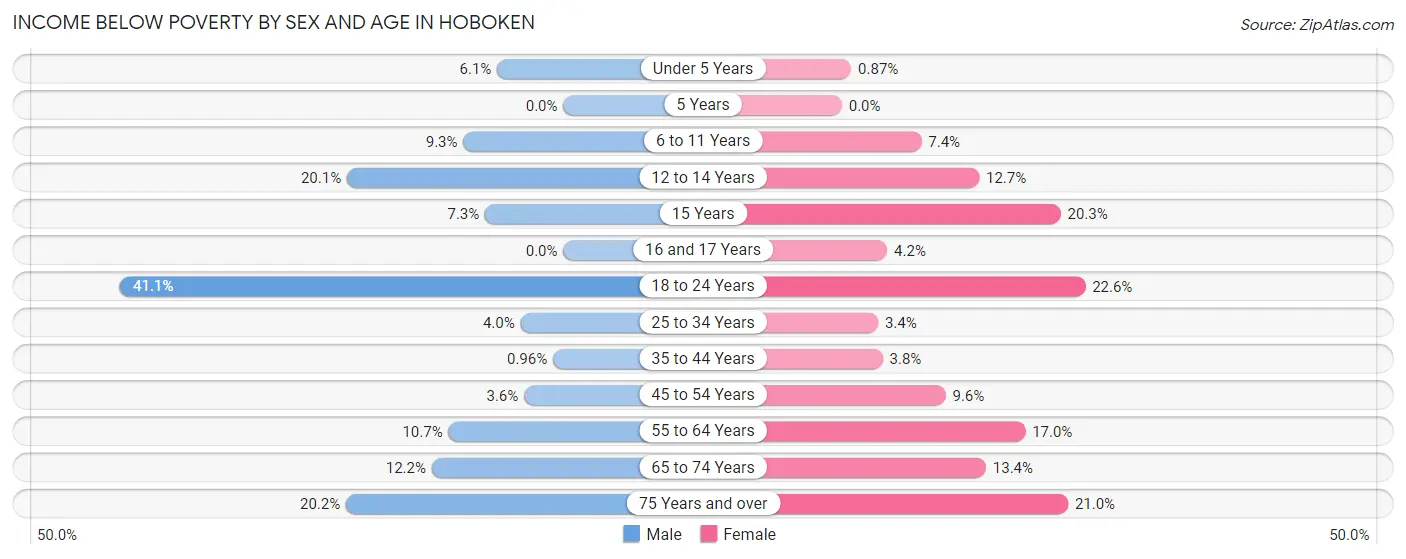
| Age Bracket | Male | Female |
| Under 5 Years | 118 (6.1%) | 19 (0.9%) |
| 5 Years | 0 (0.0%) | 0 (0.0%) |
| 6 to 11 Years | 93 (9.3%) | 86 (7.4%) |
| 12 to 14 Years | 100 (20.1%) | 60 (12.7%) |
| 15 Years | 9 (7.3%) | 41 (20.3%) |
| 16 and 17 Years | 0 (0.0%) | 11 (4.2%) |
| 18 to 24 Years | 1,068 (41.1%) | 363 (22.6%) |
| 25 to 34 Years | 389 (4.0%) | 350 (3.4%) |
| 35 to 44 Years | 54 (1.0%) | 203 (3.8%) |
| 45 to 54 Years | 100 (3.6%) | 237 (9.6%) |
| 55 to 64 Years | 171 (10.7%) | 405 (17.0%) |
| 65 to 74 Years | 121 (12.2%) | 148 (13.4%) |
| 75 Years and over | 116 (20.2%) | 249 (21.0%) |
| Total | 2,339 (8.4%) | 2,172 (7.4%) |
Income Above Poverty by Sex and Age in Hoboken
According to the poverty statistics in Hoboken, males aged 5 years and females aged 5 years are the age groups that are most secure financially, with 100.0% of males and 100.0% of females in these age groups living above the poverty line.
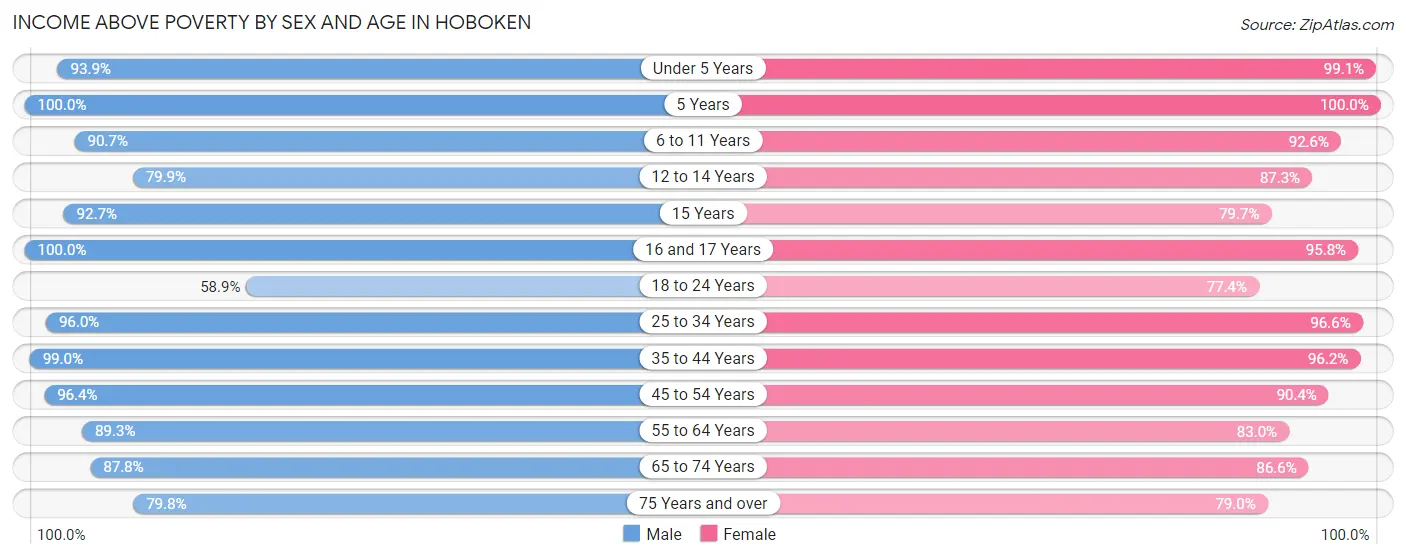
| Age Bracket | Male | Female |
| Under 5 Years | 1,803 (93.9%) | 2,160 (99.1%) |
| 5 Years | 320 (100.0%) | 372 (100.0%) |
| 6 to 11 Years | 909 (90.7%) | 1,079 (92.6%) |
| 12 to 14 Years | 398 (79.9%) | 411 (87.3%) |
| 15 Years | 115 (92.7%) | 161 (79.7%) |
| 16 and 17 Years | 92 (100.0%) | 250 (95.8%) |
| 18 to 24 Years | 1,528 (58.9%) | 1,244 (77.4%) |
| 25 to 34 Years | 9,412 (96.0%) | 10,057 (96.6%) |
| 35 to 44 Years | 5,564 (99.0%) | 5,156 (96.2%) |
| 45 to 54 Years | 2,645 (96.4%) | 2,225 (90.4%) |
| 55 to 64 Years | 1,433 (89.3%) | 1,974 (83.0%) |
| 65 to 74 Years | 870 (87.8%) | 959 (86.6%) |
| 75 Years and over | 459 (79.8%) | 937 (79.0%) |
| Total | 25,548 (91.6%) | 26,985 (92.5%) |
Income Below Poverty Among Married-Couple Families in Hoboken
The poverty statistics for married-couple families in Hoboken show that 1.1% or 112 of the total 9,866 families live below the poverty line. Families with no children have the highest poverty rate of 1.6%, comprising of 90 families. On the other hand, families with 3 or 4 children have the lowest poverty rate of 0.0%, which includes 0 families.
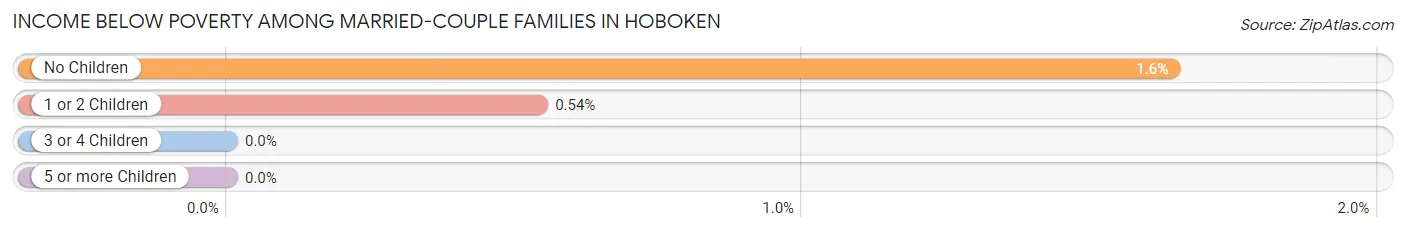
| Children | Above Poverty | Below Poverty |
| No Children | 5,395 (98.4%) | 90 (1.6%) |
| 1 or 2 Children | 4,070 (99.5%) | 22 (0.5%) |
| 3 or 4 Children | 289 (100.0%) | 0 (0.0%) |
| 5 or more Children | 0 (0.0%) | 0 (0.0%) |
| Total | 9,754 (98.9%) | 112 (1.1%) |
Income Below Poverty Among Single-Parent Households in Hoboken
According to the poverty data in Hoboken, 3.8% or 19 single-father households and 10.2% or 192 single-mother households are living below the poverty line. Among single-father households, those with 1 or 2 children have the highest poverty rate, with 19 households (8.1%) experiencing poverty. Likewise, among single-mother households, those with 3 or 4 children have the highest poverty rate, with 111 households (71.2%) falling below the poverty line.
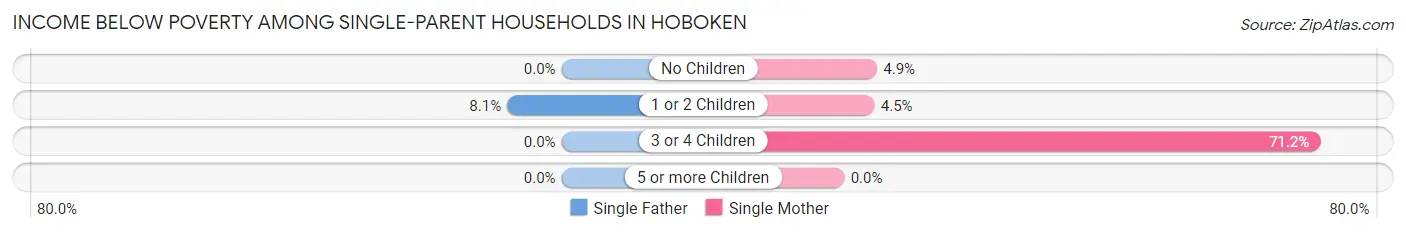
| Children | Single Father | Single Mother |
| No Children | 0 (0.0%) | 45 (4.9%) |
| 1 or 2 Children | 19 (8.1%) | 36 (4.5%) |
| 3 or 4 Children | 0 (0.0%) | 111 (71.2%) |
| 5 or more Children | 0 (0.0%) | 0 (0.0%) |
| Total | 19 (3.8%) | 192 (10.2%) |
Income Below Poverty Among Married-Couple vs Single-Parent Households in Hoboken
The poverty data for Hoboken shows that 112 of the married-couple family households (1.1%) and 211 of the single-parent households (8.9%) are living below the poverty level. Within the married-couple family households, those with no children have the highest poverty rate, with 90 households (1.6%) falling below the poverty line. Among the single-parent households, those with 3 or 4 children have the highest poverty rate, with 111 household (71.2%) living below poverty.
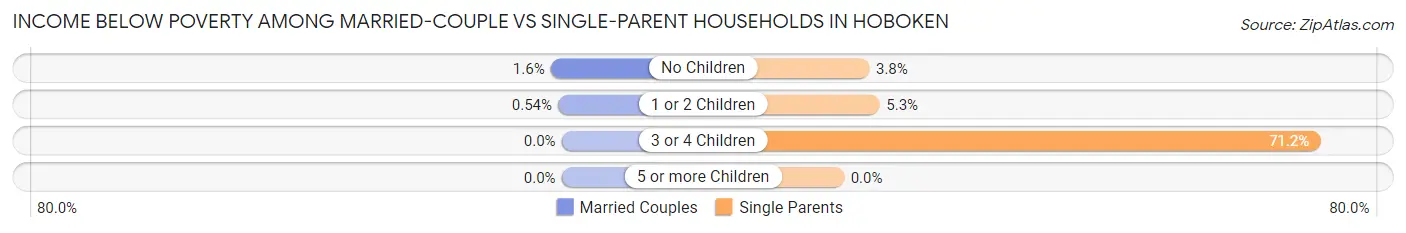
| Children | Married-Couple Families | Single-Parent Households |
| No Children | 90 (1.6%) | 45 (3.8%) |
| 1 or 2 Children | 22 (0.5%) | 55 (5.3%) |
| 3 or 4 Children | 0 (0.0%) | 111 (71.2%) |
| 5 or more Children | 0 (0.0%) | 0 (0.0%) |
| Total | 112 (1.1%) | 211 (8.9%) |
Race in Hoboken
The most populous races in Hoboken are White / Caucasian (40,924 | 69.7%), Hispanic or Latino (9,366 | 15.9%), and Asian (7,419 | 12.6%).
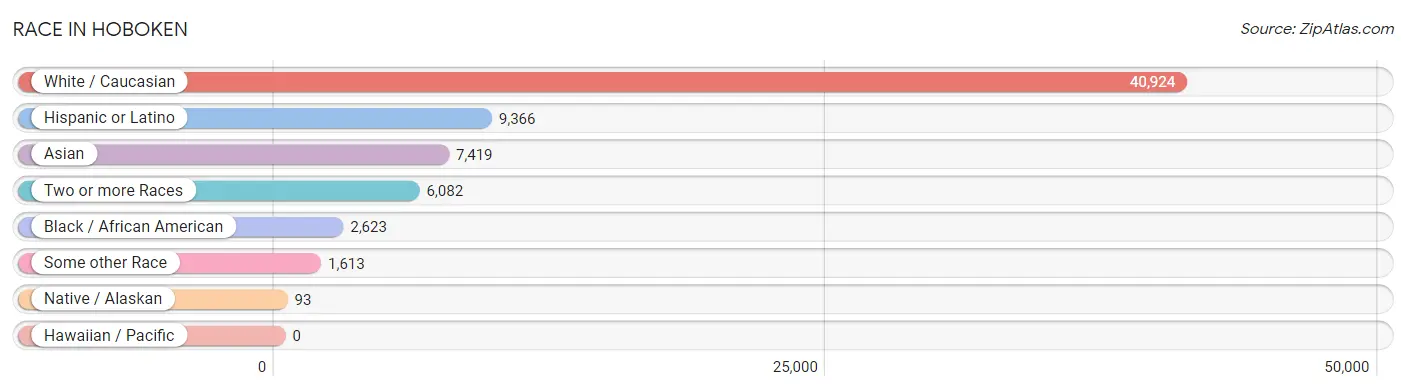
| Race | # Population | % Population |
| Asian | 7,419 | 12.6% |
| Black / African American | 2,623 | 4.5% |
| Hawaiian / Pacific | 0 | 0.0% |
| Hispanic or Latino | 9,366 | 15.9% |
| Native / Alaskan | 93 | 0.2% |
| White / Caucasian | 40,924 | 69.7% |
| Two or more Races | 6,082 | 10.3% |
| Some other Race | 1,613 | 2.8% |
| Total | 58,754 | 100.0% |
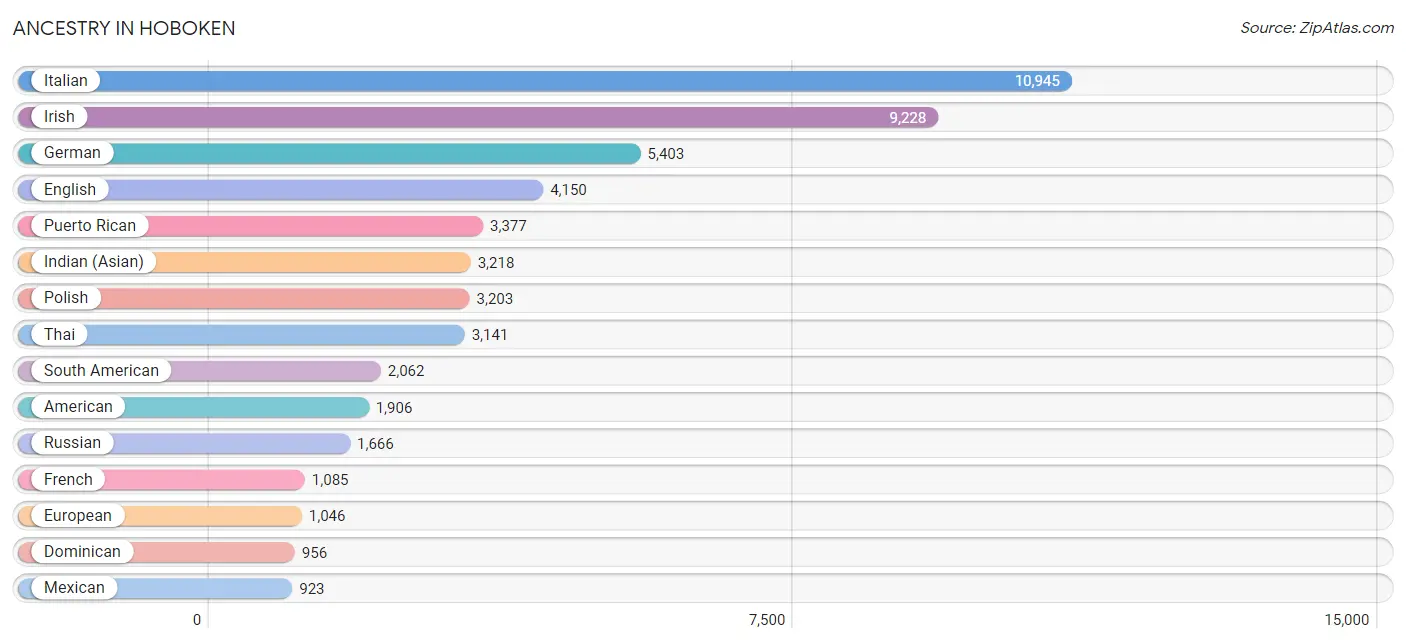
Ancestry in Hoboken
The most populous ancestries reported in Hoboken are Italian (10,945 | 18.6%), Irish (9,228 | 15.7%), German (5,403 | 9.2%), English (4,150 | 7.1%), and Puerto Rican (3,377 | 5.8%), together accounting for 56.4% of all Hoboken residents.
| Ancestry | # Population | % Population |
| African | 101 | 0.2% |
| Albanian | 19 | 0.0% |
| Alsatian | 10 | 0.0% |
| American | 1,906 | 3.2% |
| Arab | 810 | 1.4% |
| Argentinean | 421 | 0.7% |
| Armenian | 112 | 0.2% |
| Assyrian / Chaldean / Syriac | 12 | 0.0% |
| Australian | 44 | 0.1% |
| Austrian | 241 | 0.4% |
| Bahamian | 17 | 0.0% |
| Belgian | 141 | 0.2% |
| Bhutanese | 158 | 0.3% |
| Bolivian | 45 | 0.1% |
| Brazilian | 386 | 0.7% |
| British | 406 | 0.7% |
| Bulgarian | 67 | 0.1% |
| Burmese | 543 | 0.9% |
| Canadian | 39 | 0.1% |
| Central American | 391 | 0.7% |
| Central American Indian | 42 | 0.1% |
| Chilean | 22 | 0.0% |
| Colombian | 652 | 1.1% |
| Costa Rican | 6 | 0.0% |
| Croatian | 93 | 0.2% |
| Cuban | 675 | 1.1% |
| Czech | 100 | 0.2% |
| Czechoslovakian | 53 | 0.1% |
| Danish | 95 | 0.2% |
| Delaware | 26 | 0.0% |
| Dominican | 956 | 1.6% |
| Dutch | 645 | 1.1% |
| Eastern European | 839 | 1.4% |
| Ecuadorian | 647 | 1.1% |
| Egyptian | 234 | 0.4% |
| English | 4,150 | 7.1% |
| Estonian | 15 | 0.0% |
| European | 1,046 | 1.8% |
| Filipino | 161 | 0.3% |
| Finnish | 39 | 0.1% |
| French | 1,085 | 1.8% |
| French Canadian | 100 | 0.2% |
| German | 5,403 | 9.2% |
| Ghanaian | 120 | 0.2% |
| Greek | 439 | 0.7% |
| Guatemalan | 66 | 0.1% |
| Guyanese | 22 | 0.0% |
| Haitian | 43 | 0.1% |
| Honduran | 168 | 0.3% |
| Hungarian | 339 | 0.6% |
| Indian (Asian) | 3,218 | 5.5% |
| Iranian | 139 | 0.2% |
| Iraqi | 102 | 0.2% |
| Irish | 9,228 | 15.7% |
| Israeli | 243 | 0.4% |
| Italian | 10,945 | 18.6% |
| Jamaican | 203 | 0.4% |
| Japanese | 15 | 0.0% |
| Jordanian | 21 | 0.0% |
| Korean | 849 | 1.5% |
| Laotian | 71 | 0.1% |
| Latvian | 33 | 0.1% |
| Lebanese | 138 | 0.2% |
| Lithuanian | 160 | 0.3% |
| Macedonian | 34 | 0.1% |
| Mexican | 923 | 1.6% |
| Mexican American Indian | 22 | 0.0% |
| Moroccan | 195 | 0.3% |
| Native Hawaiian | 10 | 0.0% |
| New Zealander | 4 | 0.0% |
| Northern European | 19 | 0.0% |
| Norwegian | 481 | 0.8% |
| Pakistani | 61 | 0.1% |
| Palestinian | 5 | 0.0% |
| Panamanian | 51 | 0.1% |
| Pennsylvania German | 36 | 0.1% |
| Peruvian | 166 | 0.3% |
| Polish | 3,203 | 5.4% |
| Portuguese | 271 | 0.5% |
| Potawatomi | 46 | 0.1% |
| Puerto Rican | 3,377 | 5.8% |
| Romanian | 145 | 0.3% |
| Russian | 1,666 | 2.8% |
| Salvadoran | 100 | 0.2% |
| Scandinavian | 43 | 0.1% |
| Scotch-Irish | 76 | 0.1% |
| Scottish | 530 | 0.9% |
| Serbian | 228 | 0.4% |
| Slovak | 91 | 0.2% |
| Slovene | 6 | 0.0% |
| South African | 34 | 0.1% |
| South American | 2,062 | 3.5% |
| South American Indian | 65 | 0.1% |
| Spaniard | 586 | 1.0% |
| Spanish | 106 | 0.2% |
| Sri Lankan | 150 | 0.3% |
| Subsaharan African | 335 | 0.6% |
| Swedish | 634 | 1.1% |
| Swiss | 78 | 0.1% |
| Syrian | 23 | 0.0% |
| Thai | 3,141 | 5.3% |
| Tlingit-Haida | 24 | 0.0% |
| Trinidadian and Tobagonian | 11 | 0.0% |
| Turkish | 113 | 0.2% |
| Ukrainian | 438 | 0.7% |
| Uruguayan | 12 | 0.0% |
| Venezuelan | 97 | 0.2% |
| Vietnamese | 99 | 0.2% |
| Welsh | 227 | 0.4% |
| West Indian | 79 | 0.1% |
| Yugoslavian | 6 | 0.0% |
| Zimbabwean | 61 | 0.1% | View All 112 Rows |
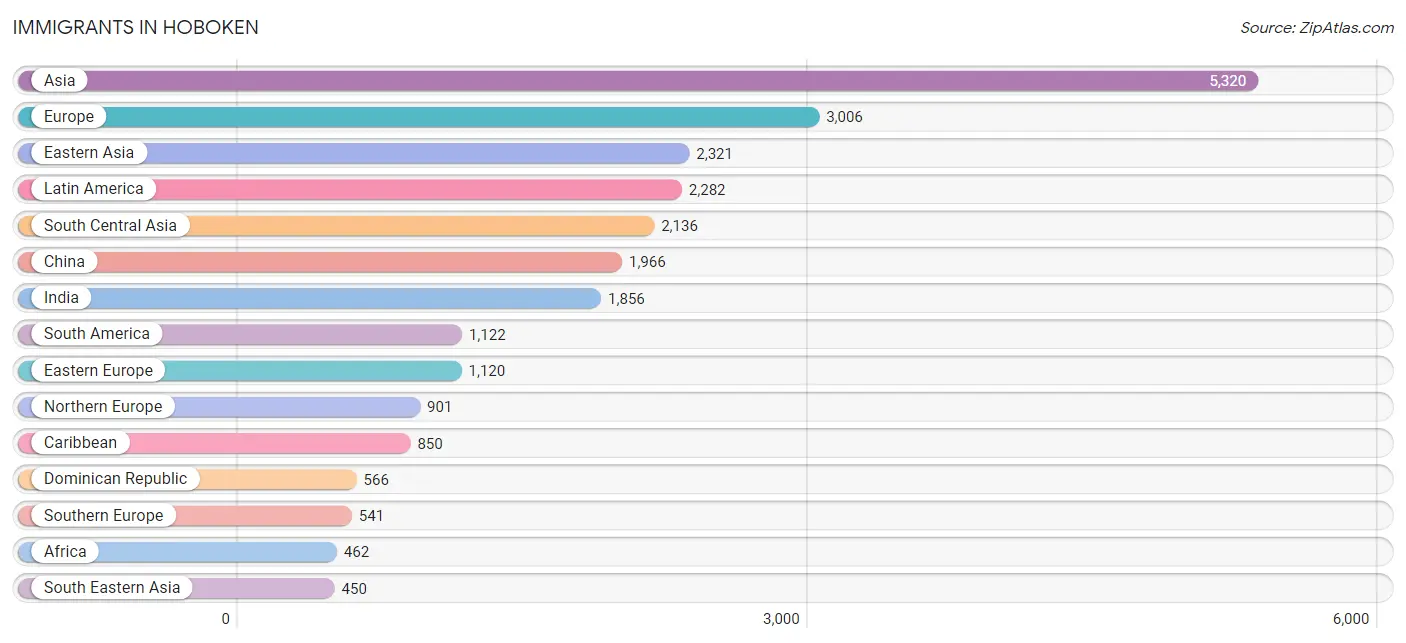
Immigrants in Hoboken
The most numerous immigrant groups reported in Hoboken came from Asia (5,320 | 9.0%), Europe (3,006 | 5.1%), Eastern Asia (2,321 | 4.0%), Latin America (2,282 | 3.9%), and South Central Asia (2,136 | 3.6%), together accounting for 25.6% of all Hoboken residents.
| Immigration Origin | # Population | % Population |
| Africa | 462 | 0.8% |
| Argentina | 207 | 0.4% |
| Asia | 5,320 | 9.0% |
| Australia | 77 | 0.1% |
| Bahamas | 17 | 0.0% |
| Bangladesh | 84 | 0.1% |
| Belarus | 73 | 0.1% |
| Belgium | 34 | 0.1% |
| Bolivia | 9 | 0.0% |
| Bosnia and Herzegovina | 55 | 0.1% |
| Brazil | 264 | 0.4% |
| Bulgaria | 56 | 0.1% |
| Canada | 397 | 0.7% |
| Caribbean | 850 | 1.5% |
| Central America | 310 | 0.5% |
| China | 1,966 | 3.4% |
| Colombia | 140 | 0.2% |
| Croatia | 40 | 0.1% |
| Cuba | 233 | 0.4% |
| Denmark | 26 | 0.0% |
| Dominican Republic | 566 | 1.0% |
| Eastern Africa | 99 | 0.2% |
| Eastern Asia | 2,321 | 4.0% |
| Eastern Europe | 1,120 | 1.9% |
| Ecuador | 266 | 0.4% |
| Egypt | 156 | 0.3% |
| El Salvador | 50 | 0.1% |
| England | 212 | 0.4% |
| Europe | 3,006 | 5.1% |
| France | 123 | 0.2% |
| Germany | 229 | 0.4% |
| Ghana | 72 | 0.1% |
| Greece | 29 | 0.1% |
| Guatemala | 24 | 0.0% |
| Guyana | 22 | 0.0% |
| Haiti | 1 | 0.0% |
| Honduras | 27 | 0.1% |
| Hong Kong | 146 | 0.3% |
| Hungary | 86 | 0.2% |
| India | 1,856 | 3.2% |
| Indonesia | 43 | 0.1% |
| Iran | 93 | 0.2% |
| Iraq | 8 | 0.0% |
| Ireland | 155 | 0.3% |
| Israel | 316 | 0.5% |
| Italy | 407 | 0.7% |
| Jamaica | 16 | 0.0% |
| Japan | 99 | 0.2% |
| Korea | 256 | 0.4% |
| Latin America | 2,282 | 3.9% |
| Lebanon | 16 | 0.0% |
| Lithuania | 14 | 0.0% |
| Malaysia | 15 | 0.0% |
| Mexico | 209 | 0.4% |
| Moldova | 8 | 0.0% |
| Morocco | 29 | 0.1% |
| Netherlands | 51 | 0.1% |
| North Macedonia | 12 | 0.0% |
| Northern Africa | 194 | 0.3% |
| Northern Europe | 901 | 1.5% |
| Oceania | 91 | 0.2% |
| Pakistan | 43 | 0.1% |
| Peru | 99 | 0.2% |
| Philippines | 255 | 0.4% |
| Poland | 168 | 0.3% |
| Romania | 68 | 0.1% |
| Russia | 210 | 0.4% |
| Serbia | 108 | 0.2% |
| Singapore | 9 | 0.0% |
| South Africa | 97 | 0.2% |
| South America | 1,122 | 1.9% |
| South Central Asia | 2,136 | 3.6% |
| South Eastern Asia | 450 | 0.8% |
| Southern Europe | 541 | 0.9% |
| Spain | 105 | 0.2% |
| Sri Lanka | 26 | 0.0% |
| Sweden | 37 | 0.1% |
| Taiwan | 244 | 0.4% |
| Trinidad and Tobago | 17 | 0.0% |
| Turkey | 60 | 0.1% |
| Uganda | 28 | 0.1% |
| Ukraine | 141 | 0.2% |
| Uruguay | 12 | 0.0% |
| Uzbekistan | 13 | 0.0% |
| Venezuela | 103 | 0.2% |
| Vietnam | 128 | 0.2% |
| Western Africa | 72 | 0.1% |
| Western Asia | 413 | 0.7% |
| Western Europe | 437 | 0.7% |
| Zimbabwe | 71 | 0.1% | View All 90 Rows |
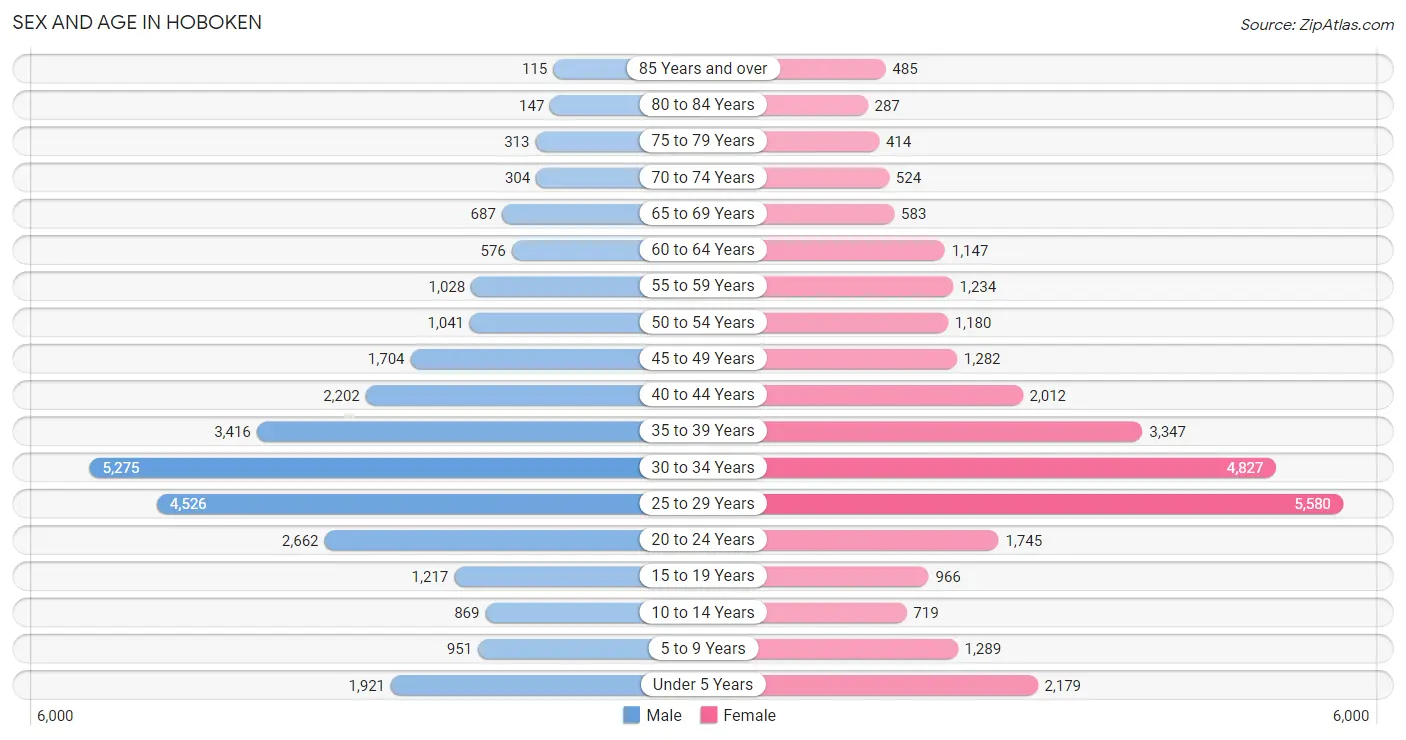
Sex and Age in Hoboken
Sex and Age in Hoboken
The most populous age groups in Hoboken are 30 to 34 Years (5,275 | 18.2%) for men and 25 to 29 Years (5,580 | 18.7%) for women.
| Age Bracket | Male | Female |
| Under 5 Years | 1,921 (6.6%) | 2,179 (7.3%) |
| 5 to 9 Years | 951 (3.3%) | 1,289 (4.3%) |
| 10 to 14 Years | 869 (3.0%) | 719 (2.4%) |
| 15 to 19 Years | 1,217 (4.2%) | 966 (3.2%) |
| 20 to 24 Years | 2,662 (9.2%) | 1,745 (5.9%) |
| 25 to 29 Years | 4,526 (15.6%) | 5,580 (18.7%) |
| 30 to 34 Years | 5,275 (18.2%) | 4,827 (16.2%) |
| 35 to 39 Years | 3,416 (11.8%) | 3,347 (11.2%) |
| 40 to 44 Years | 2,202 (7.6%) | 2,012 (6.8%) |
| 45 to 49 Years | 1,704 (5.9%) | 1,282 (4.3%) |
| 50 to 54 Years | 1,041 (3.6%) | 1,180 (4.0%) |
| 55 to 59 Years | 1,028 (3.5%) | 1,234 (4.1%) |
| 60 to 64 Years | 576 (2.0%) | 1,147 (3.8%) |
| 65 to 69 Years | 687 (2.4%) | 583 (2.0%) |
| 70 to 74 Years | 304 (1.1%) | 524 (1.8%) |
| 75 to 79 Years | 313 (1.1%) | 414 (1.4%) |
| 80 to 84 Years | 147 (0.5%) | 287 (1.0%) |
| 85 Years and over | 115 (0.4%) | 485 (1.6%) |
| Total | 28,954 (100.0%) | 29,800 (100.0%) |
Families and Households in Hoboken
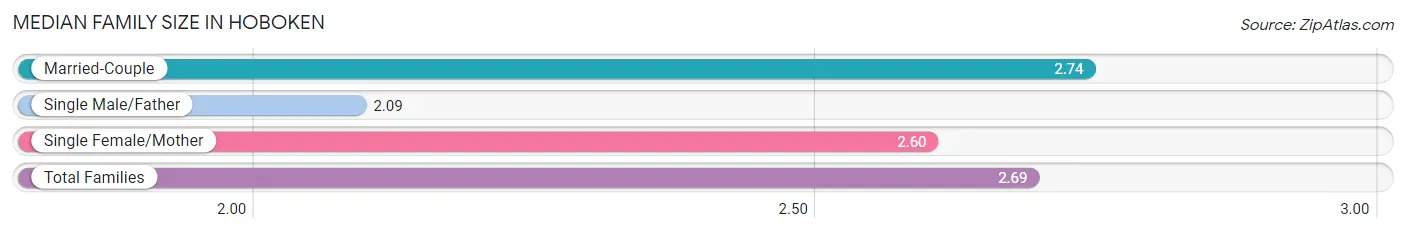
Median Family Size in Hoboken
The median family size in Hoboken is 2.69 persons per family, with married-couple families (9,866 | 80.6%) accounting for the largest median family size of 2.74 persons per family. On the other hand, single male/father families (501 | 4.1%) represent the smallest median family size with 2.09 persons per family.
| Family Type | # Families | Family Size |
| Married-Couple | 9,866 (80.6%) | 2.74 |
| Single Male/Father | 501 (4.1%) | 2.09 |
| Single Female/Mother | 1,880 (15.3%) | 2.60 |
| Total Families | 12,247 (100.0%) | 2.69 |
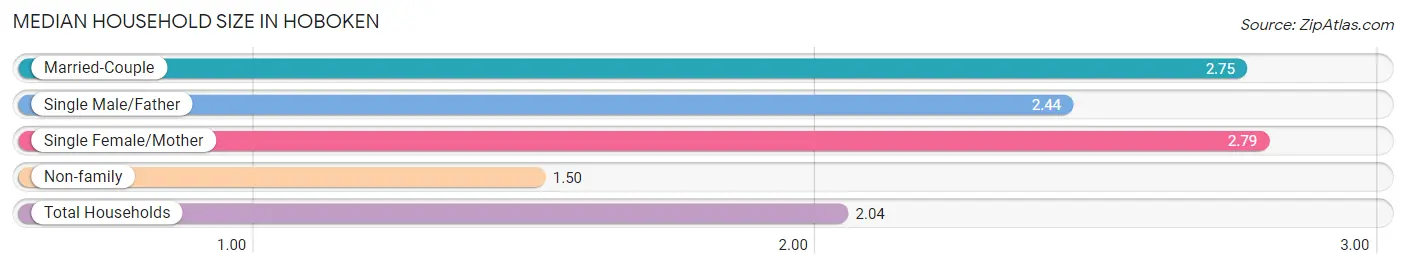
Median Household Size in Hoboken
The median household size in Hoboken is 2.04 persons per household, with single female/mother households (1,880 | 6.7%) accounting for the largest median household size of 2.79 persons per household. non-family households (15,632 | 56.1%) represent the smallest median household size with 1.50 persons per household.
| Household Type | # Households | Household Size |
| Married-Couple | 9,866 (35.4%) | 2.75 |
| Single Male/Father | 501 (1.8%) | 2.44 |
| Single Female/Mother | 1,880 (6.7%) | 2.79 |
| Non-family | 15,632 (56.1%) | 1.50 |
| Total Households | 27,879 (100.0%) | 2.04 |
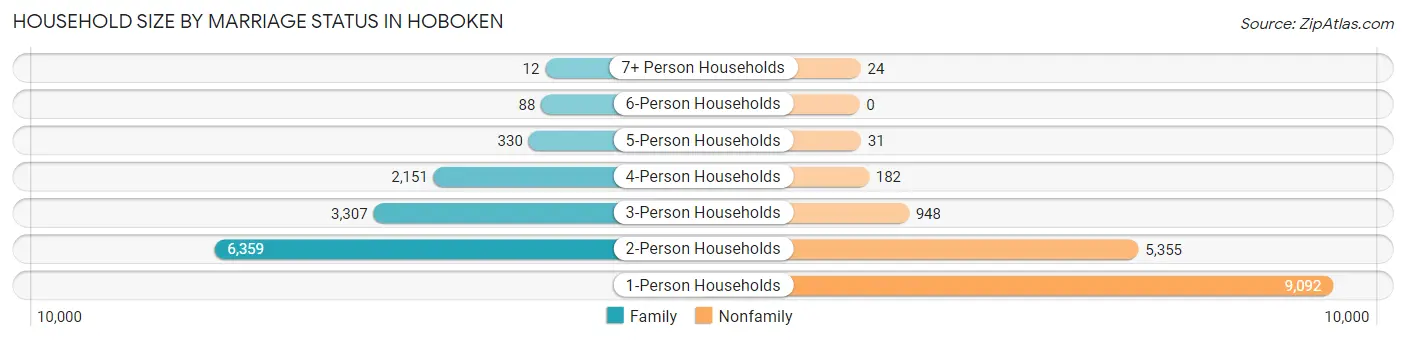
Household Size by Marriage Status in Hoboken
Out of a total of 27,879 households in Hoboken, 12,247 (43.9%) are family households, while 15,632 (56.1%) are nonfamily households. The most numerous type of family households are 2-person households, comprising 6,359, and the most common type of nonfamily households are 1-person households, comprising 9,092.
| Household Size | Family Households | Nonfamily Households |
| 1-Person Households | - | 9,092 (32.6%) |
| 2-Person Households | 6,359 (22.8%) | 5,355 (19.2%) |
| 3-Person Households | 3,307 (11.9%) | 948 (3.4%) |
| 4-Person Households | 2,151 (7.7%) | 182 (0.6%) |
| 5-Person Households | 330 (1.2%) | 31 (0.1%) |
| 6-Person Households | 88 (0.3%) | 0 (0.0%) |
| 7+ Person Households | 12 (0.0%) | 24 (0.1%) |
| Total | 12,247 (43.9%) | 15,632 (56.1%) |
Female Fertility in Hoboken
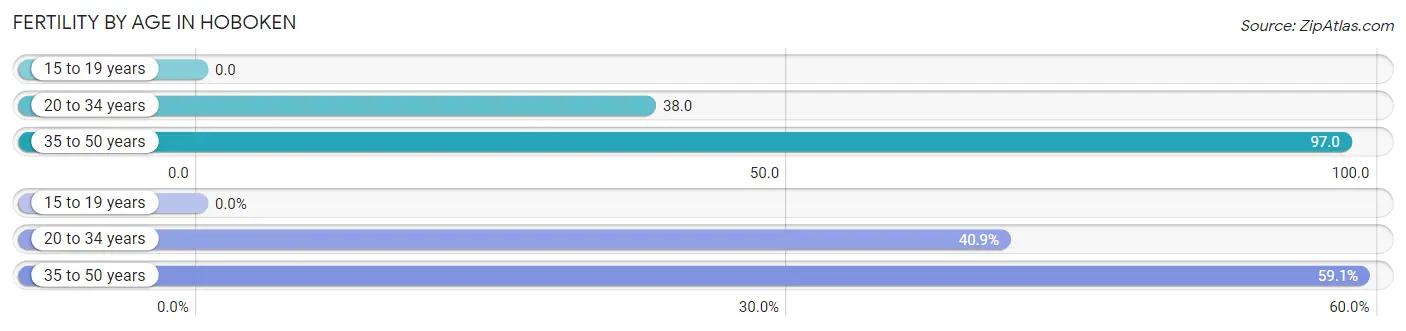
Fertility by Age in Hoboken
Average fertility rate in Hoboken is 57.0 births per 1,000 women. Women in the age bracket of 35 to 50 years have the highest fertility rate with 97.0 births per 1,000 women. Women in the age bracket of 35 to 50 years acount for 59.1% of all women with births.
| Age Bracket | Women with Births | Births / 1,000 Women |
| 15 to 19 years | 0 (0.0%) | 0.0 |
| 20 to 34 years | 465 (40.9%) | 38.0 |
| 35 to 50 years | 673 (59.1%) | 97.0 |
| Total | 1,138 (100.0%) | 57.0 |
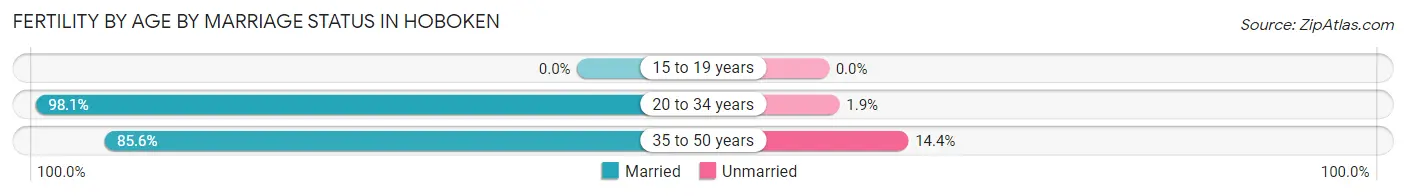
Fertility by Age by Marriage Status in Hoboken
90.7% of women with births (1,138) in Hoboken are married. The highest percentage of unmarried women with births falls into 35 to 50 years age bracket with 14.4% of them unmarried at the time of birth, while the lowest percentage of unmarried women with births belong to 20 to 34 years age bracket with 1.9% of them unmarried.
| Age Bracket | Married | Unmarried |
| 15 to 19 years | 0 (0.0%) | 0 (0.0%) |
| 20 to 34 years | 456 (98.1%) | 9 (1.9%) |
| 35 to 50 years | 576 (85.6%) | 97 (14.4%) |
| Total | 1,032 (90.7%) | 106 (9.3%) |
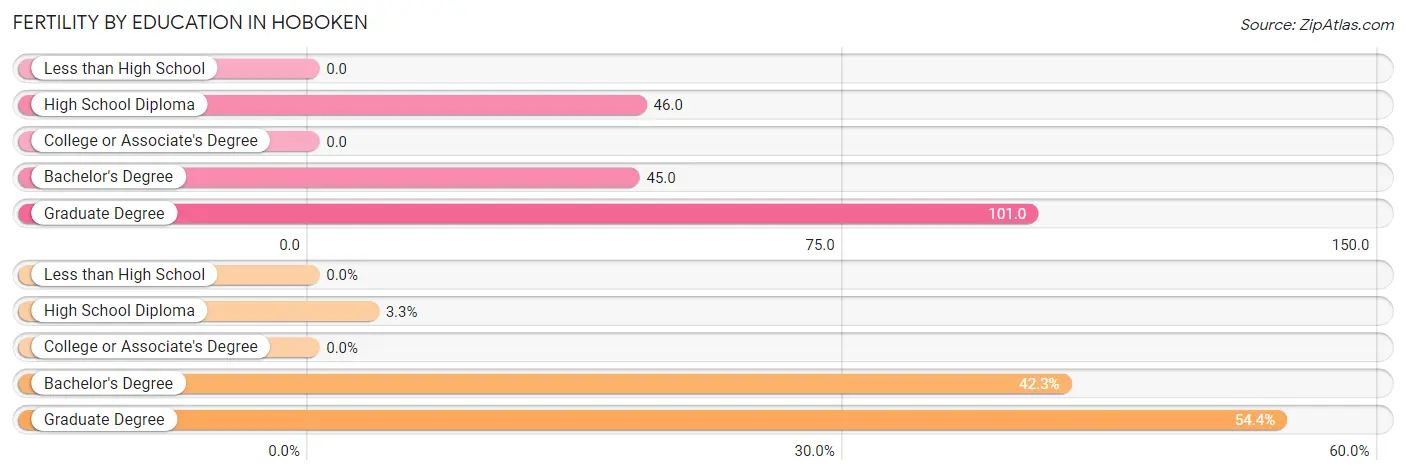
Fertility by Education in Hoboken
| Educational Attainment | Women with Births | Births / 1,000 Women |
| Less than High School | 0 (0.0%) | 0.0 |
| High School Diploma | 38 (3.3%) | 46.0 |
| College or Associate's Degree | 0 (0.0%) | 0.0 |
| Bachelor's Degree | 481 (42.3%) | 45.0 |
| Graduate Degree | 619 (54.4%) | 101.0 |
| Total | 1,138 (100.0%) | 57.0 |
Fertility by Education by Marriage Status in Hoboken
9.3% of women with births in Hoboken are unmarried. Women with the educational attainment of high school diploma are most likely to be married with 100.0% of them married at childbirth, while women with the educational attainment of graduate degree are least likely to be married with 14.5% of them unmarried at childbirth.
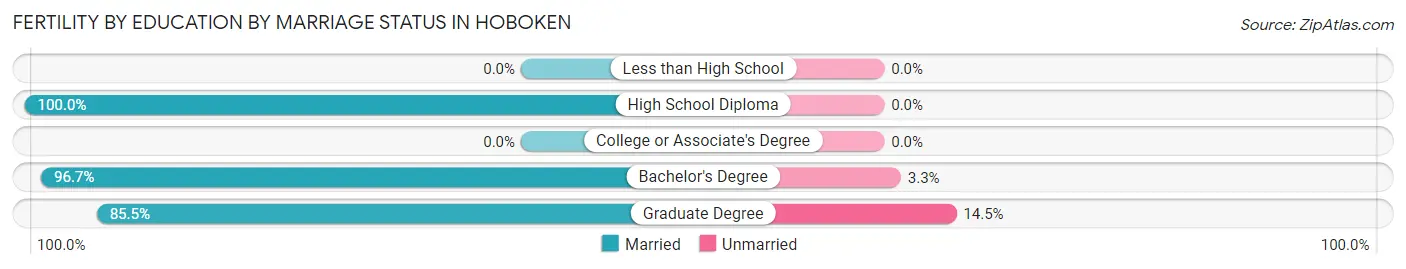
| Educational Attainment | Married | Unmarried |
| Less than High School | 0 (0.0%) | 0 (0.0%) |
| High School Diploma | 38 (100.0%) | 0 (0.0%) |
| College or Associate's Degree | 0 (0.0%) | 0 (0.0%) |
| Bachelor's Degree | 465 (96.7%) | 16 (3.3%) |
| Graduate Degree | 529 (85.5%) | 90 (14.5%) |
| Total | 1,032 (90.7%) | 106 (9.3%) |
Employment Characteristics in Hoboken
Employment by Class of Employer in Hoboken
Among the 38,356 employed individuals in Hoboken, private company employees (31,071 | 81.0%), not-for-profit organizations (2,581 | 6.7%), and local government employees (1,460 | 3.8%) make up the most common classes of employment.
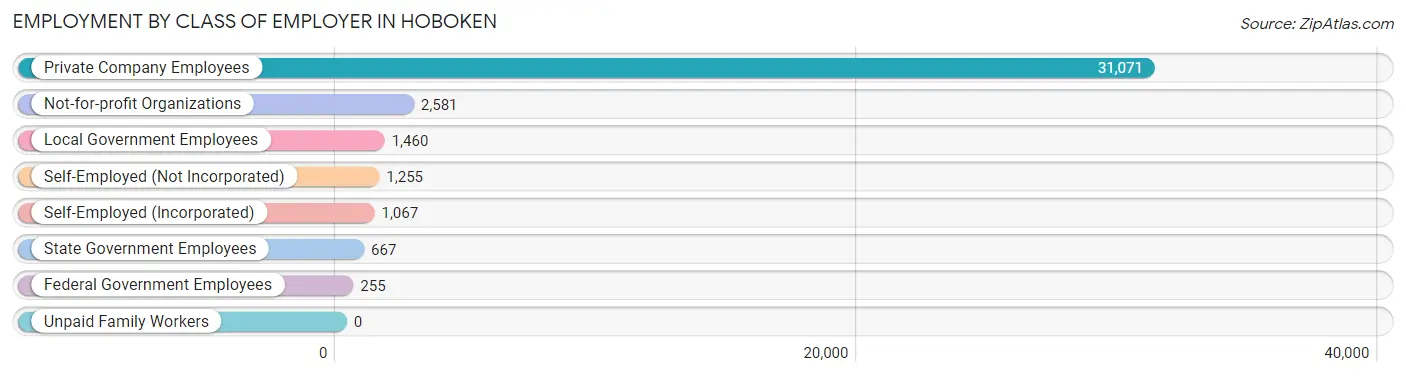
| Employer Class | # Employees | % Employees |
| Private Company Employees | 31,071 | 81.0% |
| Self-Employed (Incorporated) | 1,067 | 2.8% |
| Self-Employed (Not Incorporated) | 1,255 | 3.3% |
| Not-for-profit Organizations | 2,581 | 6.7% |
| Local Government Employees | 1,460 | 3.8% |
| State Government Employees | 667 | 1.7% |
| Federal Government Employees | 255 | 0.7% |
| Unpaid Family Workers | 0 | 0.0% |
| Total | 38,356 | 100.0% |
Employment Status by Age in Hoboken
According to the labor force statistics for Hoboken, out of the total population over 16 years of age (50,500), 80.0% or 40,400 individuals are in the labor force, with 3.5% or 1,414 of them unemployed. The age group with the highest labor force participation rate is 30 to 34 years, with 95.2% or 9,617 individuals in the labor force. Within the labor force, the 16 to 19 years age range has the highest percentage of unemployed individuals, with 56.4% or 88 of them being unemployed.
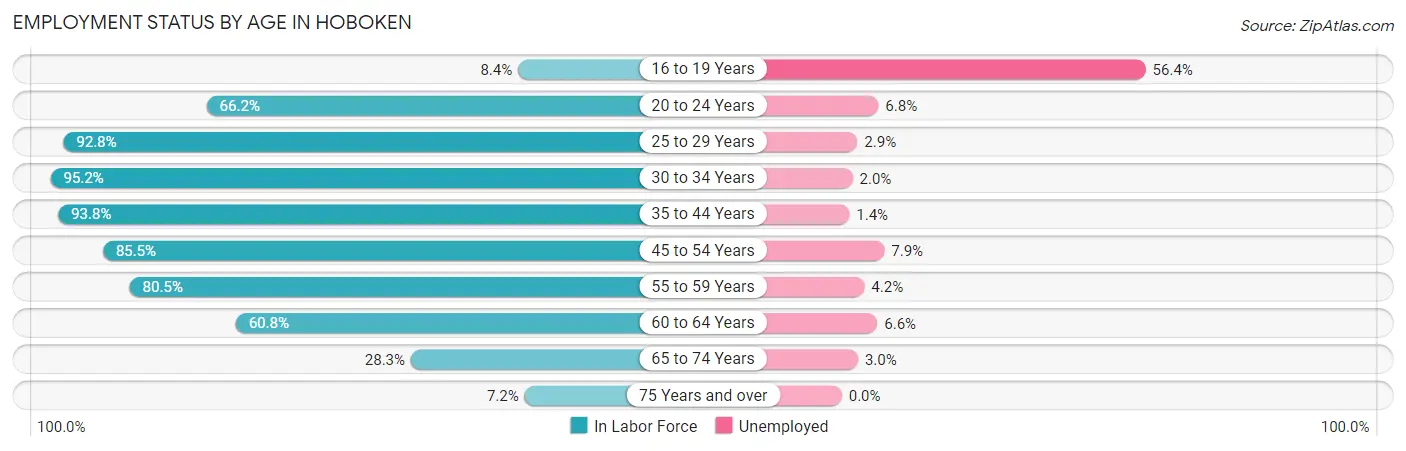
| Age Bracket | In Labor Force | Unemployed |
| 16 to 19 Years | 156 (8.4%) | 88 (56.4%) |
| 20 to 24 Years | 2,917 (66.2%) | 198 (6.8%) |
| 25 to 29 Years | 9,378 (92.8%) | 272 (2.9%) |
| 30 to 34 Years | 9,617 (95.2%) | 192 (2.0%) |
| 35 to 44 Years | 10,296 (93.8%) | 144 (1.4%) |
| 45 to 54 Years | 4,452 (85.5%) | 352 (7.9%) |
| 55 to 59 Years | 1,821 (80.5%) | 76 (4.2%) |
| 60 to 64 Years | 1,048 (60.8%) | 69 (6.6%) |
| 65 to 74 Years | 594 (28.3%) | 18 (3.0%) |
| 75 Years and over | 127 (7.2%) | 0 (0.0%) |
| Total | 40,400 (80.0%) | 1,414 (3.5%) |
Employment Status by Educational Attainment in Hoboken
According to labor force statistics for Hoboken, 90.7% of individuals (36,622) out of the total population between 25 and 64 years of age (40,377) are in the labor force, with 3.0% or 1,099 of them being unemployed. The group with the highest labor force participation rate are those with the educational attainment of bachelor's degree or higher, with 93.0% or 32,235 individuals in the labor force. Within the labor force, individuals with college / associate degree education have the highest percentage of unemployment, with 6.3% or 149 of them being unemployed.
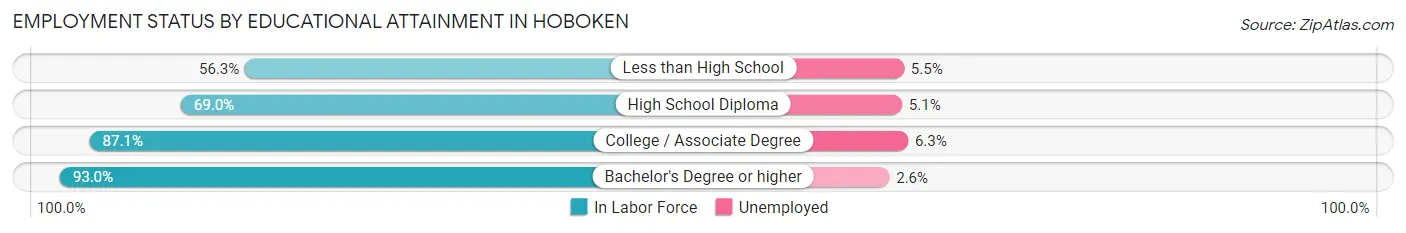
| Educational Attainment | In Labor Force | Unemployed |
| Less than High School | 328 (56.3%) | 32 (5.5%) |
| High School Diploma | 1,670 (69.0%) | 123 (5.1%) |
| College / Associate Degree | 2,363 (87.1%) | 171 (6.3%) |
| Bachelor's Degree or higher | 32,235 (93.0%) | 901 (2.6%) |
| Total | 36,622 (90.7%) | 1,211 (3.0%) |
Employment Occupations by Sex in Hoboken
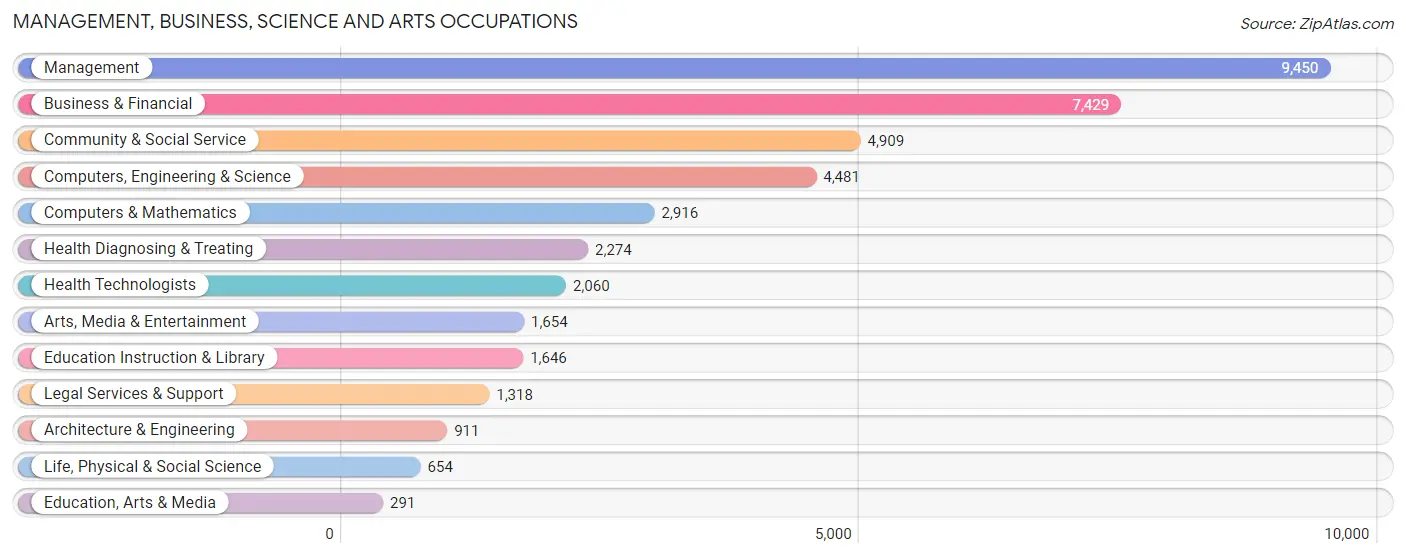
Management, Business, Science and Arts Occupations
The most common Management, Business, Science and Arts occupations in Hoboken are Management (9,450 | 24.2%), Business & Financial (7,429 | 19.1%), Community & Social Service (4,909 | 12.6%), Computers, Engineering & Science (4,481 | 11.5%), and Computers & Mathematics (2,916 | 7.5%).
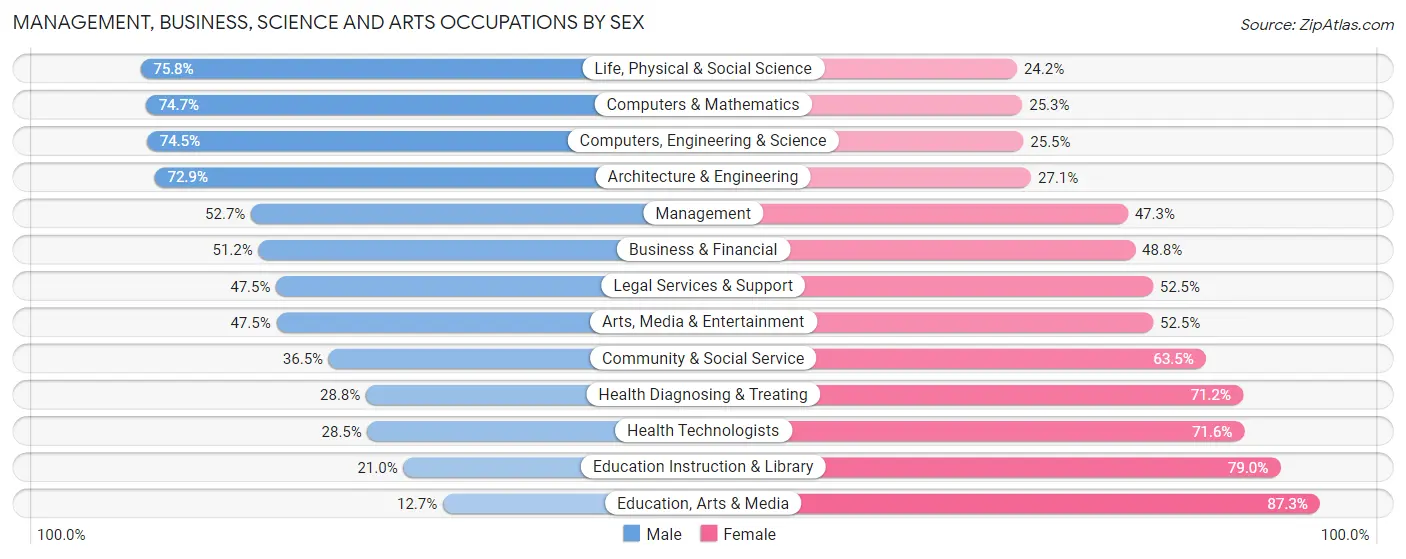
Management, Business, Science and Arts Occupations by Sex
Within the Management, Business, Science and Arts occupations in Hoboken, the most male-oriented occupations are Life, Physical & Social Science (75.8%), Computers & Mathematics (74.7%), and Computers, Engineering & Science (74.5%), while the most female-oriented occupations are Education, Arts & Media (87.3%), Education Instruction & Library (79.0%), and Health Technologists (71.6%).
| Occupation | Male | Female |
| Management | 4,984 (52.7%) | 4,466 (47.3%) |
| Business & Financial | 3,804 (51.2%) | 3,625 (48.8%) |
| Computers, Engineering & Science | 3,339 (74.5%) | 1,142 (25.5%) |
| Computers & Mathematics | 2,179 (74.7%) | 737 (25.3%) |
| Architecture & Engineering | 664 (72.9%) | 247 (27.1%) |
| Life, Physical & Social Science | 496 (75.8%) | 158 (24.2%) |
| Community & Social Service | 1,793 (36.5%) | 3,116 (63.5%) |
| Education, Arts & Media | 37 (12.7%) | 254 (87.3%) |
| Legal Services & Support | 626 (47.5%) | 692 (52.5%) |
| Education Instruction & Library | 345 (21.0%) | 1,301 (79.0%) |
| Arts, Media & Entertainment | 785 (47.5%) | 869 (52.5%) |
| Health Diagnosing & Treating | 654 (28.8%) | 1,620 (71.2%) |
| Health Technologists | 586 (28.4%) | 1,474 (71.6%) |
| Total (Category) | 14,574 (51.1%) | 13,969 (48.9%) |
| Total (Overall) | 20,096 (51.5%) | 18,906 (48.5%) |
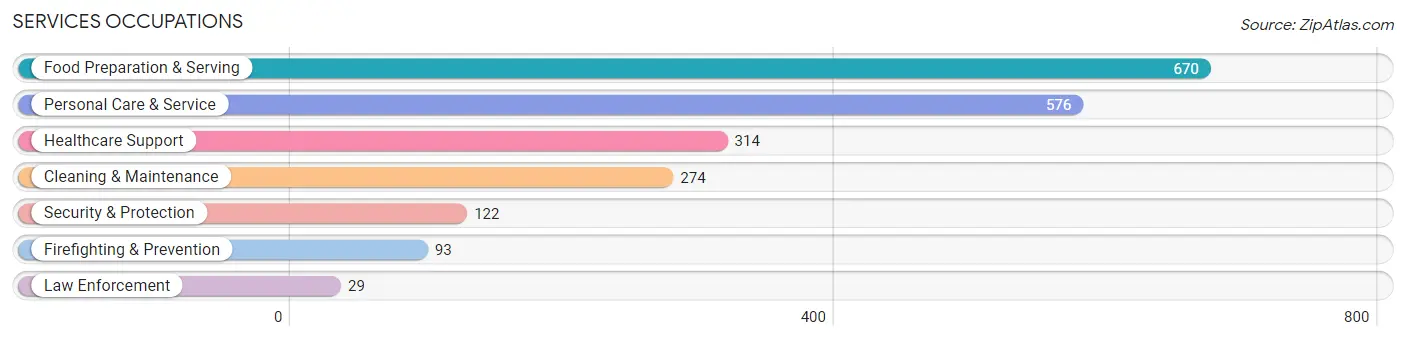
Services Occupations
The most common Services occupations in Hoboken are Food Preparation & Serving (670 | 1.7%), Personal Care & Service (576 | 1.5%), Healthcare Support (314 | 0.8%), Cleaning & Maintenance (274 | 0.7%), and Security & Protection (122 | 0.3%).
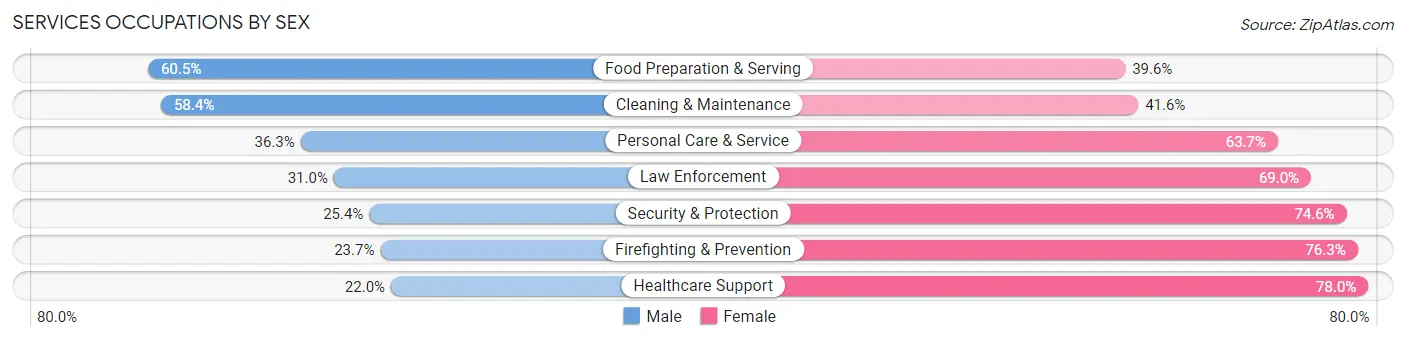
Services Occupations by Sex
Within the Services occupations in Hoboken, the most male-oriented occupations are Food Preparation & Serving (60.5%), Cleaning & Maintenance (58.4%), and Personal Care & Service (36.3%), while the most female-oriented occupations are Healthcare Support (78.0%), Firefighting & Prevention (76.3%), and Security & Protection (74.6%).
| Occupation | Male | Female |
| Healthcare Support | 69 (22.0%) | 245 (78.0%) |
| Security & Protection | 31 (25.4%) | 91 (74.6%) |
| Firefighting & Prevention | 22 (23.7%) | 71 (76.3%) |
| Law Enforcement | 9 (31.0%) | 20 (69.0%) |
| Food Preparation & Serving | 405 (60.5%) | 265 (39.6%) |
| Cleaning & Maintenance | 160 (58.4%) | 114 (41.6%) |
| Personal Care & Service | 209 (36.3%) | 367 (63.7%) |
| Total (Category) | 874 (44.7%) | 1,082 (55.3%) |
| Total (Overall) | 20,096 (51.5%) | 18,906 (48.5%) |
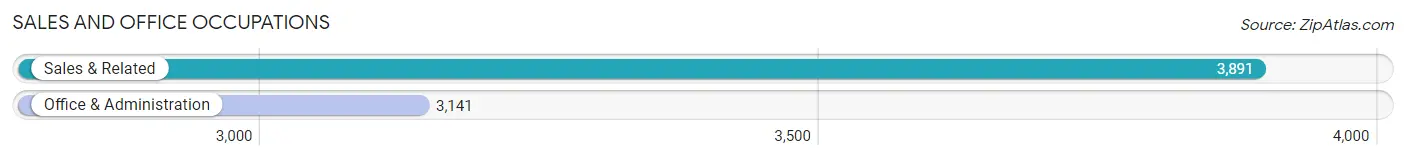
Sales and Office Occupations
The most common Sales and Office occupations in Hoboken are Sales & Related (3,891 | 10.0%), and Office & Administration (3,141 | 8.1%).
Sales and Office Occupations by Sex
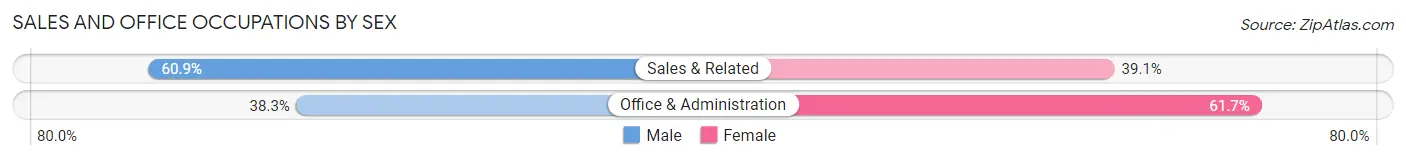
| Occupation | Male | Female |
| Sales & Related | 2,370 (60.9%) | 1,521 (39.1%) |
| Office & Administration | 1,203 (38.3%) | 1,938 (61.7%) |
| Total (Category) | 3,573 (50.8%) | 3,459 (49.2%) |
| Total (Overall) | 20,096 (51.5%) | 18,906 (48.5%) |
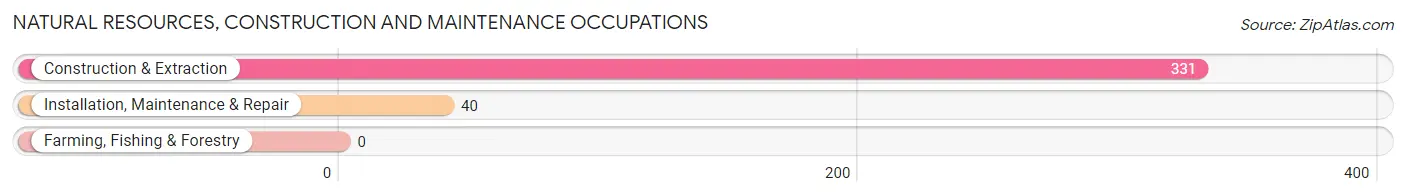
Natural Resources, Construction and Maintenance Occupations
The most common Natural Resources, Construction and Maintenance occupations in Hoboken are Construction & Extraction (331 | 0.9%), and Installation, Maintenance & Repair (40 | 0.1%).
Natural Resources, Construction and Maintenance Occupations by Sex
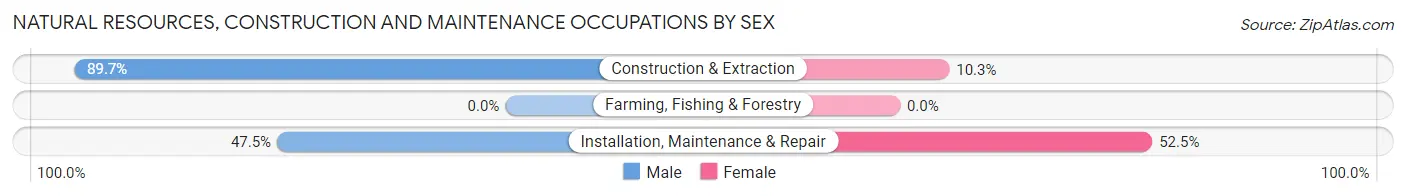
| Occupation | Male | Female |
| Farming, Fishing & Forestry | 0 (0.0%) | 0 (0.0%) |
| Construction & Extraction | 297 (89.7%) | 34 (10.3%) |
| Installation, Maintenance & Repair | 19 (47.5%) | 21 (52.5%) |
| Total (Category) | 316 (85.2%) | 55 (14.8%) |
| Total (Overall) | 20,096 (51.5%) | 18,906 (48.5%) |
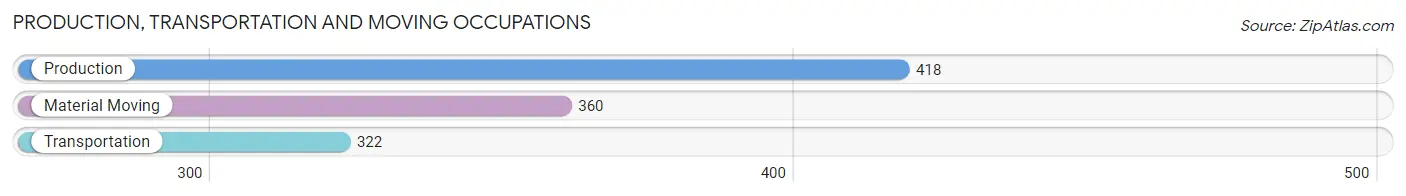
Production, Transportation and Moving Occupations
The most common Production, Transportation and Moving occupations in Hoboken are Production (418 | 1.1%), Material Moving (360 | 0.9%), and Transportation (322 | 0.8%).
Production, Transportation and Moving Occupations by Sex
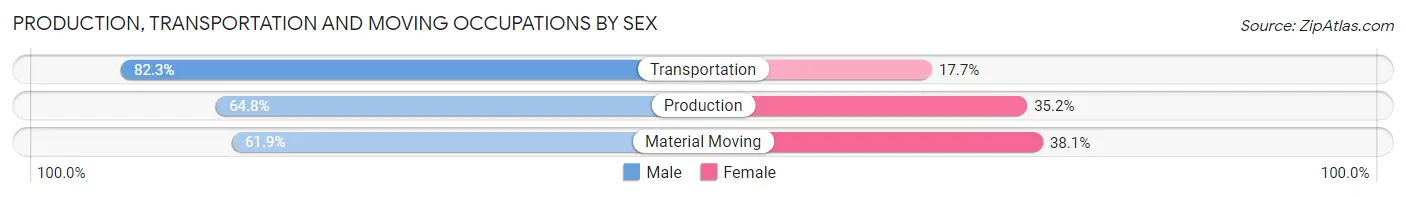
| Occupation | Male | Female |
| Production | 271 (64.8%) | 147 (35.2%) |
| Transportation | 265 (82.3%) | 57 (17.7%) |
| Material Moving | 223 (61.9%) | 137 (38.1%) |
| Total (Category) | 759 (69.0%) | 341 (31.0%) |
| Total (Overall) | 20,096 (51.5%) | 18,906 (48.5%) |
Employment Industries by Sex in Hoboken
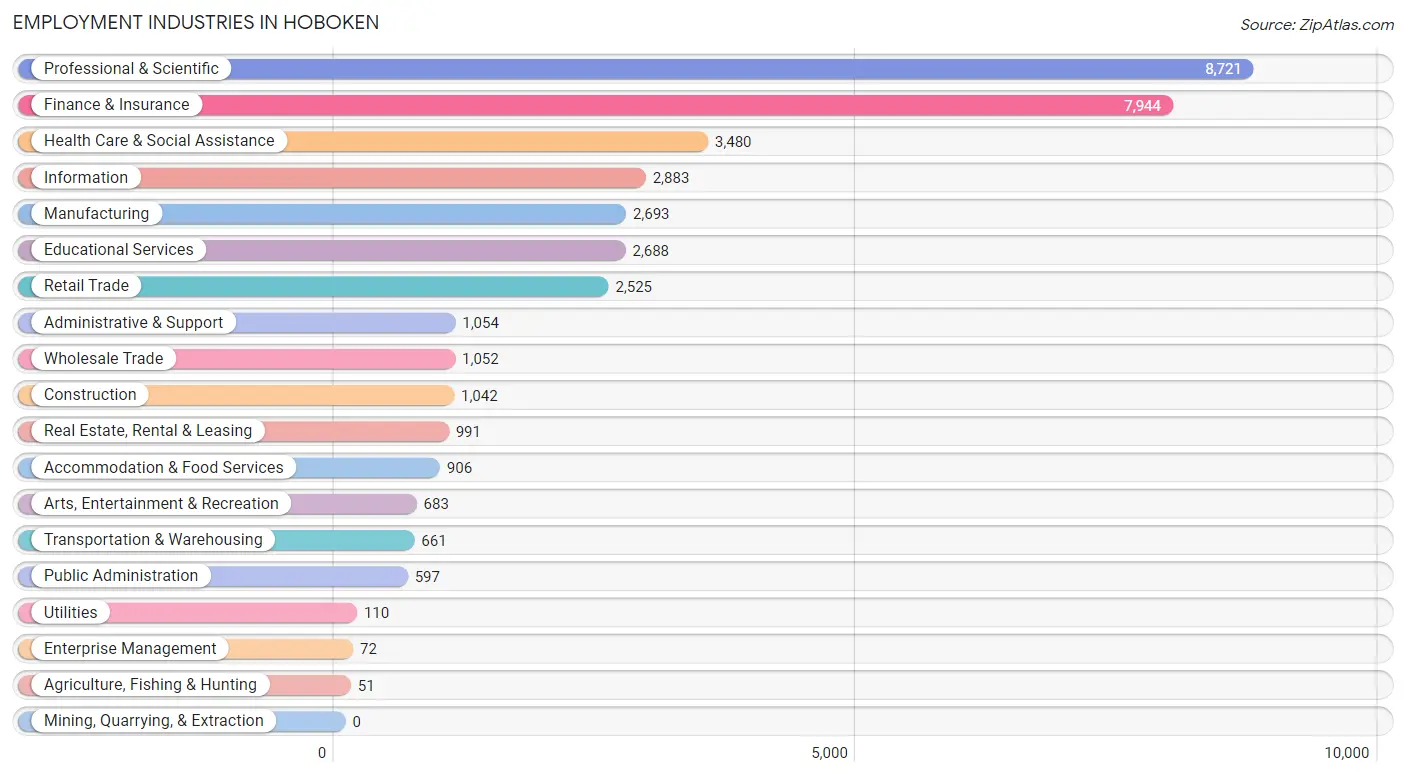
Employment Industries in Hoboken
The major employment industries in Hoboken include Professional & Scientific (8,721 | 22.4%), Finance & Insurance (7,944 | 20.4%), Health Care & Social Assistance (3,480 | 8.9%), Information (2,883 | 7.4%), and Manufacturing (2,693 | 6.9%).
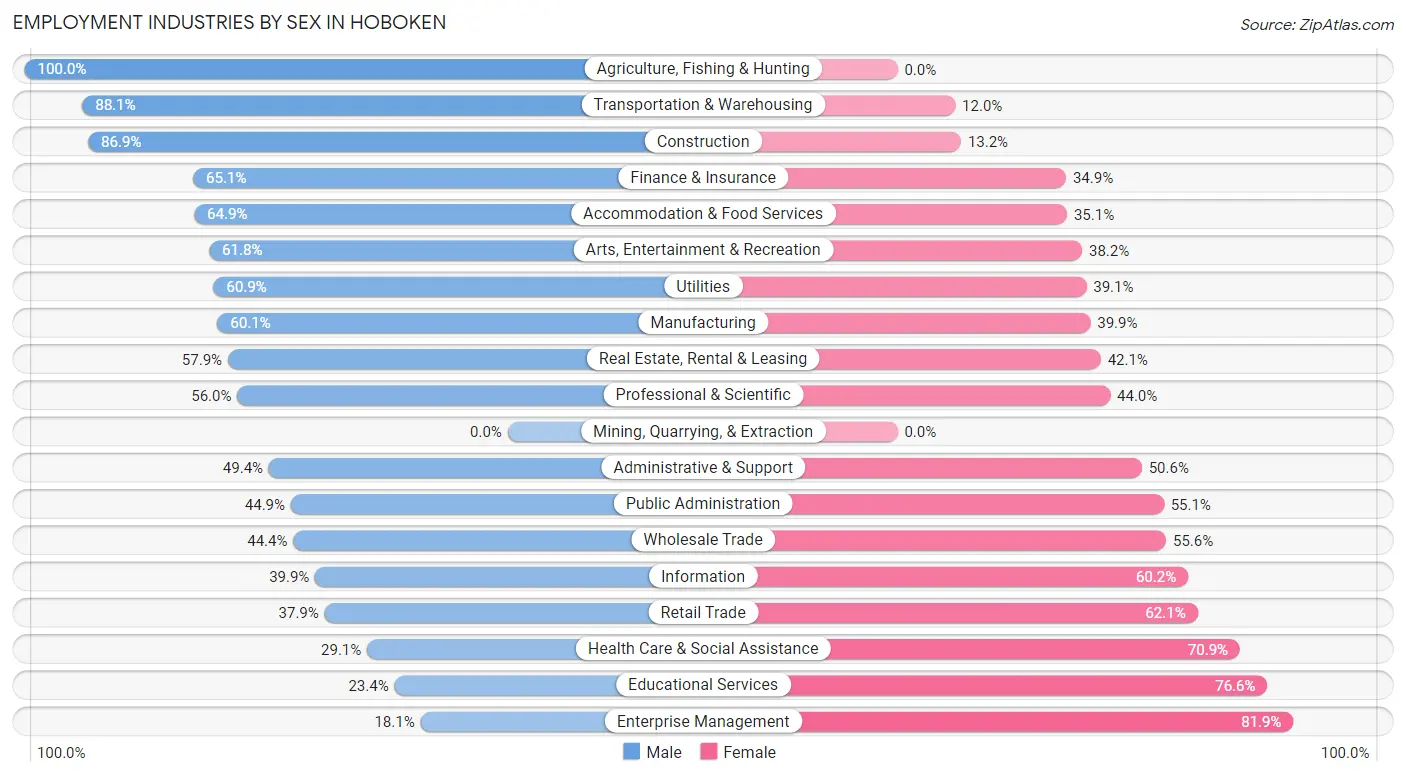
Employment Industries by Sex in Hoboken
The Hoboken industries that see more men than women are Agriculture, Fishing & Hunting (100.0%), Transportation & Warehousing (88.0%), and Construction (86.9%), whereas the industries that tend to have a higher number of women are Enterprise Management (81.9%), Educational Services (76.6%), and Health Care & Social Assistance (70.9%).
| Industry | Male | Female |
| Agriculture, Fishing & Hunting | 51 (100.0%) | 0 (0.0%) |
| Mining, Quarrying, & Extraction | 0 (0.0%) | 0 (0.0%) |
| Construction | 905 (86.9%) | 137 (13.2%) |
| Manufacturing | 1,618 (60.1%) | 1,075 (39.9%) |
| Wholesale Trade | 467 (44.4%) | 585 (55.6%) |
| Retail Trade | 957 (37.9%) | 1,568 (62.1%) |
| Transportation & Warehousing | 582 (88.0%) | 79 (11.9%) |
| Utilities | 67 (60.9%) | 43 (39.1%) |
| Information | 1,149 (39.9%) | 1,734 (60.2%) |
| Finance & Insurance | 5,172 (65.1%) | 2,772 (34.9%) |
| Real Estate, Rental & Leasing | 574 (57.9%) | 417 (42.1%) |
| Professional & Scientific | 4,882 (56.0%) | 3,839 (44.0%) |
| Enterprise Management | 13 (18.1%) | 59 (81.9%) |
| Administrative & Support | 521 (49.4%) | 533 (50.6%) |
| Educational Services | 630 (23.4%) | 2,058 (76.6%) |
| Health Care & Social Assistance | 1,013 (29.1%) | 2,467 (70.9%) |
| Arts, Entertainment & Recreation | 422 (61.8%) | 261 (38.2%) |
| Accommodation & Food Services | 588 (64.9%) | 318 (35.1%) |
| Public Administration | 268 (44.9%) | 329 (55.1%) |
| Total | 20,096 (51.5%) | 18,906 (48.5%) |
Education in Hoboken
School Enrollment in Hoboken
The most common levels of schooling among the 10,754 students in Hoboken are college / undergraduate (3,237 | 30.1%), graduate / professional (1,697 | 15.8%), and elementary school (1,520 | 14.1%).
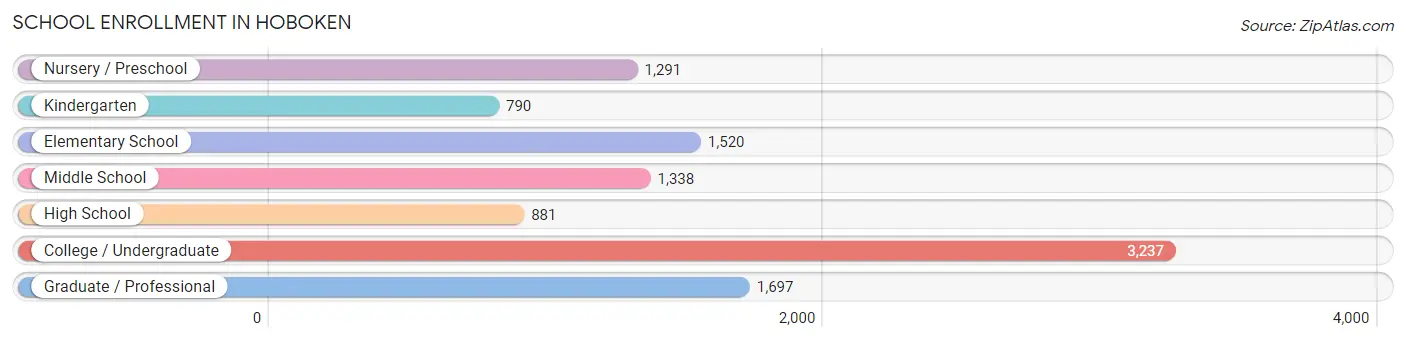
| School Level | # Students | % Students |
| Nursery / Preschool | 1,291 | 12.0% |
| Kindergarten | 790 | 7.3% |
| Elementary School | 1,520 | 14.1% |
| Middle School | 1,338 | 12.4% |
| High School | 881 | 8.2% |
| College / Undergraduate | 3,237 | 30.1% |
| Graduate / Professional | 1,697 | 15.8% |
| Total | 10,754 | 100.0% |
School Enrollment by Age by Funding Source in Hoboken
Out of a total of 10,754 students who are enrolled in schools in Hoboken, 5,377 (50.0%) attend a private institution, while the remaining 5,377 (50.0%) are enrolled in public schools. The age group of 18 to 19 year olds has the highest likelihood of being enrolled in private schools, with 1,181 (83.1% in the age bracket) enrolled. Conversely, the age group of 5 to 9 year old has the lowest likelihood of being enrolled in a private school, with 1,729 (77.8% in the age bracket) attending a public institution.
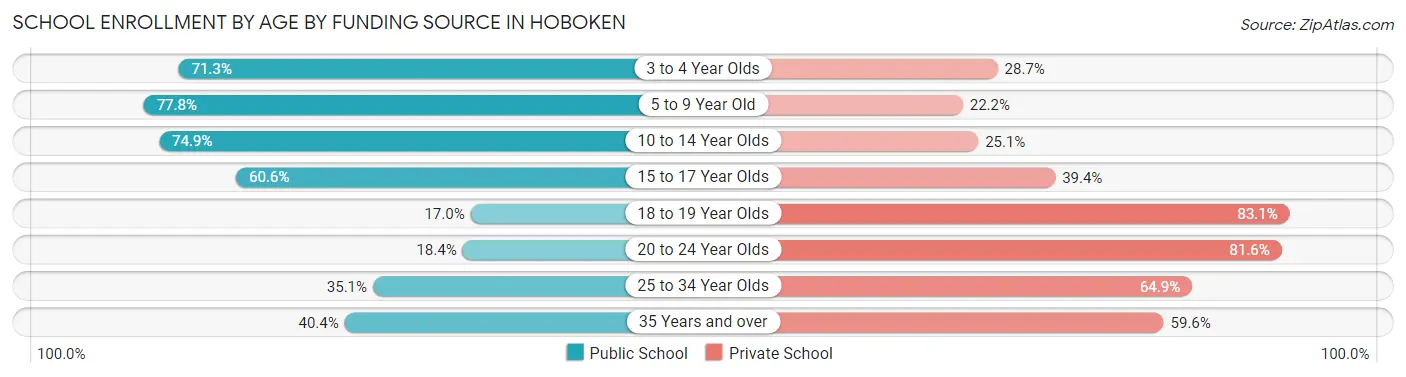
| Age Bracket | Public School | Private School |
| 3 to 4 Year Olds | 878 (71.3%) | 353 (28.7%) |
| 5 to 9 Year Old | 1,729 (77.8%) | 493 (22.2%) |
| 10 to 14 Year Olds | 1,190 (74.9%) | 398 (25.1%) |
| 15 to 17 Year Olds | 406 (60.6%) | 264 (39.4%) |
| 18 to 19 Year Olds | 241 (17.0%) | 1,181 (83.1%) |
| 20 to 24 Year Olds | 390 (18.4%) | 1,725 (81.6%) |
| 25 to 34 Year Olds | 443 (35.1%) | 818 (64.9%) |
| 35 Years and over | 99 (40.4%) | 146 (59.6%) |
| Total | 5,377 (50.0%) | 5,377 (50.0%) |
Educational Attainment by Field of Study in Hoboken
Business (11,338 | 28.9%), social sciences (4,544 | 11.6%), computers & mathematics (2,901 | 7.4%), communications (2,899 | 7.4%), and engineering (2,698 | 6.9%) are the most common fields of study among 39,241 individuals in Hoboken who have obtained a bachelor's degree or higher.
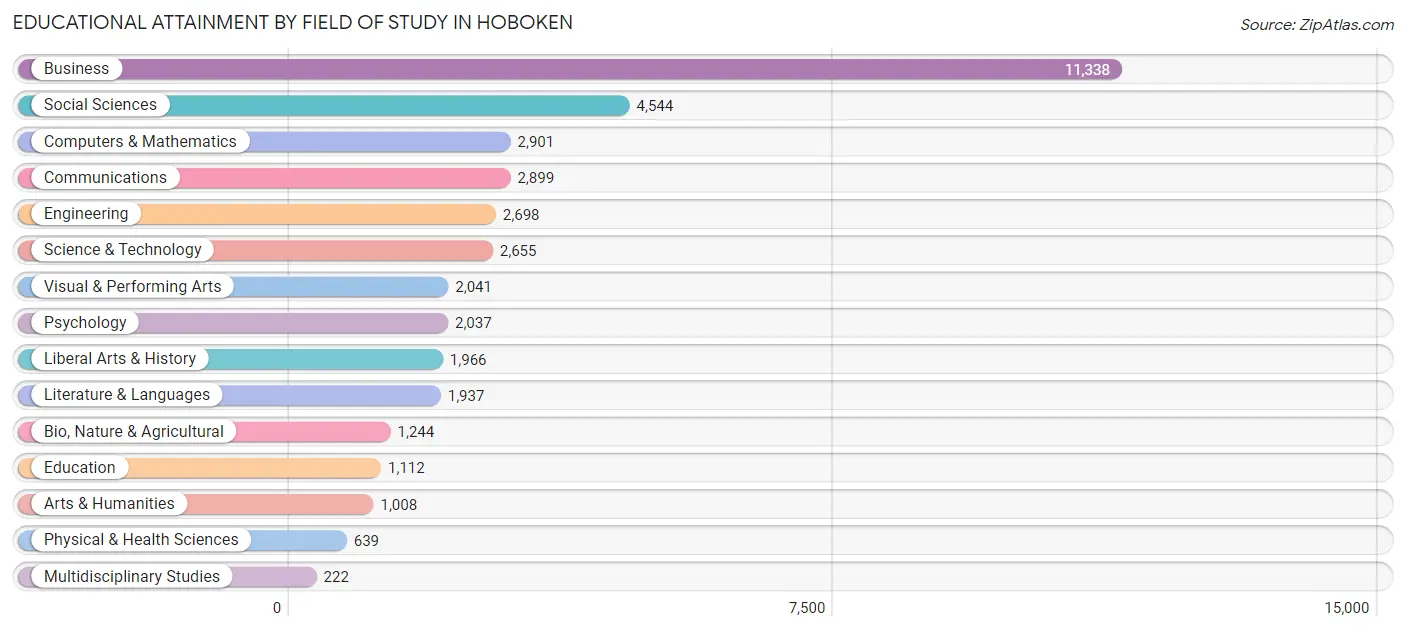
| Field of Study | # Graduates | % Graduates |
| Computers & Mathematics | 2,901 | 7.4% |
| Bio, Nature & Agricultural | 1,244 | 3.2% |
| Physical & Health Sciences | 639 | 1.6% |
| Psychology | 2,037 | 5.2% |
| Social Sciences | 4,544 | 11.6% |
| Engineering | 2,698 | 6.9% |
| Multidisciplinary Studies | 222 | 0.6% |
| Science & Technology | 2,655 | 6.8% |
| Business | 11,338 | 28.9% |
| Education | 1,112 | 2.8% |
| Literature & Languages | 1,937 | 4.9% |
| Liberal Arts & History | 1,966 | 5.0% |
| Visual & Performing Arts | 2,041 | 5.2% |
| Communications | 2,899 | 7.4% |
| Arts & Humanities | 1,008 | 2.6% |
| Total | 39,241 | 100.0% |
Transportation & Commute in Hoboken
Vehicle Availability by Sex in Hoboken
The most prevalent vehicle ownership categories in Hoboken are males with 1 vehicle (11,891, accounting for 59.8%) and females with 1 vehicle (10,412, making up 64.5%).
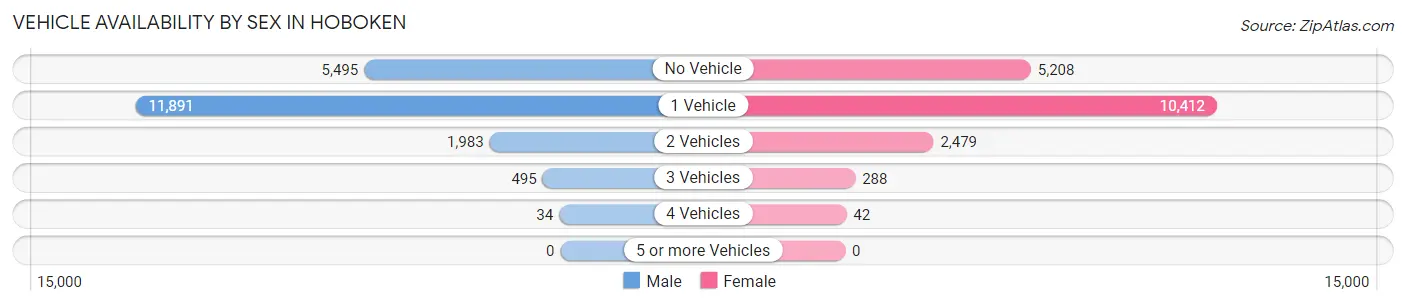
| Vehicles Available | Male | Female |
| No Vehicle | 5,495 (27.6%) | 5,208 (28.3%) |
| 1 Vehicle | 11,891 (59.8%) | 10,412 (56.5%) |
| 2 Vehicles | 1,983 (10.0%) | 2,479 (13.5%) |
| 3 Vehicles | 495 (2.5%) | 288 (1.6%) |
| 4 Vehicles | 34 (0.2%) | 42 (0.2%) |
| 5 or more Vehicles | 0 (0.0%) | 0 (0.0%) |
| Total | 19,898 (100.0%) | 18,429 (100.0%) |
Commute Time in Hoboken
The most frequently occuring commute durations in Hoboken are 45 to 59 minutes (6,760 commuters, 24.9%), 30 to 34 minutes (3,802 commuters, 14.0%), and 60 to 89 minutes (3,690 commuters, 13.6%).
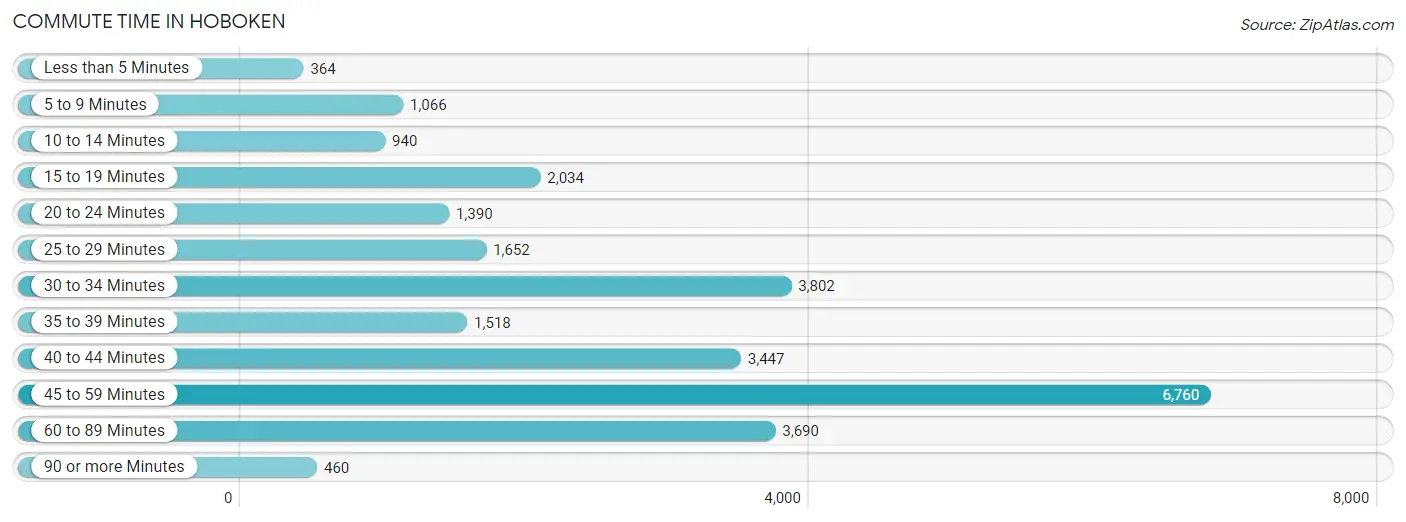
| Commute Time | # Commuters | % Commuters |
| Less than 5 Minutes | 364 | 1.3% |
| 5 to 9 Minutes | 1,066 | 3.9% |
| 10 to 14 Minutes | 940 | 3.5% |
| 15 to 19 Minutes | 2,034 | 7.5% |
| 20 to 24 Minutes | 1,390 | 5.1% |
| 25 to 29 Minutes | 1,652 | 6.1% |
| 30 to 34 Minutes | 3,802 | 14.0% |
| 35 to 39 Minutes | 1,518 | 5.6% |
| 40 to 44 Minutes | 3,447 | 12.7% |
| 45 to 59 Minutes | 6,760 | 24.9% |
| 60 to 89 Minutes | 3,690 | 13.6% |
| 90 or more Minutes | 460 | 1.7% |
Commute Time by Sex in Hoboken
The most common commute times in Hoboken are 45 to 59 minutes (3,590 commuters, 25.3%) for males and 45 to 59 minutes (3,170 commuters, 24.6%) for females.
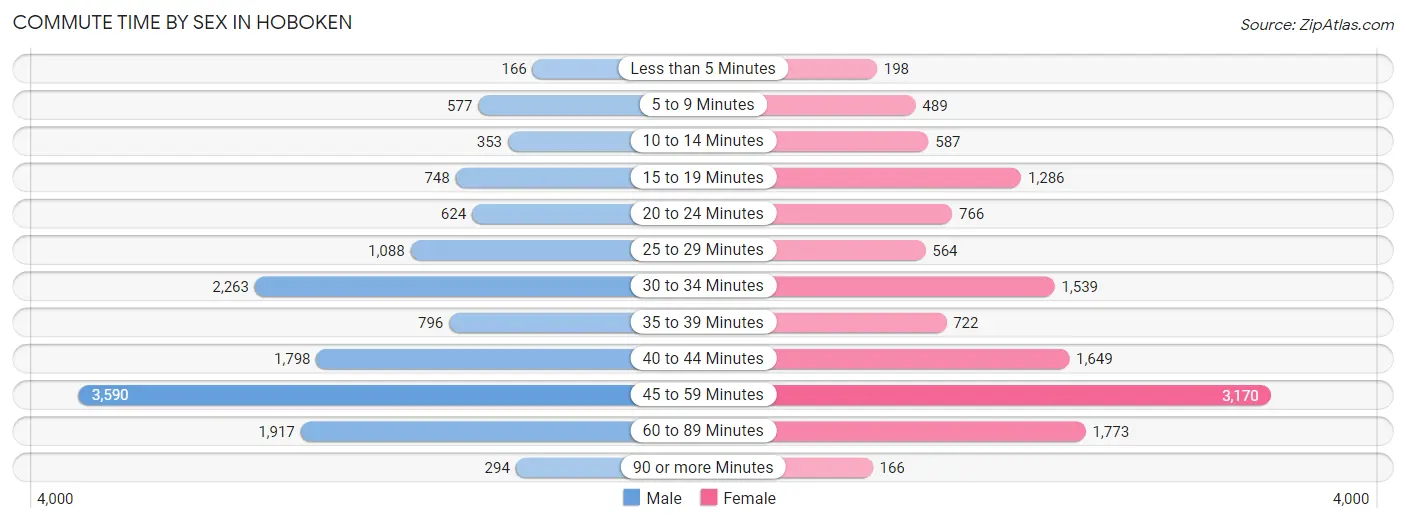
| Commute Time | Male | Female |
| Less than 5 Minutes | 166 (1.2%) | 198 (1.5%) |
| 5 to 9 Minutes | 577 (4.1%) | 489 (3.8%) |
| 10 to 14 Minutes | 353 (2.5%) | 587 (4.5%) |
| 15 to 19 Minutes | 748 (5.3%) | 1,286 (10.0%) |
| 20 to 24 Minutes | 624 (4.4%) | 766 (5.9%) |
| 25 to 29 Minutes | 1,088 (7.6%) | 564 (4.4%) |
| 30 to 34 Minutes | 2,263 (15.9%) | 1,539 (11.9%) |
| 35 to 39 Minutes | 796 (5.6%) | 722 (5.6%) |
| 40 to 44 Minutes | 1,798 (12.7%) | 1,649 (12.8%) |
| 45 to 59 Minutes | 3,590 (25.3%) | 3,170 (24.6%) |
| 60 to 89 Minutes | 1,917 (13.5%) | 1,773 (13.7%) |
| 90 or more Minutes | 294 (2.1%) | 166 (1.3%) |
Time of Departure to Work by Sex in Hoboken
The most frequent times of departure to work in Hoboken are 8:00 AM to 8:29 AM (3,304, 23.2%) for males and 8:00 AM to 8:29 AM (3,520, 27.3%) for females.
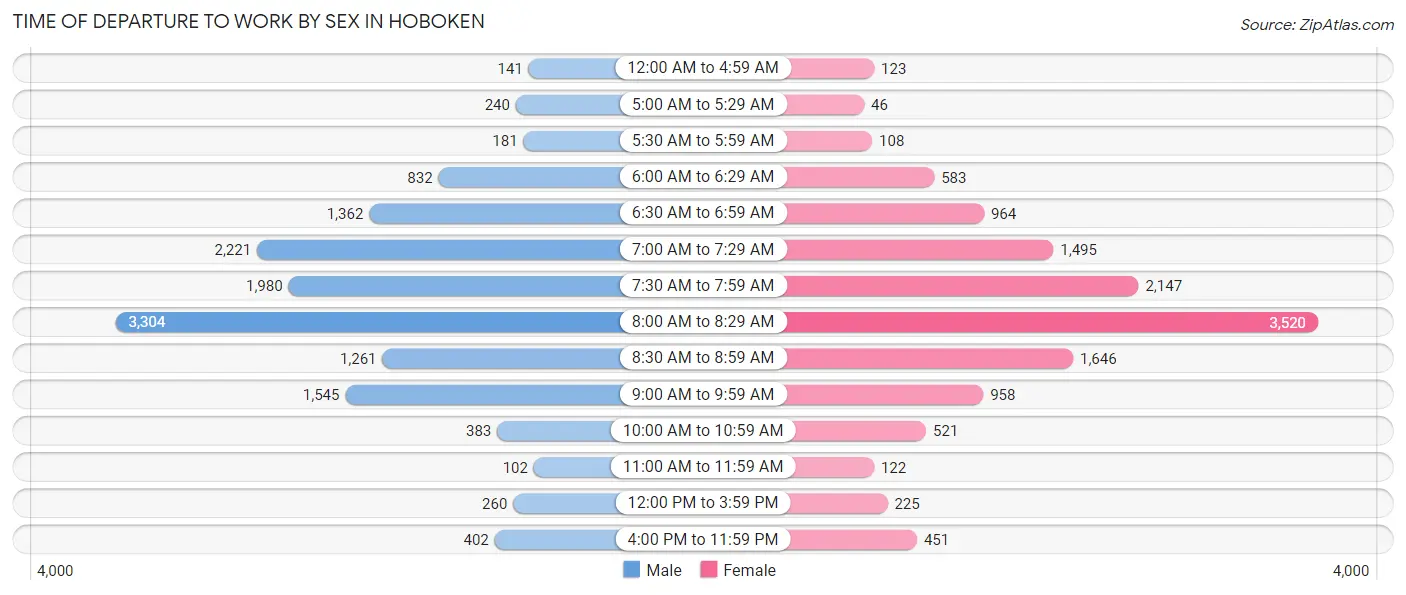
| Time of Departure | Male | Female |
| 12:00 AM to 4:59 AM | 141 (1.0%) | 123 (0.9%) |
| 5:00 AM to 5:29 AM | 240 (1.7%) | 46 (0.4%) |
| 5:30 AM to 5:59 AM | 181 (1.3%) | 108 (0.8%) |
| 6:00 AM to 6:29 AM | 832 (5.9%) | 583 (4.5%) |
| 6:30 AM to 6:59 AM | 1,362 (9.6%) | 964 (7.5%) |
| 7:00 AM to 7:29 AM | 2,221 (15.6%) | 1,495 (11.6%) |
| 7:30 AM to 7:59 AM | 1,980 (13.9%) | 2,147 (16.6%) |
| 8:00 AM to 8:29 AM | 3,304 (23.2%) | 3,520 (27.3%) |
| 8:30 AM to 8:59 AM | 1,261 (8.9%) | 1,646 (12.8%) |
| 9:00 AM to 9:59 AM | 1,545 (10.9%) | 958 (7.4%) |
| 10:00 AM to 10:59 AM | 383 (2.7%) | 521 (4.0%) |
| 11:00 AM to 11:59 AM | 102 (0.7%) | 122 (0.9%) |
| 12:00 PM to 3:59 PM | 260 (1.8%) | 225 (1.7%) |
| 4:00 PM to 11:59 PM | 402 (2.8%) | 451 (3.5%) |
| Total | 14,214 (100.0%) | 12,909 (100.0%) |
Housing Occupancy in Hoboken
Occupancy by Ownership in Hoboken
Of the total 27,879 dwellings in Hoboken, owner-occupied units account for 9,589 (34.4%), while renter-occupied units make up 18,290 (65.6%).
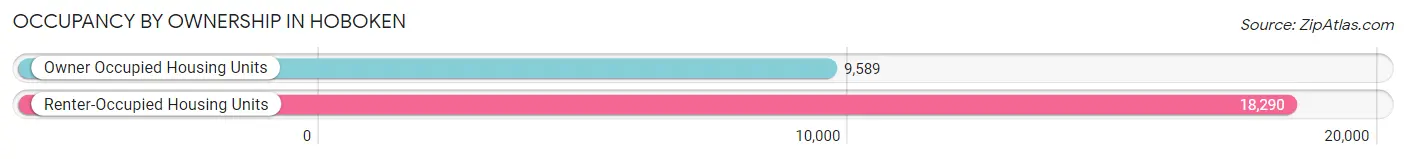
| Occupancy | # Housing Units | % Housing Units |
| Owner Occupied Housing Units | 9,589 | 34.4% |
| Renter-Occupied Housing Units | 18,290 | 65.6% |
| Total Occupied Housing Units | 27,879 | 100.0% |
Occupancy by Household Size in Hoboken
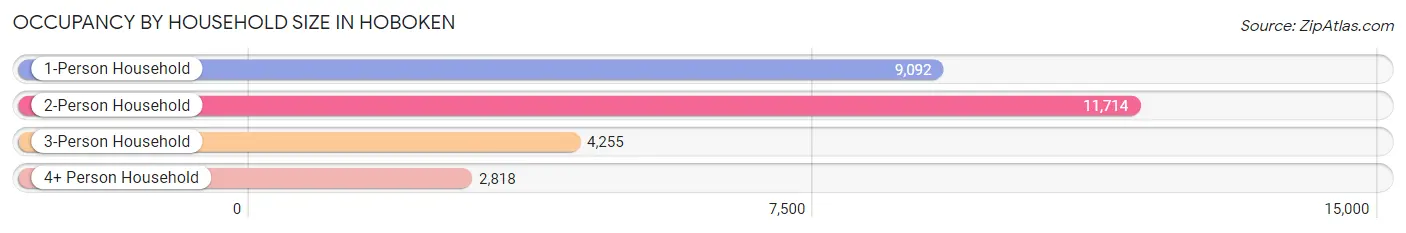
| Household Size | # Housing Units | % Housing Units |
| 1-Person Household | 9,092 | 32.6% |
| 2-Person Household | 11,714 | 42.0% |
| 3-Person Household | 4,255 | 15.3% |
| 4+ Person Household | 2,818 | 10.1% |
| Total Housing Units | 27,879 | 100.0% |
Occupancy by Ownership by Household Size in Hoboken
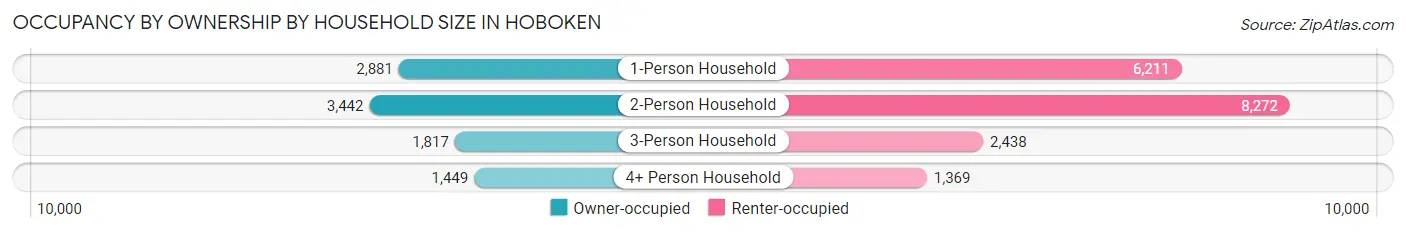
| Household Size | Owner-occupied | Renter-occupied |
| 1-Person Household | 2,881 (31.7%) | 6,211 (68.3%) |
| 2-Person Household | 3,442 (29.4%) | 8,272 (70.6%) |
| 3-Person Household | 1,817 (42.7%) | 2,438 (57.3%) |
| 4+ Person Household | 1,449 (51.4%) | 1,369 (48.6%) |
| Total Housing Units | 9,589 (34.4%) | 18,290 (65.6%) |
Occupancy by Educational Attainment in Hoboken
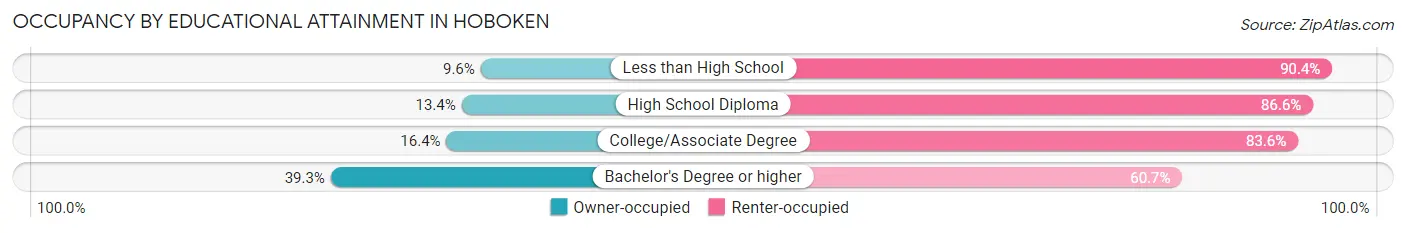
| Household Size | Owner-occupied | Renter-occupied |
| Less than High School | 102 (9.6%) | 962 (90.4%) |
| High School Diploma | 290 (13.4%) | 1,879 (86.6%) |
| College/Associate Degree | 350 (16.4%) | 1,788 (83.6%) |
| Bachelor's Degree or higher | 8,847 (39.3%) | 13,661 (60.7%) |
Occupancy by Age of Householder in Hoboken
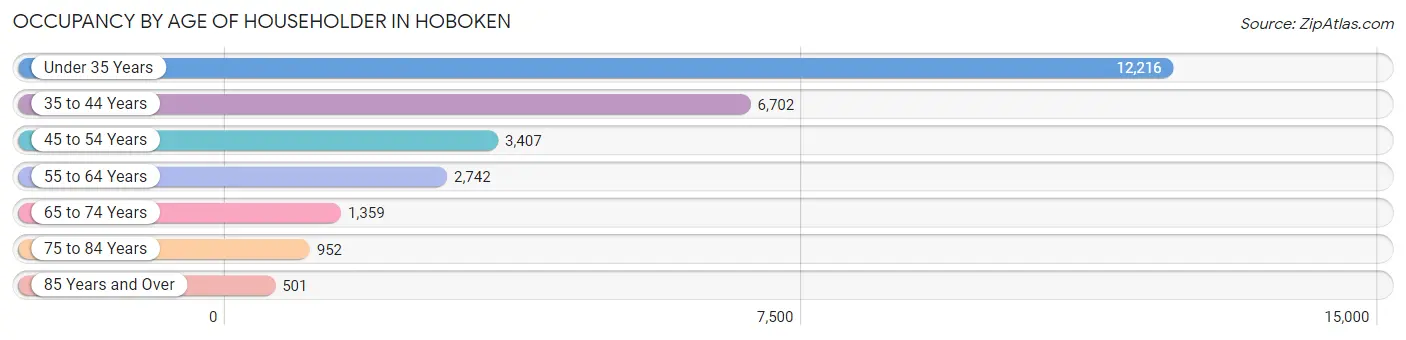
| Age Bracket | # Households | % Households |
| Under 35 Years | 12,216 | 43.8% |
| 35 to 44 Years | 6,702 | 24.0% |
| 45 to 54 Years | 3,407 | 12.2% |
| 55 to 64 Years | 2,742 | 9.8% |
| 65 to 74 Years | 1,359 | 4.9% |
| 75 to 84 Years | 952 | 3.4% |
| 85 Years and Over | 501 | 1.8% |
| Total | 27,879 | 100.0% |
Housing Finances in Hoboken
Median Income by Occupancy in Hoboken
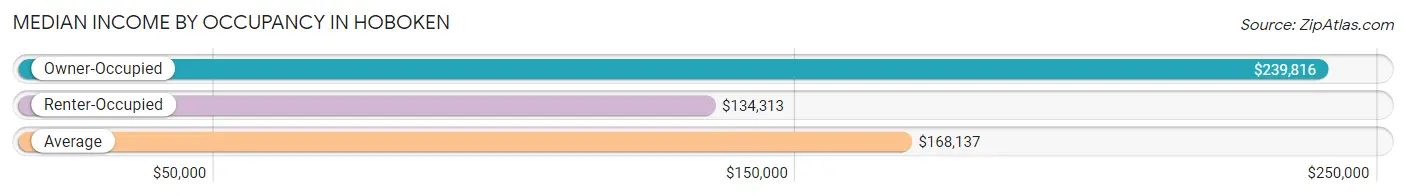
| Occupancy Type | # Households | Median Income |
| Owner-Occupied | 9,589 (34.4%) | $239,816 |
| Renter-Occupied | 18,290 (65.6%) | $134,313 |
| Average | 27,879 (100.0%) | $168,137 |
Occupancy by Householder Income Bracket in Hoboken
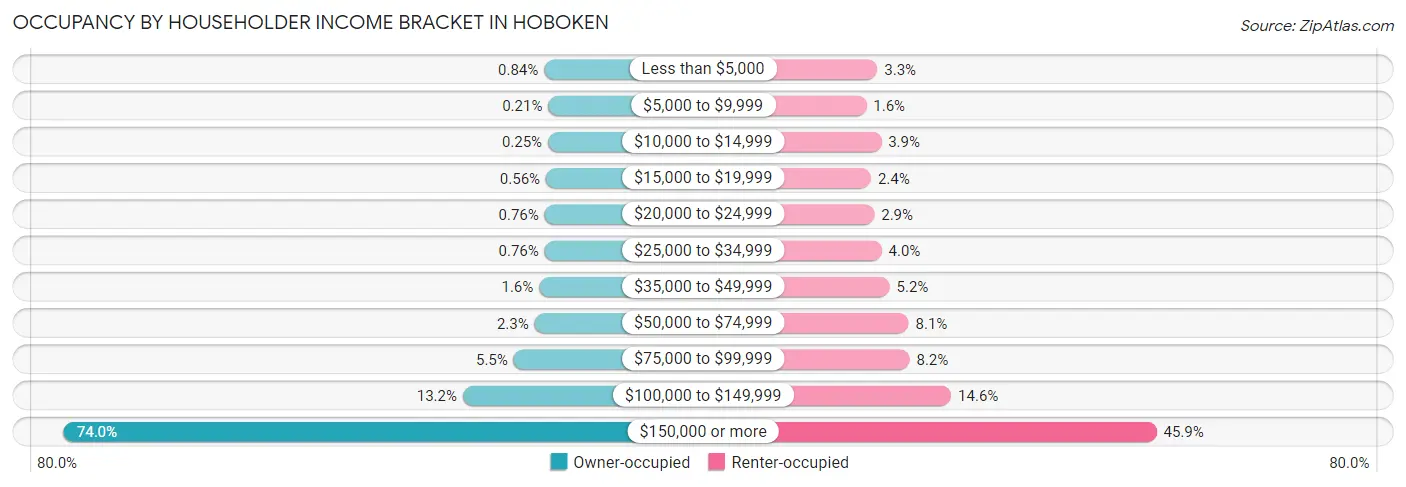
| Income Bracket | Owner-occupied | Renter-occupied |
| Less than $5,000 | 81 (0.8%) | 607 (3.3%) |
| $5,000 to $9,999 | 20 (0.2%) | 300 (1.6%) |
| $10,000 to $14,999 | 24 (0.3%) | 716 (3.9%) |
| $15,000 to $19,999 | 54 (0.6%) | 430 (2.4%) |
| $20,000 to $24,999 | 73 (0.8%) | 524 (2.9%) |
| $25,000 to $34,999 | 73 (0.8%) | 727 (4.0%) |
| $35,000 to $49,999 | 153 (1.6%) | 949 (5.2%) |
| $50,000 to $74,999 | 220 (2.3%) | 1,478 (8.1%) |
| $75,000 to $99,999 | 525 (5.5%) | 1,506 (8.2%) |
| $100,000 to $149,999 | 1,269 (13.2%) | 2,664 (14.6%) |
| $150,000 or more | 7,097 (74.0%) | 8,389 (45.9%) |
| Total | 9,589 (100.0%) | 18,290 (100.0%) |
Monthly Housing Cost Tiers in Hoboken
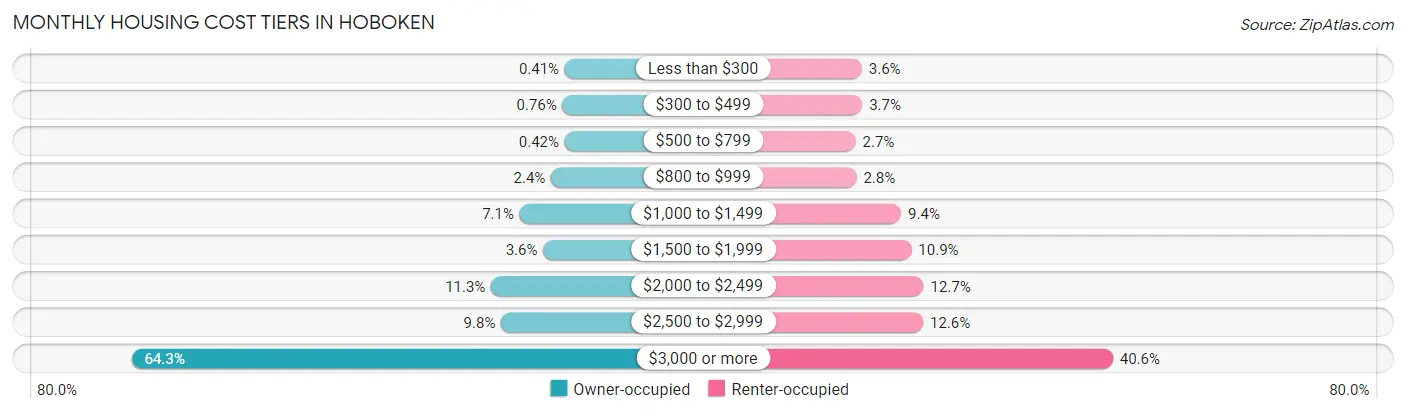
| Monthly Cost | Owner-occupied | Renter-occupied |
| Less than $300 | 39 (0.4%) | 659 (3.6%) |
| $300 to $499 | 73 (0.8%) | 667 (3.6%) |
| $500 to $799 | 40 (0.4%) | 490 (2.7%) |
| $800 to $999 | 234 (2.4%) | 514 (2.8%) |
| $1,000 to $1,499 | 677 (7.1%) | 1,717 (9.4%) |
| $1,500 to $1,999 | 345 (3.6%) | 1,994 (10.9%) |
| $2,000 to $2,499 | 1,081 (11.3%) | 2,323 (12.7%) |
| $2,500 to $2,999 | 939 (9.8%) | 2,306 (12.6%) |
| $3,000 or more | 6,161 (64.2%) | 7,419 (40.6%) |
| Total | 9,589 (100.0%) | 18,290 (100.0%) |
Physical Housing Characteristics in Hoboken
Housing Structures in Hoboken
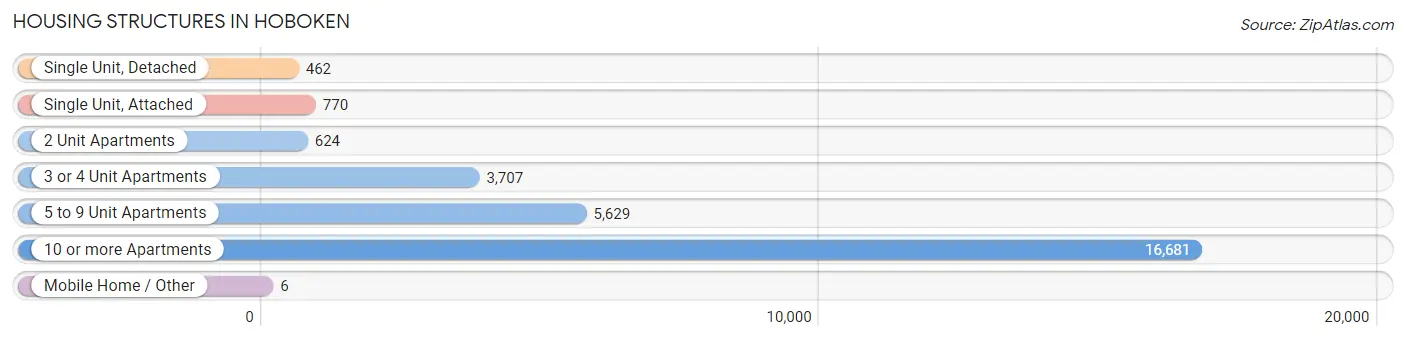
| Structure Type | # Housing Units | % Housing Units |
| Single Unit, Detached | 462 | 1.7% |
| Single Unit, Attached | 770 | 2.8% |
| 2 Unit Apartments | 624 | 2.2% |
| 3 or 4 Unit Apartments | 3,707 | 13.3% |
| 5 to 9 Unit Apartments | 5,629 | 20.2% |
| 10 or more Apartments | 16,681 | 59.8% |
| Mobile Home / Other | 6 | 0.0% |
| Total | 27,879 | 100.0% |
Housing Structures by Occupancy in Hoboken
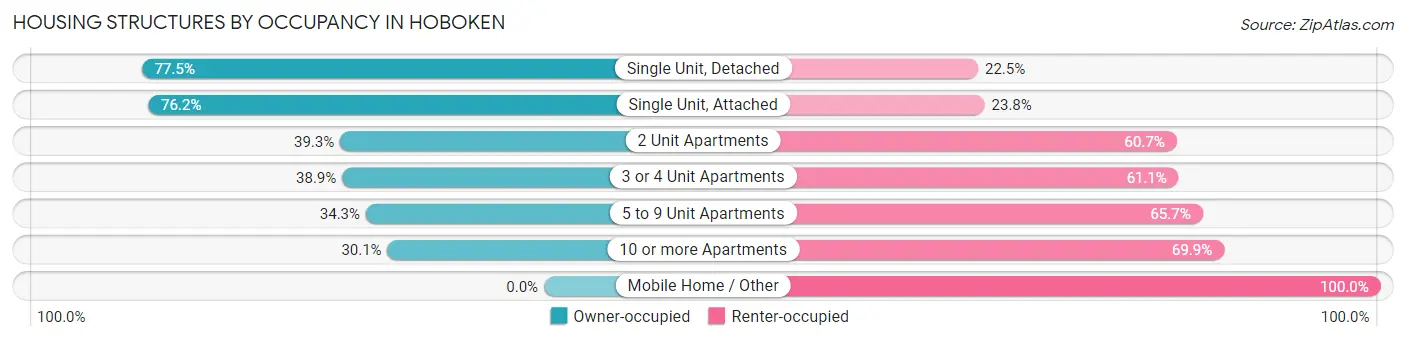
| Structure Type | Owner-occupied | Renter-occupied |
| Single Unit, Detached | 358 (77.5%) | 104 (22.5%) |
| Single Unit, Attached | 587 (76.2%) | 183 (23.8%) |
| 2 Unit Apartments | 245 (39.3%) | 379 (60.7%) |
| 3 or 4 Unit Apartments | 1,441 (38.9%) | 2,266 (61.1%) |
| 5 to 9 Unit Apartments | 1,930 (34.3%) | 3,699 (65.7%) |
| 10 or more Apartments | 5,028 (30.1%) | 11,653 (69.9%) |
| Mobile Home / Other | 0 (0.0%) | 6 (100.0%) |
| Total | 9,589 (34.4%) | 18,290 (65.6%) |
Housing Structures by Number of Rooms in Hoboken
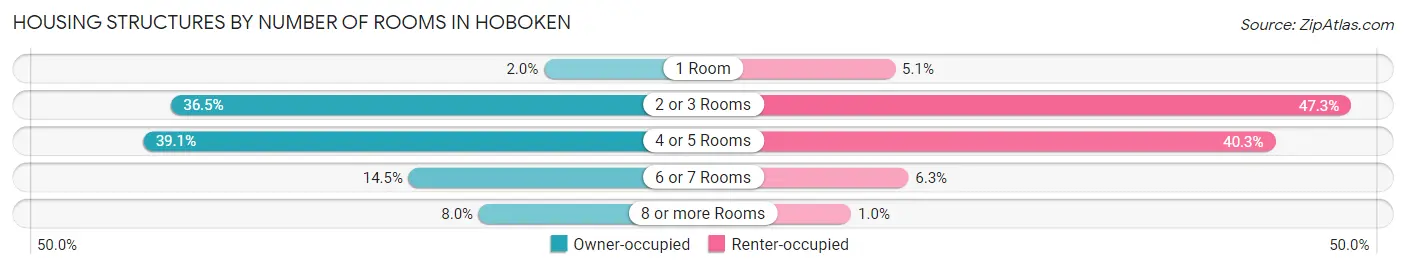
| Number of Rooms | Owner-occupied | Renter-occupied |
| 1 Room | 188 (2.0%) | 934 (5.1%) |
| 2 or 3 Rooms | 3,502 (36.5%) | 8,645 (47.3%) |
| 4 or 5 Rooms | 3,746 (39.1%) | 7,363 (40.3%) |
| 6 or 7 Rooms | 1,388 (14.5%) | 1,158 (6.3%) |
| 8 or more Rooms | 765 (8.0%) | 190 (1.0%) |
| Total | 9,589 (100.0%) | 18,290 (100.0%) |
Housing Structure by Heating Type in Hoboken
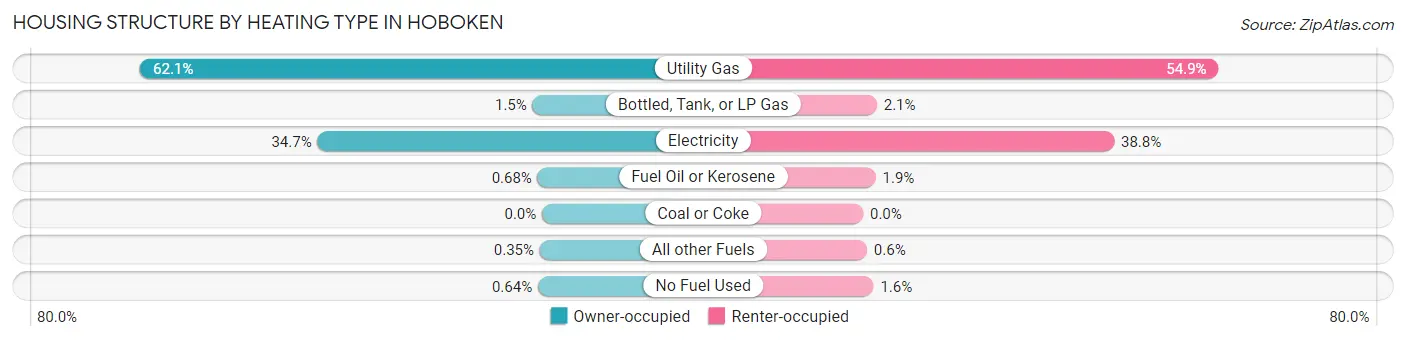
| Heating Type | Owner-occupied | Renter-occupied |
| Utility Gas | 5,959 (62.1%) | 10,047 (54.9%) |
| Bottled, Tank, or LP Gas | 141 (1.5%) | 387 (2.1%) |
| Electricity | 3,329 (34.7%) | 7,097 (38.8%) |
| Fuel Oil or Kerosene | 65 (0.7%) | 355 (1.9%) |
| Coal or Coke | 0 (0.0%) | 0 (0.0%) |
| All other Fuels | 34 (0.4%) | 110 (0.6%) |
| No Fuel Used | 61 (0.6%) | 294 (1.6%) |
| Total | 9,589 (100.0%) | 18,290 (100.0%) |
Household Vehicle Usage in Hoboken
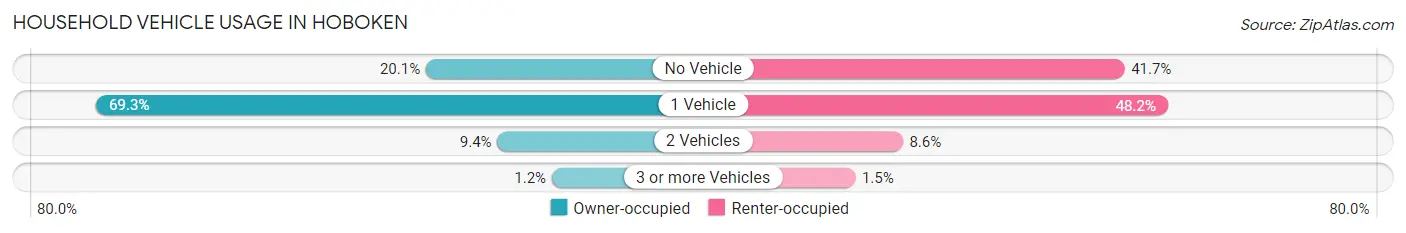
| Vehicles per Household | Owner-occupied | Renter-occupied |
| No Vehicle | 1,923 (20.1%) | 7,628 (41.7%) |
| 1 Vehicle | 6,648 (69.3%) | 8,817 (48.2%) |
| 2 Vehicles | 899 (9.4%) | 1,571 (8.6%) |
| 3 or more Vehicles | 119 (1.2%) | 274 (1.5%) |
| Total | 9,589 (100.0%) | 18,290 (100.0%) |
Real Estate & Mortgages in Hoboken
Real Estate and Mortgage Overview in Hoboken
| Characteristic | Without Mortgage | With Mortgage |
| Housing Units | 1,944 | 7,645 |
| Median Property Value | $812,100 | $866,400 |
| Median Household Income | $131,579 | $6,141 |
| Monthly Housing Costs | $1,487 | $6,059 |
| Real Estate Taxes | $9,800 | $13 |
Property Value by Mortgage Status in Hoboken
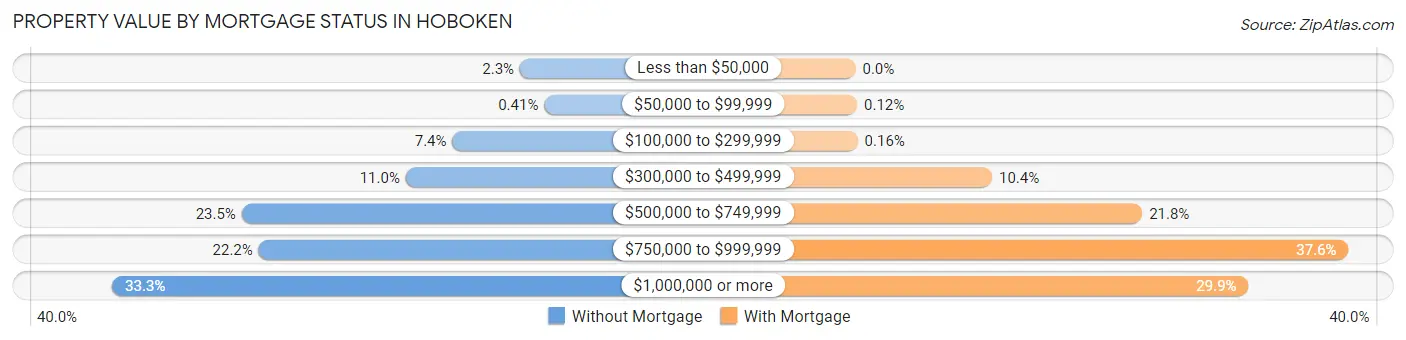
| Property Value | Without Mortgage | With Mortgage |
| Less than $50,000 | 44 (2.3%) | 0 (0.0%) |
| $50,000 to $99,999 | 8 (0.4%) | 9 (0.1%) |
| $100,000 to $299,999 | 144 (7.4%) | 12 (0.2%) |
| $300,000 to $499,999 | 213 (11.0%) | 795 (10.4%) |
| $500,000 to $749,999 | 456 (23.5%) | 1,670 (21.8%) |
| $750,000 to $999,999 | 431 (22.2%) | 2,871 (37.6%) |
| $1,000,000 or more | 648 (33.3%) | 2,288 (29.9%) |
| Total | 1,944 (100.0%) | 7,645 (100.0%) |
Household Income by Mortgage Status in Hoboken
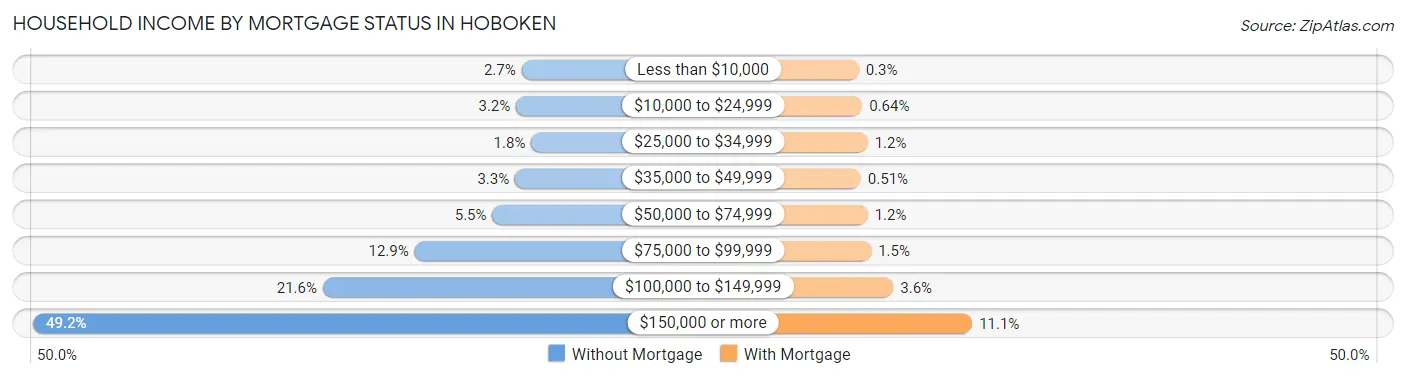
| Household Income | Without Mortgage | With Mortgage |
| Less than $10,000 | 52 (2.7%) | 23 (0.3%) |
| $10,000 to $24,999 | 62 (3.2%) | 49 (0.6%) |
| $25,000 to $34,999 | 34 (1.8%) | 89 (1.2%) |
| $35,000 to $49,999 | 64 (3.3%) | 39 (0.5%) |
| $50,000 to $74,999 | 106 (5.4%) | 89 (1.2%) |
| $75,000 to $99,999 | 250 (12.9%) | 114 (1.5%) |
| $100,000 to $149,999 | 420 (21.6%) | 275 (3.6%) |
| $150,000 or more | 956 (49.2%) | 849 (11.1%) |
| Total | 1,944 (100.0%) | 7,645 (100.0%) |
Property Value to Household Income Ratio in Hoboken
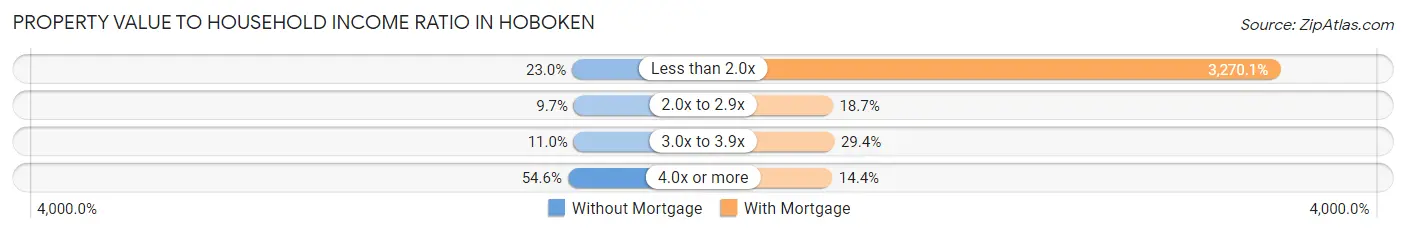
| Value-to-Income Ratio | Without Mortgage | With Mortgage |
| Less than 2.0x | 447 (23.0%) | 250,001 (3,270.1%) |
| 2.0x to 2.9x | 189 (9.7%) | 1,426 (18.6%) |
| 3.0x to 3.9x | 213 (11.0%) | 2,251 (29.4%) |
| 4.0x or more | 1,061 (54.6%) | 1,100 (14.4%) |
| Total | 1,944 (100.0%) | 7,645 (100.0%) |
Real Estate Taxes by Mortgage Status in Hoboken
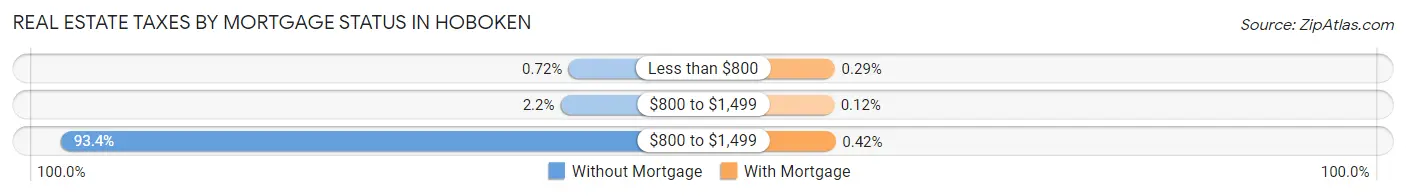
| Property Taxes | Without Mortgage | With Mortgage |
| Less than $800 | 14 (0.7%) | 22 (0.3%) |
| $800 to $1,499 | 42 (2.2%) | 9 (0.1%) |
| $800 to $1,499 | 1,815 (93.4%) | 32 (0.4%) |
| Total | 1,944 (100.0%) | 7,645 (100.0%) |
Health & Disability in Hoboken
Health Insurance Coverage by Age in Hoboken
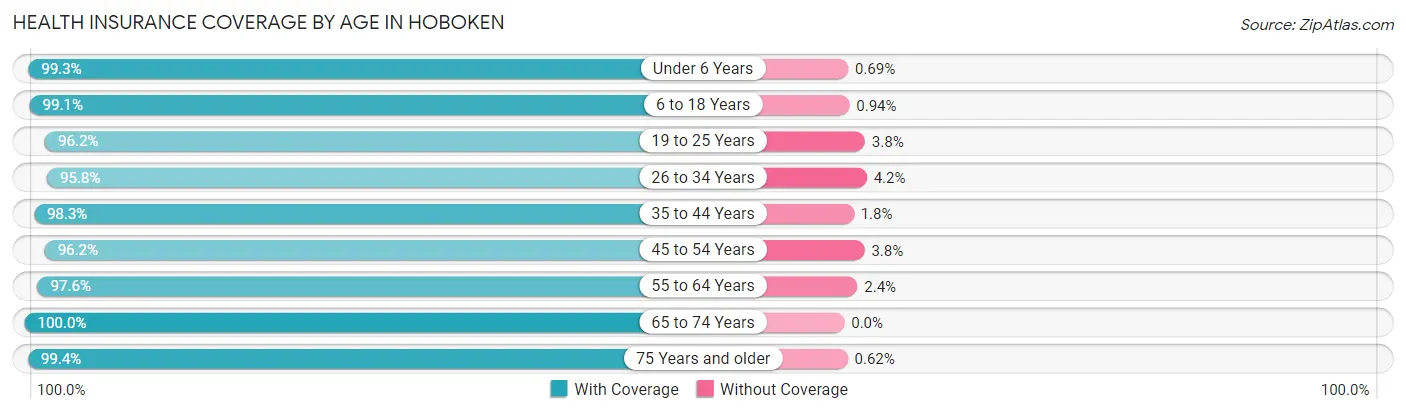
| Age Bracket | With Coverage | Without Coverage |
| Under 6 Years | 4,759 (99.3%) | 33 (0.7%) |
| 6 to 18 Years | 4,765 (99.1%) | 45 (0.9%) |
| 19 to 25 Years | 6,579 (96.2%) | 263 (3.8%) |
| 26 to 34 Years | 17,518 (95.8%) | 764 (4.2%) |
| 35 to 44 Years | 10,785 (98.3%) | 192 (1.8%) |
| 45 to 54 Years | 5,011 (96.2%) | 196 (3.8%) |
| 55 to 64 Years | 3,886 (97.6%) | 97 (2.4%) |
| 65 to 74 Years | 2,098 (100.0%) | 0 (0.0%) |
| 75 Years and older | 1,750 (99.4%) | 11 (0.6%) |
| Total | 57,151 (97.3%) | 1,601 (2.7%) |
Health Insurance Coverage by Citizenship Status in Hoboken
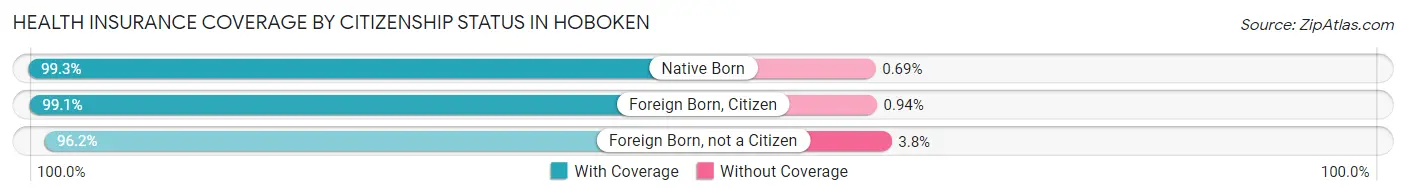
| Citizenship Status | With Coverage | Without Coverage |
| Native Born | 4,759 (99.3%) | 33 (0.7%) |
| Foreign Born, Citizen | 4,765 (99.1%) | 45 (0.9%) |
| Foreign Born, not a Citizen | 6,579 (96.2%) | 263 (3.8%) |
Health Insurance Coverage by Household Income in Hoboken
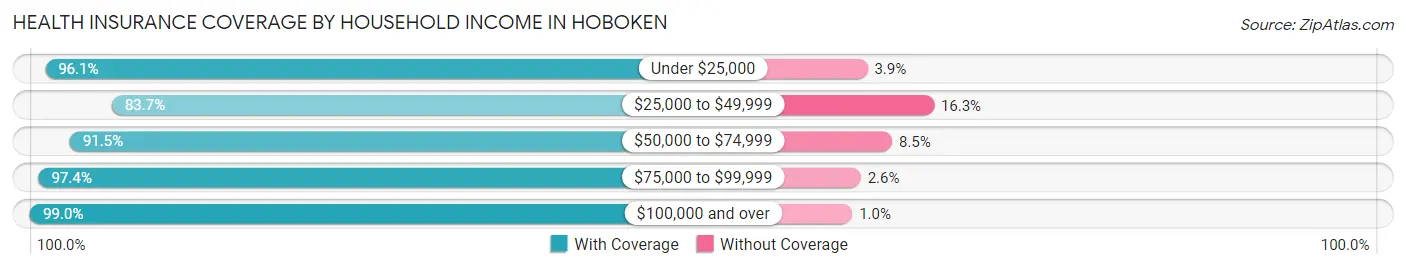
| Household Income | With Coverage | Without Coverage |
| Under $25,000 | 4,396 (96.1%) | 177 (3.9%) |
| $25,000 to $49,999 | 2,762 (83.7%) | 539 (16.3%) |
| $50,000 to $74,999 | 3,248 (91.5%) | 301 (8.5%) |
| $75,000 to $99,999 | 3,055 (97.4%) | 82 (2.6%) |
| $100,000 and over | 41,977 (99.0%) | 429 (1.0%) |
Public vs Private Health Insurance Coverage by Age in Hoboken
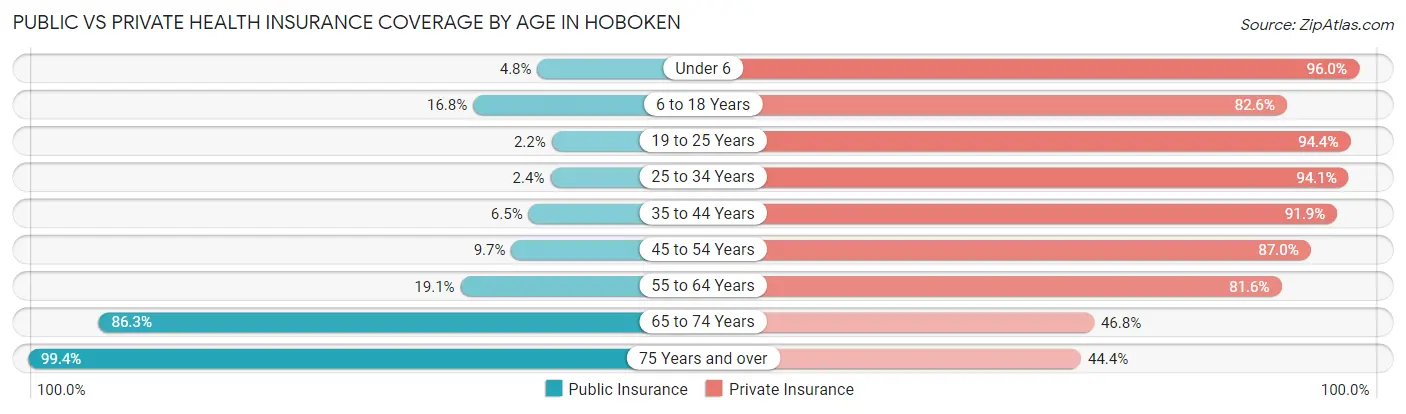
| Age Bracket | Public Insurance | Private Insurance |
| Under 6 | 231 (4.8%) | 4,599 (96.0%) |
| 6 to 18 Years | 806 (16.8%) | 3,973 (82.6%) |
| 19 to 25 Years | 150 (2.2%) | 6,457 (94.4%) |
| 25 to 34 Years | 444 (2.4%) | 17,194 (94.1%) |
| 35 to 44 Years | 710 (6.5%) | 10,091 (91.9%) |
| 45 to 54 Years | 503 (9.7%) | 4,530 (87.0%) |
| 55 to 64 Years | 761 (19.1%) | 3,249 (81.6%) |
| 65 to 74 Years | 1,810 (86.3%) | 982 (46.8%) |
| 75 Years and over | 1,750 (99.4%) | 782 (44.4%) |
| Total | 7,165 (12.2%) | 51,857 (88.3%) |
Disability Status by Sex by Age in Hoboken
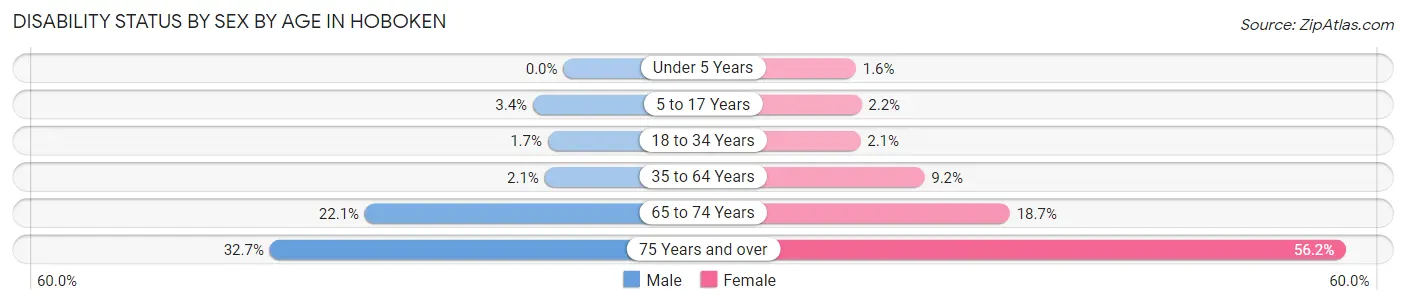
| Age Bracket | Male | Female |
| Under 5 Years | 0 (0.0%) | 34 (1.6%) |
| 5 to 17 Years | 69 (3.4%) | 54 (2.2%) |
| 18 to 34 Years | 233 (1.7%) | 261 (2.1%) |
| 35 to 64 Years | 207 (2.1%) | 937 (9.2%) |
| 65 to 74 Years | 219 (22.1%) | 207 (18.7%) |
| 75 Years and over | 188 (32.7%) | 666 (56.2%) |
Disability Class by Sex by Age in Hoboken
Disability Class: Hearing Difficulty
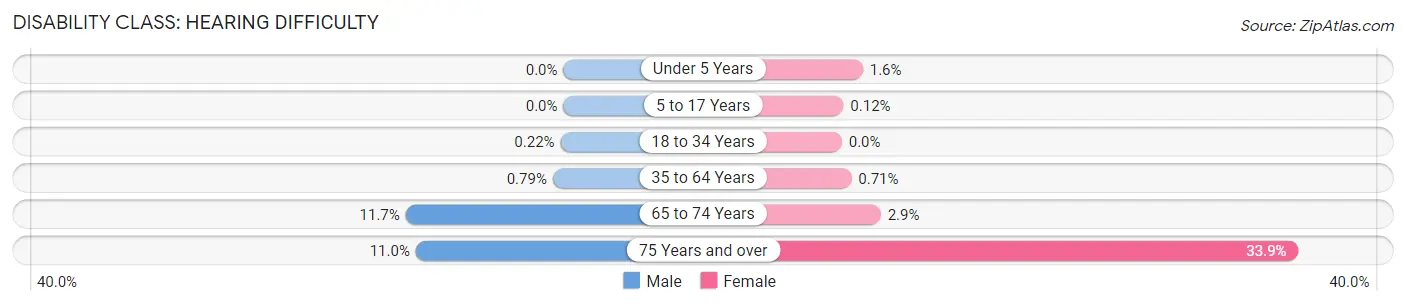
| Age Bracket | Male | Female |
| Under 5 Years | 0 (0.0%) | 34 (1.6%) |
| 5 to 17 Years | 0 (0.0%) | 3 (0.1%) |
| 18 to 34 Years | 29 (0.2%) | 0 (0.0%) |
| 35 to 64 Years | 79 (0.8%) | 72 (0.7%) |
| 65 to 74 Years | 116 (11.7%) | 32 (2.9%) |
| 75 Years and over | 63 (11.0%) | 402 (33.9%) |
Disability Class: Vision Difficulty
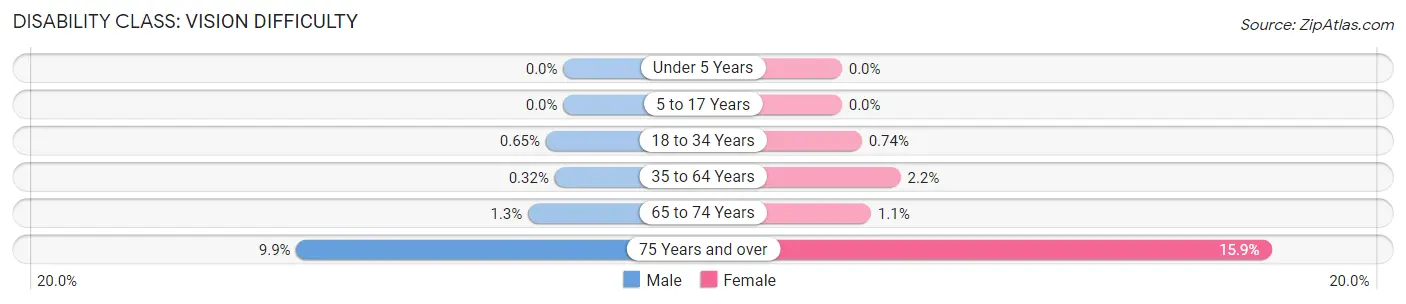
| Age Bracket | Male | Female |
| Under 5 Years | 0 (0.0%) | 0 (0.0%) |
| 5 to 17 Years | 0 (0.0%) | 0 (0.0%) |
| 18 to 34 Years | 88 (0.6%) | 94 (0.7%) |
| 35 to 64 Years | 32 (0.3%) | 222 (2.2%) |
| 65 to 74 Years | 13 (1.3%) | 12 (1.1%) |
| 75 Years and over | 57 (9.9%) | 189 (15.9%) |
Disability Class: Cognitive Difficulty
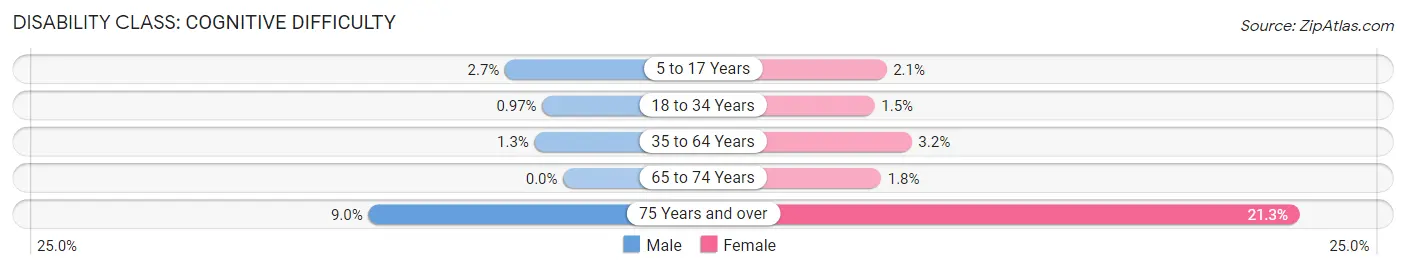
| Age Bracket | Male | Female |
| 5 to 17 Years | 55 (2.7%) | 51 (2.1%) |
| 18 to 34 Years | 130 (1.0%) | 191 (1.5%) |
| 35 to 64 Years | 133 (1.3%) | 329 (3.2%) |
| 65 to 74 Years | 0 (0.0%) | 20 (1.8%) |
| 75 Years and over | 52 (9.0%) | 252 (21.2%) |
Disability Class: Ambulatory Difficulty
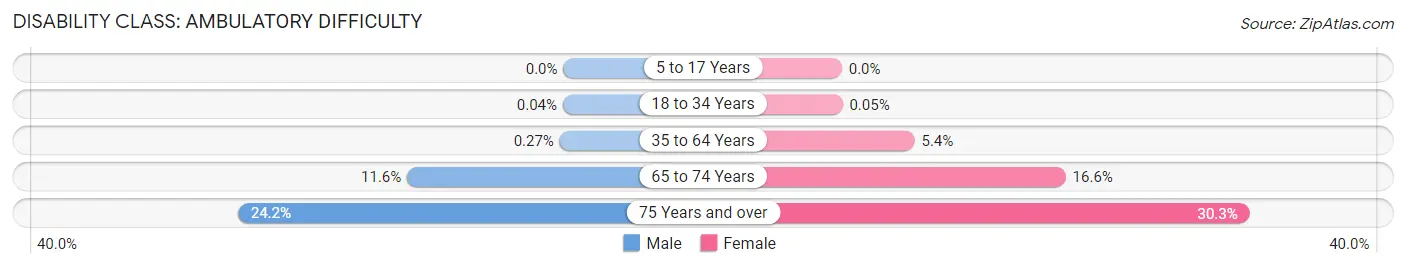
| Age Bracket | Male | Female |
| 5 to 17 Years | 0 (0.0%) | 0 (0.0%) |
| 18 to 34 Years | 5 (0.0%) | 6 (0.1%) |
| 35 to 64 Years | 27 (0.3%) | 551 (5.4%) |
| 65 to 74 Years | 115 (11.6%) | 184 (16.6%) |
| 75 Years and over | 139 (24.2%) | 359 (30.3%) |
Disability Class: Self-Care Difficulty
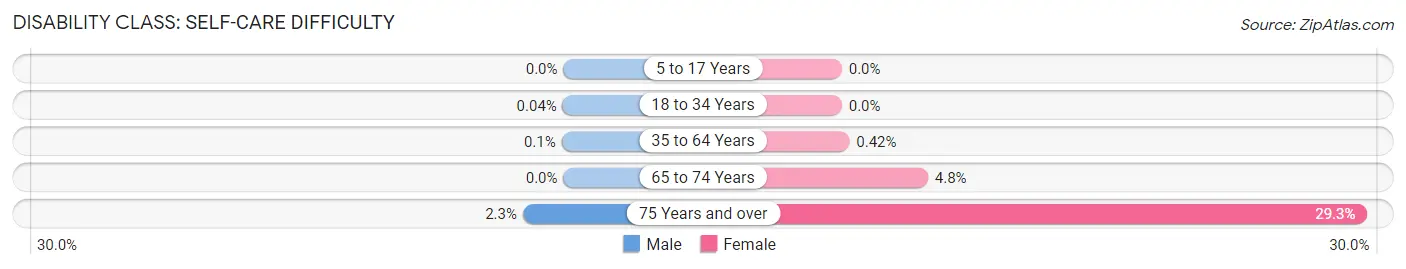
| Age Bracket | Male | Female |
| 5 to 17 Years | 0 (0.0%) | 0 (0.0%) |
| 18 to 34 Years | 5 (0.0%) | 0 (0.0%) |
| 35 to 64 Years | 10 (0.1%) | 43 (0.4%) |
| 65 to 74 Years | 0 (0.0%) | 53 (4.8%) |
| 75 Years and over | 13 (2.3%) | 347 (29.3%) |
Technology Access in Hoboken
Computing Device Access in Hoboken
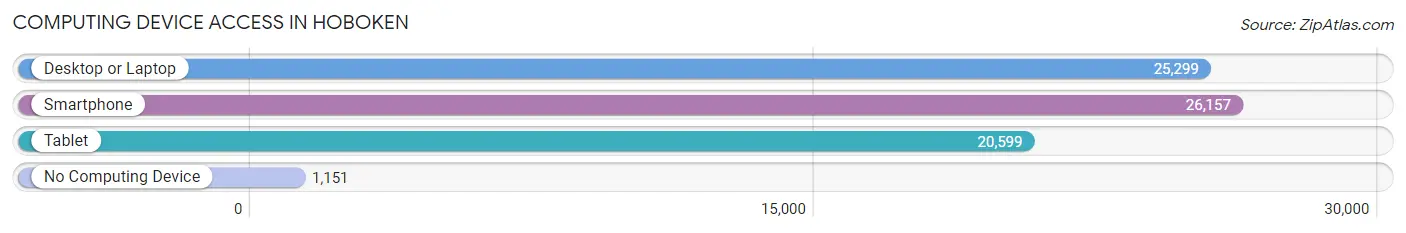
| Device Type | # Households | % Households |
| Desktop or Laptop | 25,299 | 90.7% |
| Smartphone | 26,157 | 93.8% |
| Tablet | 20,599 | 73.9% |
| No Computing Device | 1,151 | 4.1% |
| Total | 27,879 | 100.0% |
Internet Access in Hoboken
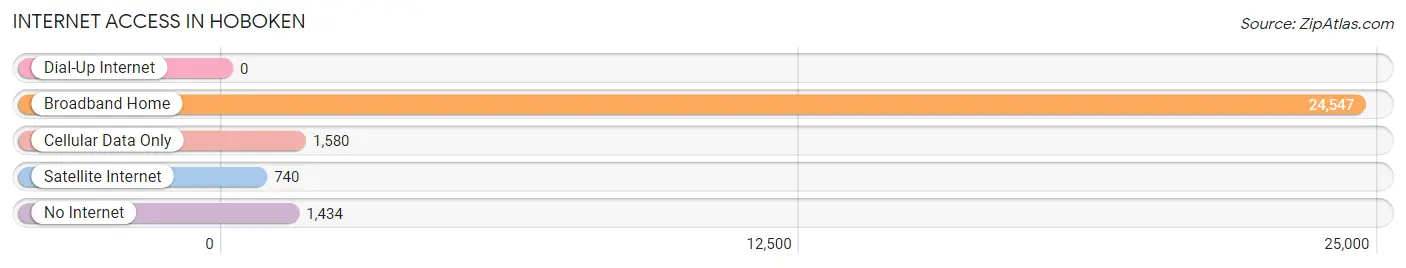
| Internet Type | # Households | % Households |
| Dial-Up Internet | 0 | 0.0% |
| Broadband Home | 24,547 | 88.0% |
| Cellular Data Only | 1,580 | 5.7% |
| Satellite Internet | 740 | 2.6% |
| No Internet | 1,434 | 5.1% |
| Total | 27,879 | 100.0% |
Hoboken Summary
Hoboken, NJ is a city located in Hudson County, New Jersey, United States. It is situated on the Hudson River, directly across from Manhattan. As of the 2010 United States Census, the city's population was 50,005, making it the state's 11th-largest municipality. Hoboken is part of the New York metropolitan area and is the site of Hoboken Terminal, a major transportation hub for the region.
History
Hoboken was originally inhabited by the Lenape Native Americans. In 1630, the Dutch West India Company purchased the land from the Lenape and established a small trading post. The settlement was named Hoboken after the Dutch town of Hoek van Holland. The area was part of Bergen Township until 1820, when it became a separate municipality.
In 1855, the North Hudson County Railway opened, connecting Hoboken to Jersey City and other points in Hudson County. This led to an influx of German and Irish immigrants, who established the city's first breweries and distilleries. By the late 19th century, Hoboken had become a major industrial center, with factories producing textiles, cigars, and other goods.
Geography
Hoboken is located at 40°44′N 74°02′W (40.735, -74.033). According to the United States Census Bureau, the city has a total area of 2.25 square miles (5.83 km2), of which 0.94 square miles (2.43 km2) is land and 1.31 square miles (3.40 km2) is water.
The city is situated on the west bank of the Hudson River, directly across from Manhattan. It is bordered by Jersey City to the south and Weehawken to the north. The city is located on the Palisades, a line of steep cliffs along the western shore of the Hudson River.
Economy
Hoboken is a major commercial and transportation hub for the region. The city is home to several large corporations, including Stevens Institute of Technology, John Wiley & Sons, and the New York Stock Exchange. The city is also a popular destination for tourists, with numerous restaurants, bars, and shops.
The city's economy is largely based on services, with the largest employers being educational services, health care, and social assistance. The city also has a large retail sector, with numerous stores, restaurants, and bars.
Demographics
As of the 2010 United States Census, there were 50,005 people, 22,845 households, and 10,845 families residing in the city. The population density was 5,323.3 people per square mile (2,054.2/km2). There were 24,845 housing units at an average density of 2,637.2 per square mile (1,017.7/km2). The racial makeup of the city was 64.2% White, 11.2% African American, 0.3% Native American, 11.7% Asian, 0.1% Pacific Islander, 8.7% from other races, and 3.9% from two or more races. Hispanic or Latino of any race were 28.6% of the population.
The median income for a household in the city was $60,879, and the median income for a family was $76,924. Males had a median income of $51,939 versus $41,939 for females. The per capita income for the city was $35,836. About 8.2% of families and 11.0% of the population were below the poverty line, including 15.2% of those under age 18 and 8.6% of those age 65 or over.
Common Questions
What is Per Capita Income in Hoboken?
Per Capita income in Hoboken is $102,492.
What is the Median Family Income in Hoboken?
Median Family Income in Hoboken is $236,742.
What is the Median Household income in Hoboken?
Median Household Income in Hoboken is $168,137.
What is Income or Wage Gap in Hoboken?
Income or Wage Gap in Hoboken is 19.7%.
Women in Hoboken earn 80.3 cents for every dollar earned by a man.
What is Inequality or Gini Index in Hoboken?
Inequality or Gini Index in Hoboken is 0.47.
What is the Total Population of Hoboken?
Total Population of Hoboken is 58,754.
What is the Total Male Population of Hoboken?
Total Male Population of Hoboken is 28,954.
What is the Total Female Population of Hoboken?
Total Female Population of Hoboken is 29,800.
What is the Ratio of Males per 100 Females in Hoboken?
There are 97.16 Males per 100 Females in Hoboken.
What is the Ratio of Females per 100 Males in Hoboken?
There are 102.92 Females per 100 Males in Hoboken.
What is the Median Population Age in Hoboken?
Median Population Age in Hoboken is 32.0 Years.
What is the Average Family Size in Hoboken
Average Family Size in Hoboken is 2.7 People.
What is the Average Household Size in Hoboken
Average Household Size in Hoboken is 2.0 People.
How Large is the Labor Force in Hoboken?
There are 40,400 People in the Labor Forcein in Hoboken.
What is the Percentage of People in the Labor Force in Hoboken?
80.0% of People are in the Labor Force in Hoboken.
What is the Unemployment Rate in Hoboken?
Unemployment Rate in Hoboken is 3.5%.