Bernardsville borough, NJ Map & Demographics
Bernardsville borough Overview
$106,706
PER CAPITA INCOME
$235,625
AVG FAMILY INCOME
$220,060
AVG HOUSEHOLD INCOME
33.4%
WAGE / INCOME GAP [ % ]
66.6¢/ $1
WAGE / INCOME GAP [ $ ]
0.50
INEQUALITY / GINI INDEX
7,888
TOTAL POPULATION
4,016
MALE POPULATION
3,872
FEMALE POPULATION
103.72
MALES / 100 FEMALES
96.41
FEMALES / 100 MALES
40.5
MEDIAN AGE
3.2
AVG FAMILY SIZE
2.9
AVG HOUSEHOLD SIZE
4,112
LABOR FORCE [ PEOPLE ]
67.1%
PERCENT IN LABOR FORCE
5.5%
UNEMPLOYMENT RATE
Income in Bernardsville borough
Income Overview in Bernardsville borough
Per Capita Income in Bernardsville borough is $106,706, while median incomes of families and households are $235,625 and $220,060 respectively.
| Characteristic | Number | Measure |
| Per Capita Income | 7,888 | $106,706 |
| Median Family Income | 2,235 | $235,625 |
| Mean Family Income | 2,235 | $327,228 |
| Median Household Income | 2,680 | $220,060 |
| Mean Household Income | 2,680 | $312,818 |
| Income Deficit | 2,235 | $0 |
| Wage / Income Gap (%) | 7,888 | 33.41% |
| Wage / Income Gap ($) | 7,888 | 66.59¢ per $1 |
| Gini / Inequality Index | 7,888 | 0.50 |
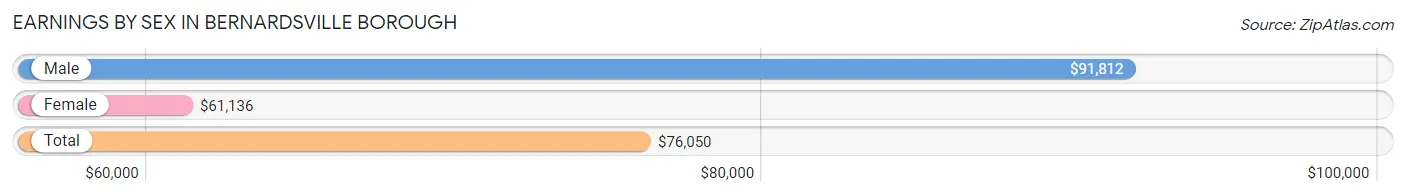
Earnings by Sex in Bernardsville borough
Average Earnings in Bernardsville borough are $76,050, $91,812 for men and $61,136 for women, a difference of 33.4%.
| Sex | Number | Average Earnings |
| Male | 2,414 (53.1%) | $91,812 |
| Female | 2,130 (46.9%) | $61,136 |
| Total | 4,544 (100.0%) | $76,050 |
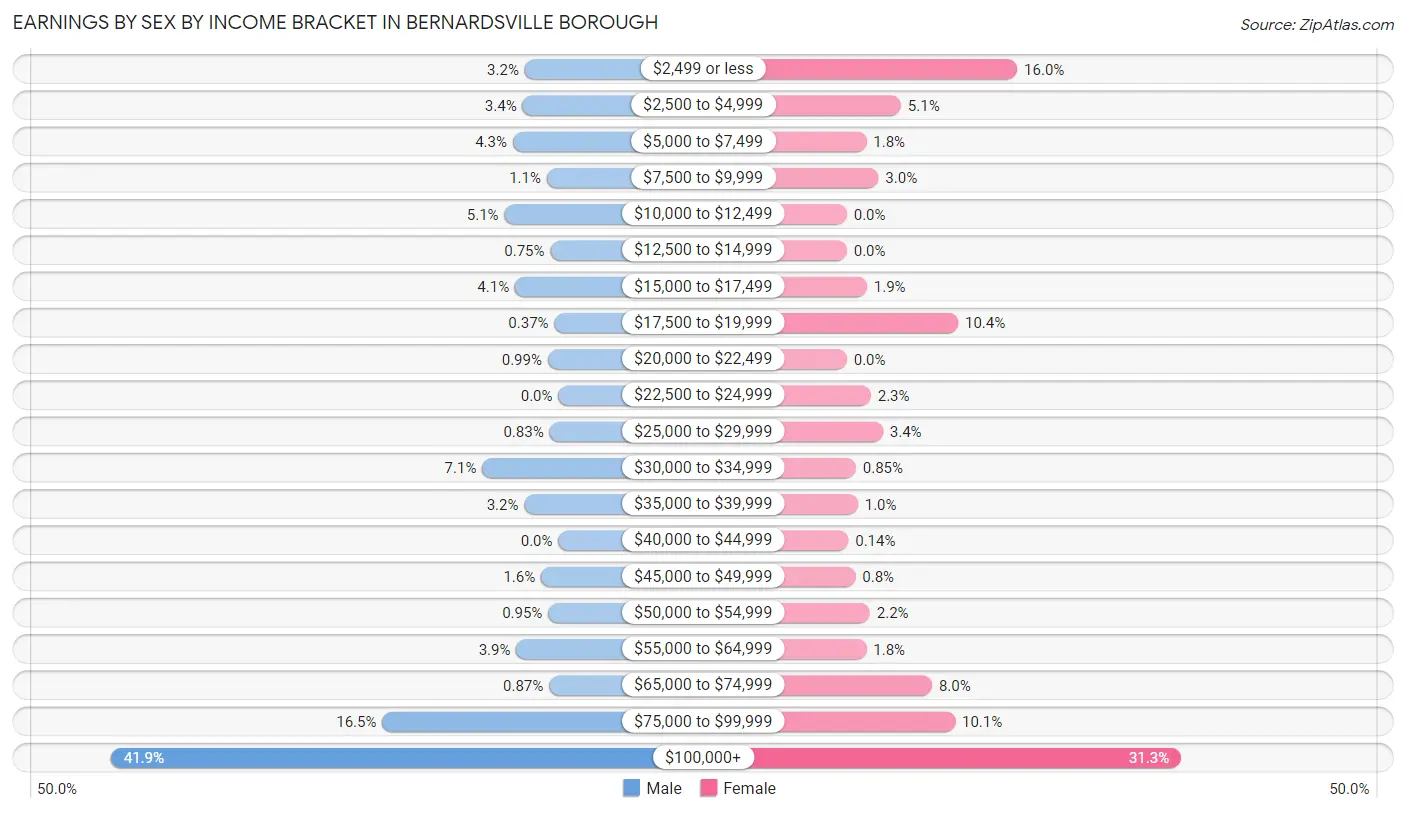
Earnings by Sex by Income Bracket in Bernardsville borough
The most common earnings brackets in Bernardsville borough are $100,000+ for men (1,012 | 41.9%) and $100,000+ for women (667 | 31.3%).
| Income | Male | Female |
| $2,499 or less | 76 (3.2%) | 340 (16.0%) |
| $2,500 to $4,999 | 81 (3.4%) | 108 (5.1%) |
| $5,000 to $7,499 | 103 (4.3%) | 39 (1.8%) |
| $7,500 to $9,999 | 26 (1.1%) | 63 (3.0%) |
| $10,000 to $12,499 | 122 (5.1%) | 0 (0.0%) |
| $12,500 to $14,999 | 18 (0.7%) | 0 (0.0%) |
| $15,000 to $17,499 | 98 (4.1%) | 40 (1.9%) |
| $17,500 to $19,999 | 9 (0.4%) | 222 (10.4%) |
| $20,000 to $22,499 | 24 (1.0%) | 0 (0.0%) |
| $22,500 to $24,999 | 0 (0.0%) | 48 (2.2%) |
| $25,000 to $29,999 | 20 (0.8%) | 72 (3.4%) |
| $30,000 to $34,999 | 172 (7.1%) | 18 (0.9%) |
| $35,000 to $39,999 | 77 (3.2%) | 22 (1.0%) |
| $40,000 to $44,999 | 0 (0.0%) | 3 (0.1%) |
| $45,000 to $49,999 | 39 (1.6%) | 17 (0.8%) |
| $50,000 to $54,999 | 23 (0.9%) | 46 (2.2%) |
| $55,000 to $64,999 | 95 (3.9%) | 39 (1.8%) |
| $65,000 to $74,999 | 21 (0.9%) | 170 (8.0%) |
| $75,000 to $99,999 | 398 (16.5%) | 216 (10.1%) |
| $100,000+ | 1,012 (41.9%) | 667 (31.3%) |
| Total | 2,414 (100.0%) | 2,130 (100.0%) |
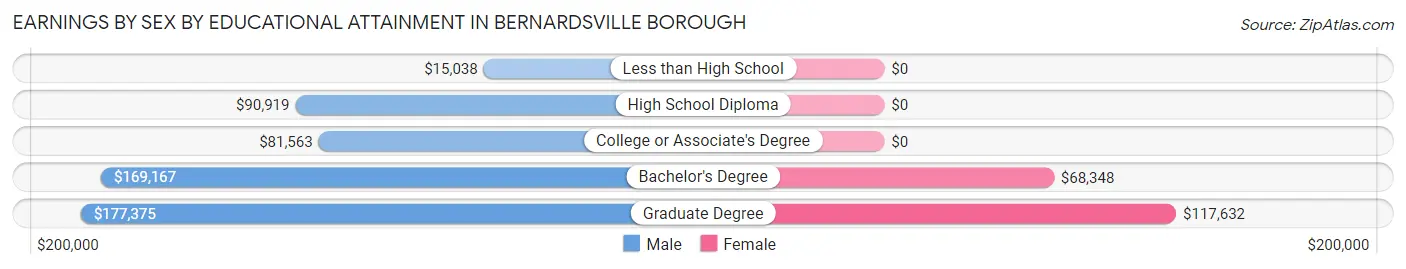
Earnings by Sex by Educational Attainment in Bernardsville borough
Average earnings in Bernardsville borough are $94,188 for men and $70,192 for women, a difference of 25.5%. Men with an educational attainment of graduate degree enjoy the highest average annual earnings of $177,375, while those with less than high school education earn the least with $15,038. Women with an educational attainment of graduate degree earn the most with the average annual earnings of $117,632, while those with bachelor's degree education have the smallest earnings of $68,348.
| Educational Attainment | Male Income | Female Income |
| Less than High School | $15,038 | $0 |
| High School Diploma | $90,919 | $0 |
| College or Associate's Degree | $81,563 | $0 |
| Bachelor's Degree | $169,167 | $68,348 |
| Graduate Degree | $177,375 | $117,632 |
| Total | $94,188 | $70,192 |
Family Income in Bernardsville borough
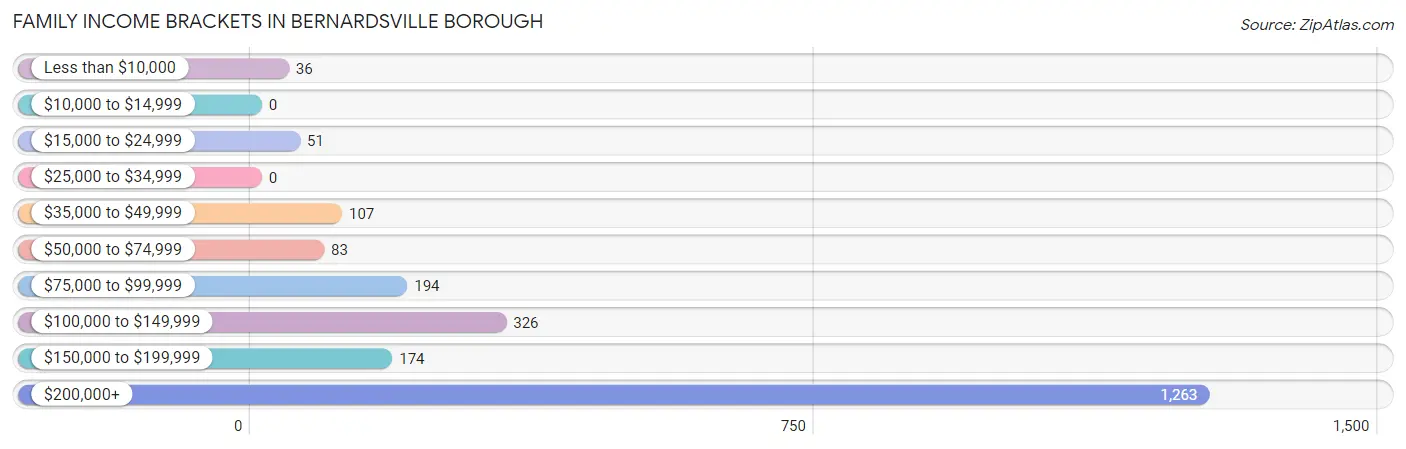
Family Income Brackets in Bernardsville borough
According to the Bernardsville borough family income data, there are 1,263 families falling into the $200,000+ income range, which is the most common income bracket and makes up 56.5% of all families.
| Income Bracket | # Families | % Families |
| Less than $10,000 | 36 | 1.6% |
| $10,000 to $14,999 | 0 | 0.0% |
| $15,000 to $24,999 | 51 | 2.3% |
| $25,000 to $34,999 | 0 | 0.0% |
| $35,000 to $49,999 | 107 | 4.8% |
| $50,000 to $74,999 | 83 | 3.7% |
| $75,000 to $99,999 | 194 | 8.7% |
| $100,000 to $149,999 | 326 | 14.6% |
| $150,000 to $199,999 | 174 | 7.8% |
| $200,000+ | 1,263 | 56.5% |
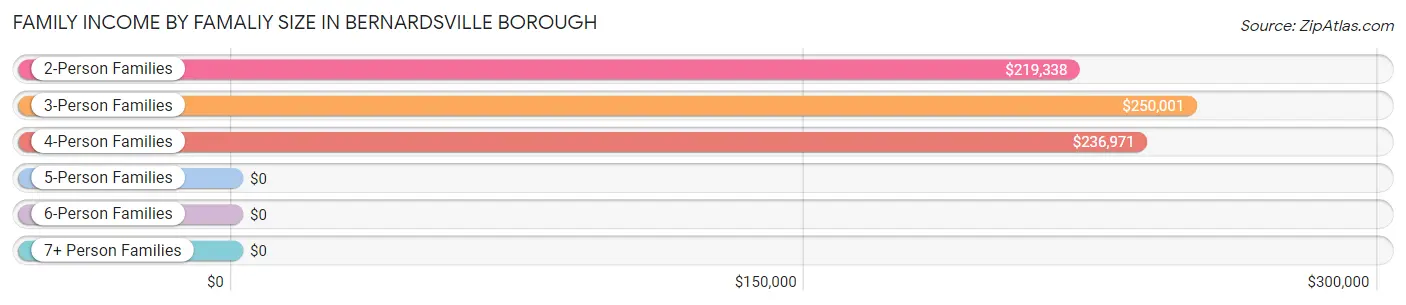
Family Income by Famaliy Size in Bernardsville borough
3-person families (496 | 22.2%) account for the highest median family income in Bernardsville borough with $250,001 per family, while 2-person families (1,017 | 45.5%) have the highest median income of $109,669 per family member.
| Income Bracket | # Families | Median Income |
| 2-Person Families | 1,017 (45.5%) | $219,338 |
| 3-Person Families | 496 (22.2%) | $250,001 |
| 4-Person Families | 449 (20.1%) | $236,971 |
| 5-Person Families | 273 (12.2%) | $0 |
| 6-Person Families | 0 (0.0%) | $0 |
| 7+ Person Families | 0 (0.0%) | $0 |
| Total | 2,235 (100.0%) | $235,625 |
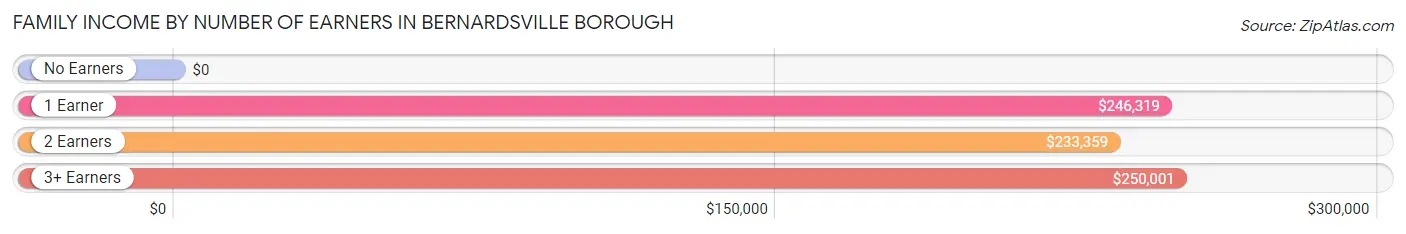
Family Income by Number of Earners in Bernardsville borough
| Number of Earners | # Families | Median Income |
| No Earners | 184 (8.2%) | $0 |
| 1 Earner | 637 (28.5%) | $246,319 |
| 2 Earners | 1,133 (50.7%) | $233,359 |
| 3+ Earners | 281 (12.6%) | $250,001 |
| Total | 2,235 (100.0%) | $235,625 |
Household Income in Bernardsville borough
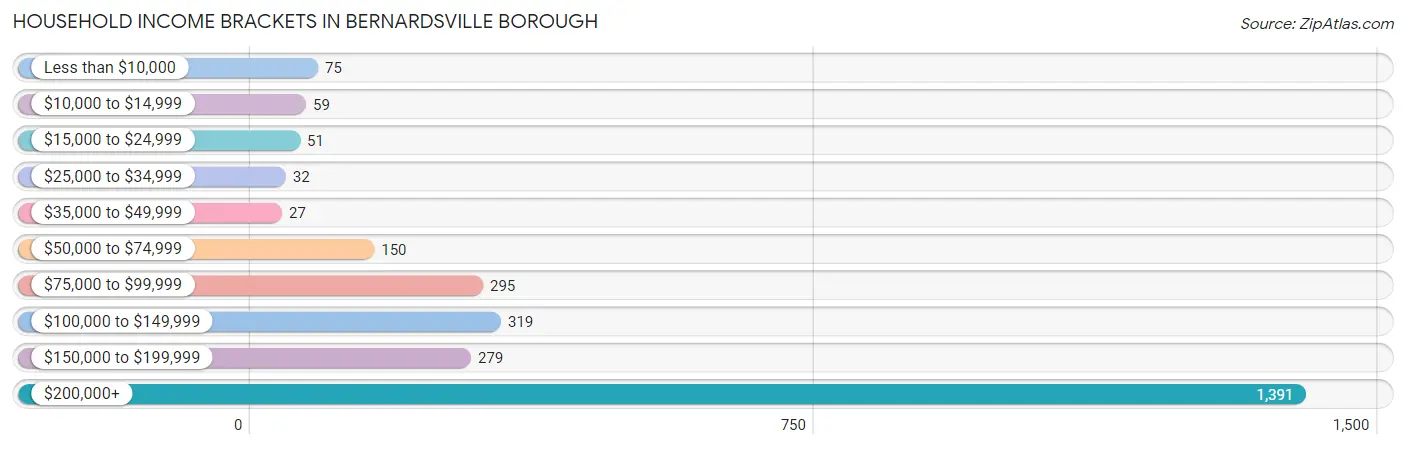
Household Income Brackets in Bernardsville borough
With 1,391 households falling in the category, the $200,000+ income range is the most frequent in Bernardsville borough, accounting for 51.9% of all households. In contrast, only 27 households (1.0%) fall into the $35,000 to $49,999 income bracket, making it the least populous group.
| Income Bracket | # Households | % Households |
| Less than $10,000 | 75 | 2.8% |
| $10,000 to $14,999 | 59 | 2.2% |
| $15,000 to $24,999 | 51 | 1.9% |
| $25,000 to $34,999 | 32 | 1.2% |
| $35,000 to $49,999 | 27 | 1.0% |
| $50,000 to $74,999 | 150 | 5.6% |
| $75,000 to $99,999 | 295 | 11.0% |
| $100,000 to $149,999 | 319 | 11.9% |
| $150,000 to $199,999 | 279 | 10.4% |
| $200,000+ | 1,391 | 51.9% |
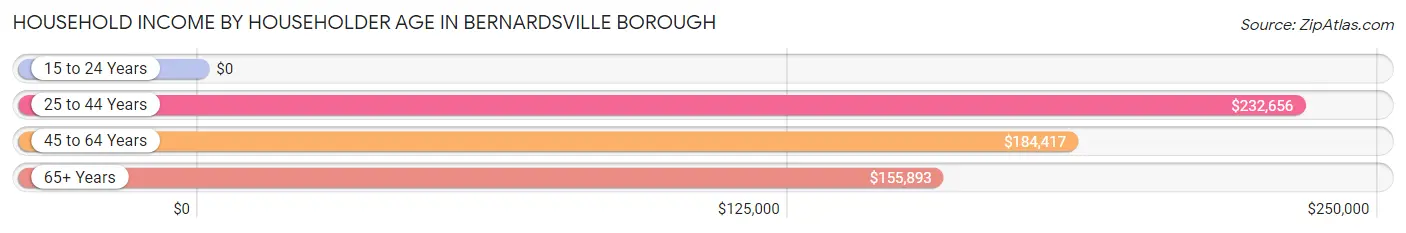
Household Income by Householder Age in Bernardsville borough
The median household income in Bernardsville borough is $220,060, with the highest median household income of $232,656 found in the 25 to 44 years age bracket for the primary householder. A total of 712 households (26.6%) fall into this category.
| Income Bracket | # Households | Median Income |
| 15 to 24 Years | 0 (0.0%) | $0 |
| 25 to 44 Years | 712 (26.6%) | $232,656 |
| 45 to 64 Years | 1,299 (48.5%) | $184,417 |
| 65+ Years | 669 (25.0%) | $155,893 |
| Total | 2,680 (100.0%) | $220,060 |
Poverty in Bernardsville borough
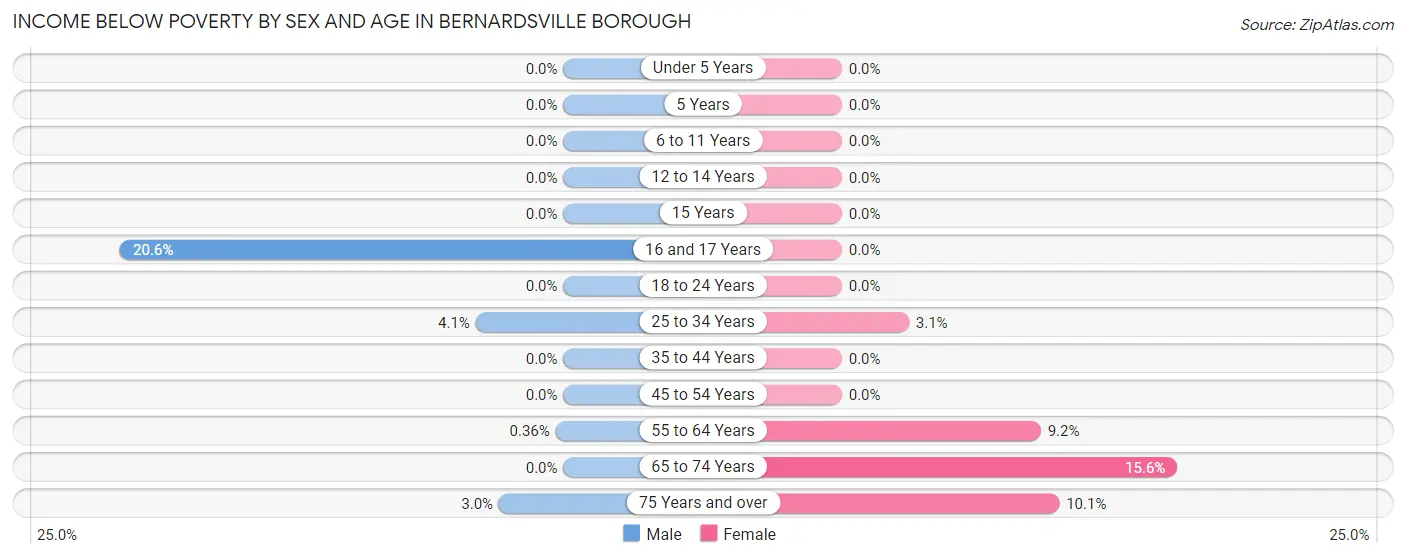
Income Below Poverty by Sex and Age in Bernardsville borough
With 1.4% poverty level for males and 3.8% for females among the residents of Bernardsville borough, 16 and 17 year old males and 65 to 74 year old females are the most vulnerable to poverty, with 29 males (20.6%) and 70 females (15.6%) in their respective age groups living below the poverty level.
| Age Bracket | Male | Female |
| Under 5 Years | 0 (0.0%) | 0 (0.0%) |
| 5 Years | 0 (0.0%) | 0 (0.0%) |
| 6 to 11 Years | 0 (0.0%) | 0 (0.0%) |
| 12 to 14 Years | 0 (0.0%) | 0 (0.0%) |
| 15 Years | 0 (0.0%) | 0 (0.0%) |
| 16 and 17 Years | 29 (20.6%) | 0 (0.0%) |
| 18 to 24 Years | 0 (0.0%) | 0 (0.0%) |
| 25 to 34 Years | 16 (4.1%) | 11 (3.1%) |
| 35 to 44 Years | 0 (0.0%) | 0 (0.0%) |
| 45 to 54 Years | 0 (0.0%) | 0 (0.0%) |
| 55 to 64 Years | 2 (0.4%) | 43 (9.2%) |
| 65 to 74 Years | 0 (0.0%) | 70 (15.6%) |
| 75 Years and over | 9 (3.0%) | 23 (10.1%) |
| Total | 56 (1.4%) | 147 (3.8%) |
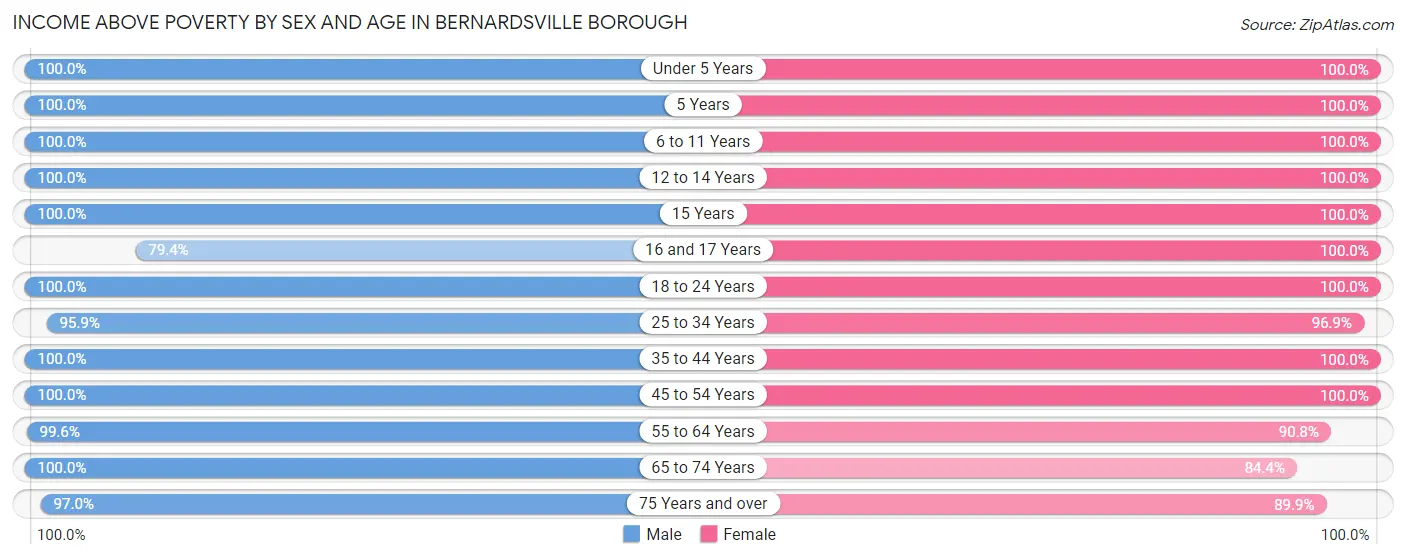
Income Above Poverty by Sex and Age in Bernardsville borough
According to the poverty statistics in Bernardsville borough, males aged under 5 years and females aged under 5 years are the age groups that are most secure financially, with 100.0% of males and 100.0% of females in these age groups living above the poverty line.
| Age Bracket | Male | Female |
| Under 5 Years | 398 (100.0%) | 69 (100.0%) |
| 5 Years | 37 (100.0%) | 91 (100.0%) |
| 6 to 11 Years | 360 (100.0%) | 344 (100.0%) |
| 12 to 14 Years | 177 (100.0%) | 161 (100.0%) |
| 15 Years | 45 (100.0%) | 76 (100.0%) |
| 16 and 17 Years | 112 (79.4%) | 247 (100.0%) |
| 18 to 24 Years | 226 (100.0%) | 154 (100.0%) |
| 25 to 34 Years | 377 (95.9%) | 343 (96.9%) |
| 35 to 44 Years | 424 (100.0%) | 537 (100.0%) |
| 45 to 54 Years | 591 (100.0%) | 693 (100.0%) |
| 55 to 64 Years | 558 (99.6%) | 423 (90.8%) |
| 65 to 74 Years | 363 (100.0%) | 380 (84.4%) |
| 75 Years and over | 292 (97.0%) | 205 (89.9%) |
| Total | 3,960 (98.6%) | 3,723 (96.2%) |
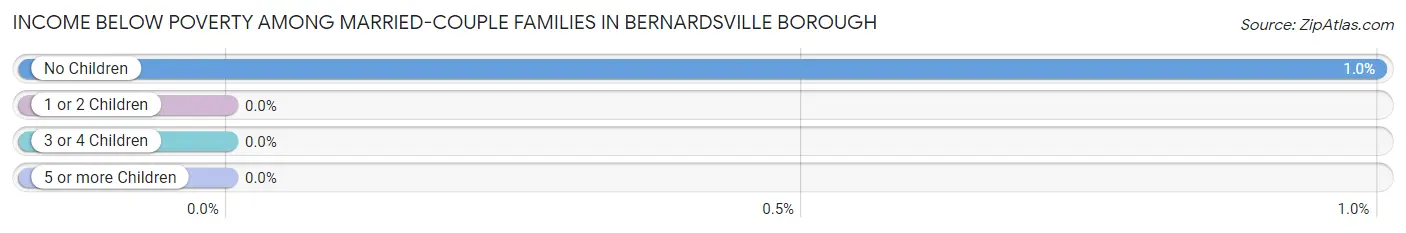
Income Below Poverty Among Married-Couple Families in Bernardsville borough
The poverty statistics for married-couple families in Bernardsville borough show that 0.5% or 9 of the total 1,811 families live below the poverty line. Families with no children have the highest poverty rate of 1.0%, comprising of 9 families. On the other hand, families with 1 or 2 children have the lowest poverty rate of 0.0%, which includes 0 families.
| Children | Above Poverty | Below Poverty |
| No Children | 895 (99.0%) | 9 (1.0%) |
| 1 or 2 Children | 730 (100.0%) | 0 (0.0%) |
| 3 or 4 Children | 177 (100.0%) | 0 (0.0%) |
| 5 or more Children | 0 (0.0%) | 0 (0.0%) |
| Total | 1,802 (99.5%) | 9 (0.5%) |
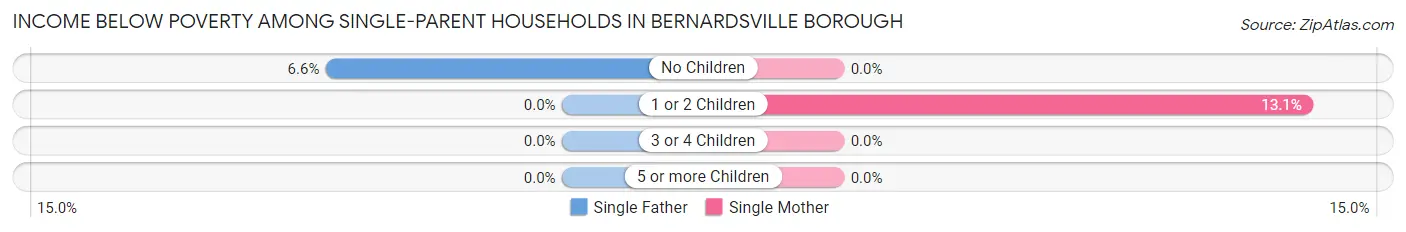
Income Below Poverty Among Single-Parent Households in Bernardsville borough
According to the poverty data in Bernardsville borough, 4.6% or 7 single-father households and 9.6% or 26 single-mother households are living below the poverty line. Among single-father households, those with no children have the highest poverty rate, with 7 households (6.6%) experiencing poverty. Likewise, among single-mother households, those with 1 or 2 children have the highest poverty rate, with 26 households (13.1%) falling below the poverty line.
| Children | Single Father | Single Mother |
| No Children | 7 (6.6%) | 0 (0.0%) |
| 1 or 2 Children | 0 (0.0%) | 26 (13.1%) |
| 3 or 4 Children | 0 (0.0%) | 0 (0.0%) |
| 5 or more Children | 0 (0.0%) | 0 (0.0%) |
| Total | 7 (4.6%) | 26 (9.6%) |
Income Below Poverty Among Married-Couple vs Single-Parent Households in Bernardsville borough
The poverty data for Bernardsville borough shows that 9 of the married-couple family households (0.5%) and 33 of the single-parent households (7.8%) are living below the poverty level. Within the married-couple family households, those with no children have the highest poverty rate, with 9 households (1.0%) falling below the poverty line. Among the single-parent households, those with 1 or 2 children have the highest poverty rate, with 26 household (10.6%) living below poverty.
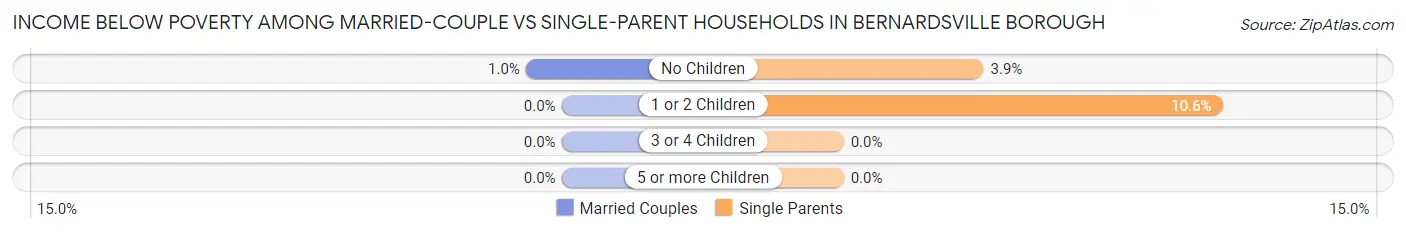
| Children | Married-Couple Families | Single-Parent Households |
| No Children | 9 (1.0%) | 7 (3.9%) |
| 1 or 2 Children | 0 (0.0%) | 26 (10.6%) |
| 3 or 4 Children | 0 (0.0%) | 0 (0.0%) |
| 5 or more Children | 0 (0.0%) | 0 (0.0%) |
| Total | 9 (0.5%) | 33 (7.8%) |
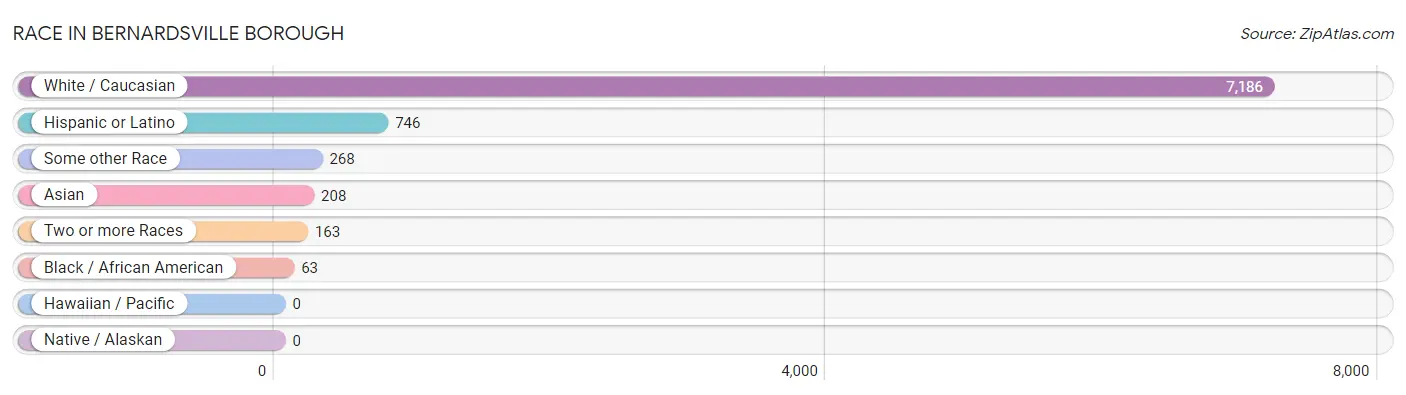
Race in Bernardsville borough
The most populous races in Bernardsville borough are White / Caucasian (7,186 | 91.1%), Hispanic or Latino (746 | 9.5%), and Some other Race (268 | 3.4%).
| Race | # Population | % Population |
| Asian | 208 | 2.6% |
| Black / African American | 63 | 0.8% |
| Hawaiian / Pacific | 0 | 0.0% |
| Hispanic or Latino | 746 | 9.5% |
| Native / Alaskan | 0 | 0.0% |
| White / Caucasian | 7,186 | 91.1% |
| Two or more Races | 163 | 2.1% |
| Some other Race | 268 | 3.4% |
| Total | 7,888 | 100.0% |
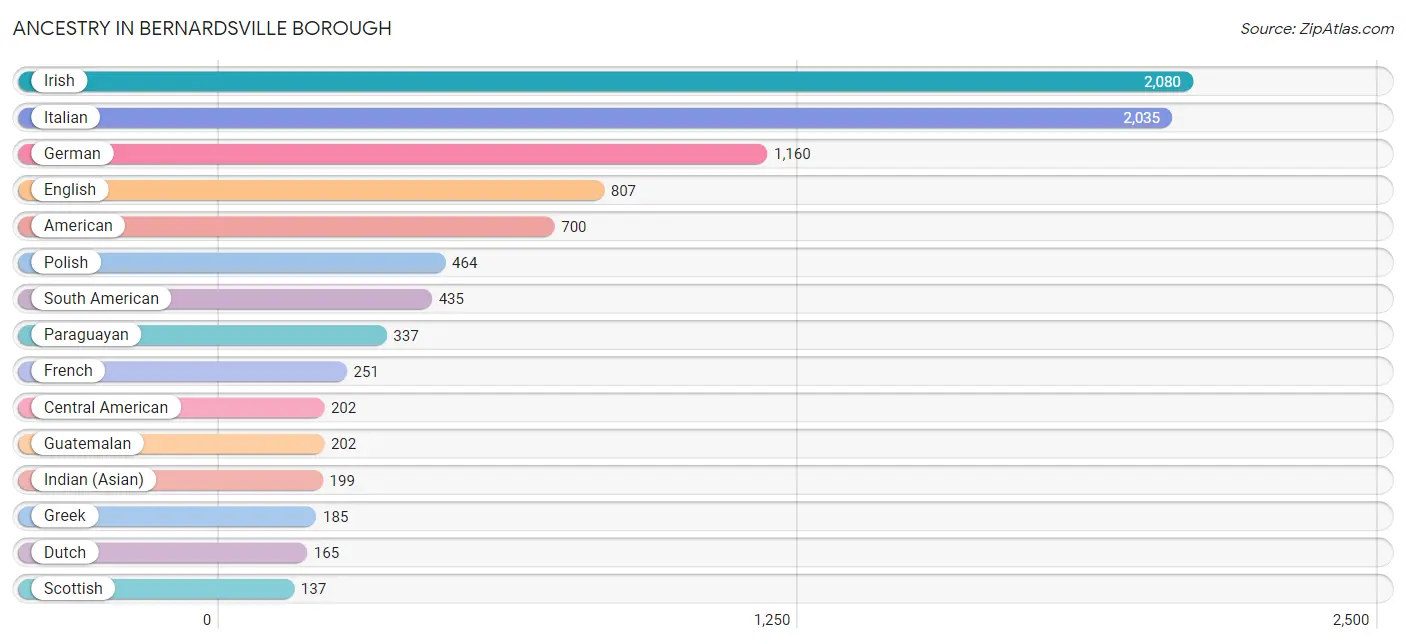
Ancestry in Bernardsville borough
The most populous ancestries reported in Bernardsville borough are Irish (2,080 | 26.4%), Italian (2,035 | 25.8%), German (1,160 | 14.7%), English (807 | 10.2%), and American (700 | 8.9%), together accounting for 86.0% of all Bernardsville borough residents.
| Ancestry | # Population | % Population |
| American | 700 | 8.9% |
| Arab | 32 | 0.4% |
| Austrian | 113 | 1.4% |
| Bhutanese | 9 | 0.1% |
| Brazilian | 17 | 0.2% |
| British | 29 | 0.4% |
| Burmese | 37 | 0.5% |
| Canadian | 51 | 0.6% |
| Carpatho Rusyn | 10 | 0.1% |
| Central American | 202 | 2.6% |
| Cuban | 16 | 0.2% |
| Czech | 103 | 1.3% |
| Czechoslovakian | 107 | 1.4% |
| Danish | 35 | 0.4% |
| Dutch | 165 | 2.1% |
| Eastern European | 103 | 1.3% |
| Ecuadorian | 98 | 1.2% |
| English | 807 | 10.2% |
| European | 109 | 1.4% |
| Finnish | 1 | 0.0% |
| French | 251 | 3.2% |
| French Canadian | 14 | 0.2% |
| German | 1,160 | 14.7% |
| Greek | 185 | 2.4% |
| Guatemalan | 202 | 2.6% |
| Hungarian | 69 | 0.9% |
| Indian (Asian) | 199 | 2.5% |
| Irish | 2,080 | 26.4% |
| Italian | 2,035 | 25.8% |
| Mexican | 14 | 0.2% |
| Nigerian | 1 | 0.0% |
| Norwegian | 58 | 0.7% |
| Paraguayan | 337 | 4.3% |
| Polish | 464 | 5.9% |
| Portuguese | 18 | 0.2% |
| Puerto Rican | 56 | 0.7% |
| Russian | 40 | 0.5% |
| Scotch-Irish | 80 | 1.0% |
| Scottish | 137 | 1.7% |
| Slovak | 30 | 0.4% |
| South African | 13 | 0.2% |
| South American | 435 | 5.5% |
| Subsaharan African | 14 | 0.2% |
| Swedish | 83 | 1.1% |
| Swiss | 44 | 0.6% |
| Syrian | 32 | 0.4% |
| Ukrainian | 27 | 0.3% | View All 47 Rows |
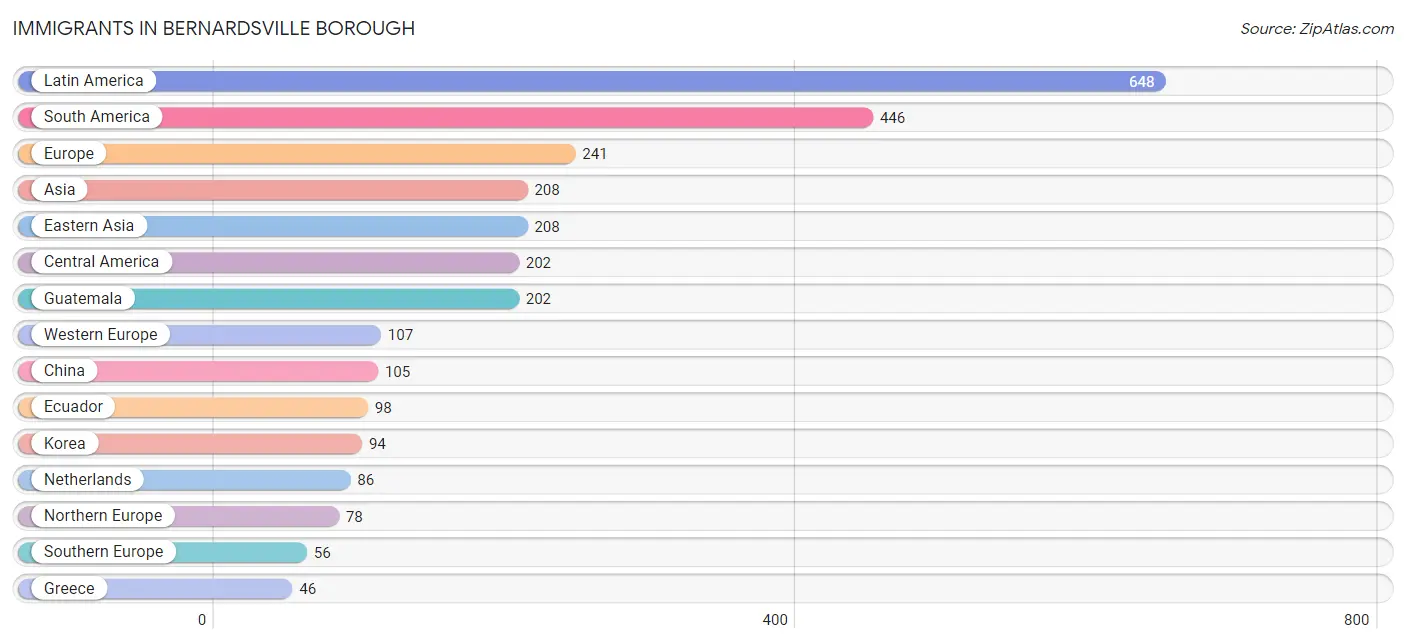
Immigrants in Bernardsville borough
The most numerous immigrant groups reported in Bernardsville borough came from Latin America (648 | 8.2%), South America (446 | 5.7%), Europe (241 | 3.1%), Asia (208 | 2.6%), and Eastern Asia (208 | 2.6%), together accounting for 22.2% of all Bernardsville borough residents.
| Immigration Origin | # Population | % Population |
| Africa | 1 | 0.0% |
| Asia | 208 | 2.6% |
| Austria | 21 | 0.3% |
| Brazil | 8 | 0.1% |
| Central America | 202 | 2.6% |
| China | 105 | 1.3% |
| Eastern Asia | 208 | 2.6% |
| Ecuador | 98 | 1.2% |
| England | 8 | 0.1% |
| Europe | 241 | 3.1% |
| Greece | 46 | 0.6% |
| Guatemala | 202 | 2.6% |
| Ireland | 15 | 0.2% |
| Italy | 10 | 0.1% |
| Japan | 9 | 0.1% |
| Korea | 94 | 1.2% |
| Latin America | 648 | 8.2% |
| Netherlands | 86 | 1.1% |
| Nigeria | 1 | 0.0% |
| Northern Europe | 78 | 1.0% |
| South America | 446 | 5.7% |
| Southern Europe | 56 | 0.7% |
| Taiwan | 20 | 0.3% |
| Western Africa | 1 | 0.0% |
| Western Europe | 107 | 1.4% | View All 25 Rows |
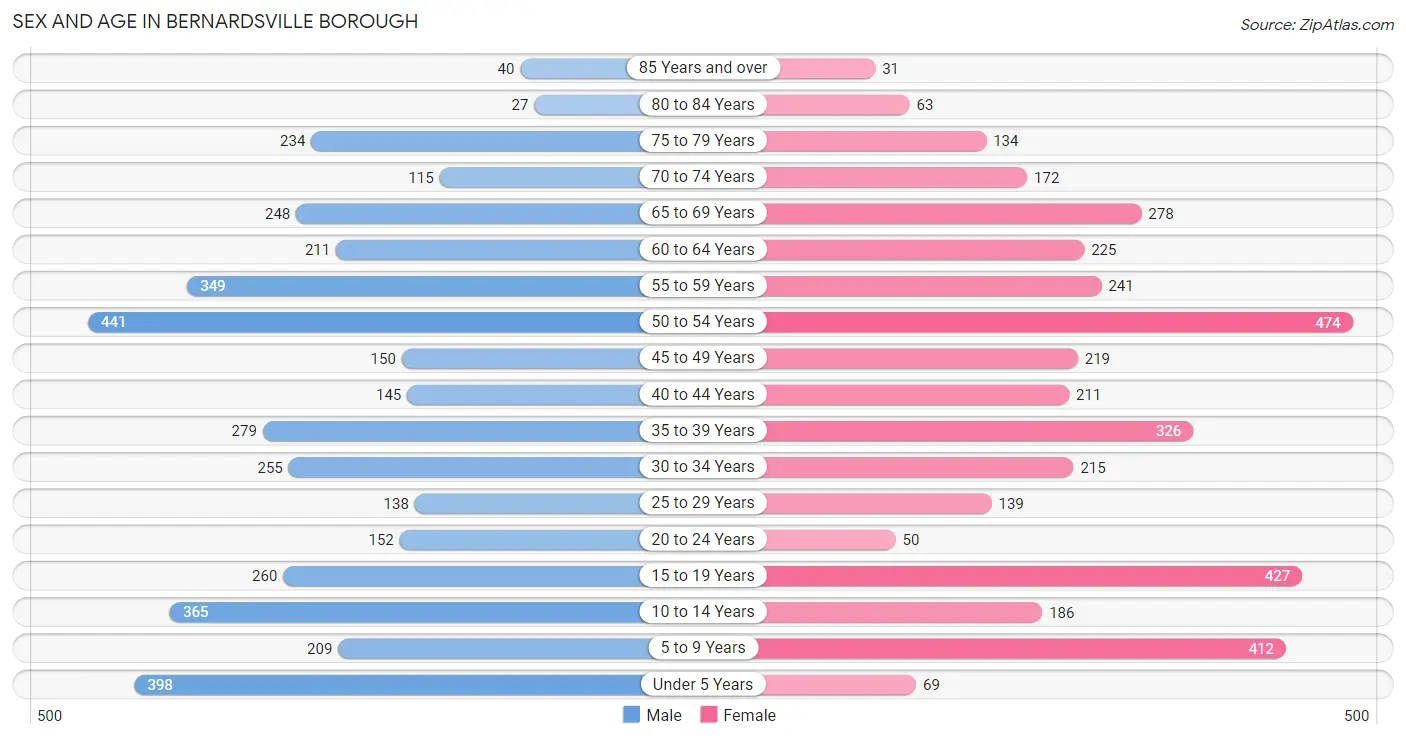
Sex and Age in Bernardsville borough
Sex and Age in Bernardsville borough
The most populous age groups in Bernardsville borough are 50 to 54 Years (441 | 11.0%) for men and 50 to 54 Years (474 | 12.2%) for women.
| Age Bracket | Male | Female |
| Under 5 Years | 398 (9.9%) | 69 (1.8%) |
| 5 to 9 Years | 209 (5.2%) | 412 (10.6%) |
| 10 to 14 Years | 365 (9.1%) | 186 (4.8%) |
| 15 to 19 Years | 260 (6.5%) | 427 (11.0%) |
| 20 to 24 Years | 152 (3.8%) | 50 (1.3%) |
| 25 to 29 Years | 138 (3.4%) | 139 (3.6%) |
| 30 to 34 Years | 255 (6.4%) | 215 (5.6%) |
| 35 to 39 Years | 279 (7.0%) | 326 (8.4%) |
| 40 to 44 Years | 145 (3.6%) | 211 (5.4%) |
| 45 to 49 Years | 150 (3.7%) | 219 (5.7%) |
| 50 to 54 Years | 441 (11.0%) | 474 (12.2%) |
| 55 to 59 Years | 349 (8.7%) | 241 (6.2%) |
| 60 to 64 Years | 211 (5.2%) | 225 (5.8%) |
| 65 to 69 Years | 248 (6.2%) | 278 (7.2%) |
| 70 to 74 Years | 115 (2.9%) | 172 (4.4%) |
| 75 to 79 Years | 234 (5.8%) | 134 (3.5%) |
| 80 to 84 Years | 27 (0.7%) | 63 (1.6%) |
| 85 Years and over | 40 (1.0%) | 31 (0.8%) |
| Total | 4,016 (100.0%) | 3,872 (100.0%) |
Families and Households in Bernardsville borough
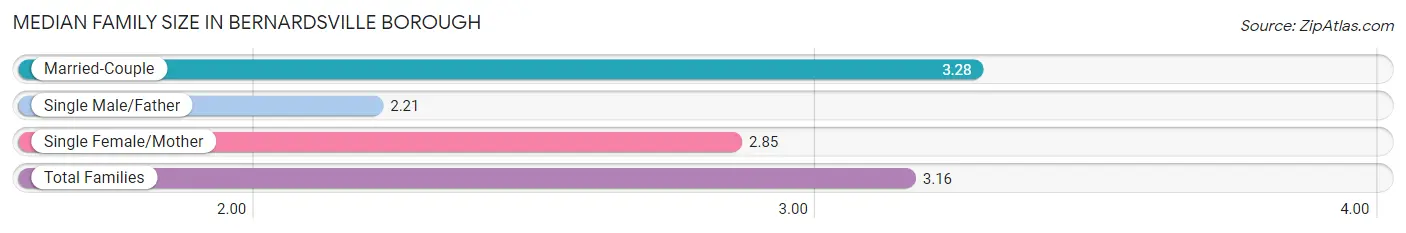
Median Family Size in Bernardsville borough
The median family size in Bernardsville borough is 3.16 persons per family, with married-couple families (1,811 | 81.0%) accounting for the largest median family size of 3.28 persons per family. On the other hand, single male/father families (153 | 6.9%) represent the smallest median family size with 2.21 persons per family.
| Family Type | # Families | Family Size |
| Married-Couple | 1,811 (81.0%) | 3.28 |
| Single Male/Father | 153 (6.9%) | 2.21 |
| Single Female/Mother | 271 (12.1%) | 2.85 |
| Total Families | 2,235 (100.0%) | 3.16 |
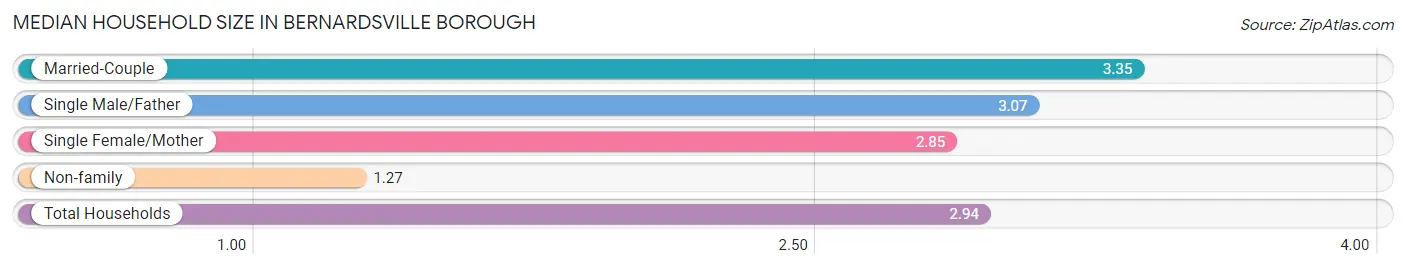
Median Household Size in Bernardsville borough
The median household size in Bernardsville borough is 2.94 persons per household, with married-couple households (1,811 | 67.6%) accounting for the largest median household size of 3.35 persons per household. non-family households (445 | 16.6%) represent the smallest median household size with 1.27 persons per household.
| Household Type | # Households | Household Size |
| Married-Couple | 1,811 (67.6%) | 3.35 |
| Single Male/Father | 153 (5.7%) | 3.07 |
| Single Female/Mother | 271 (10.1%) | 2.85 |
| Non-family | 445 (16.6%) | 1.27 |
| Total Households | 2,680 (100.0%) | 2.94 |
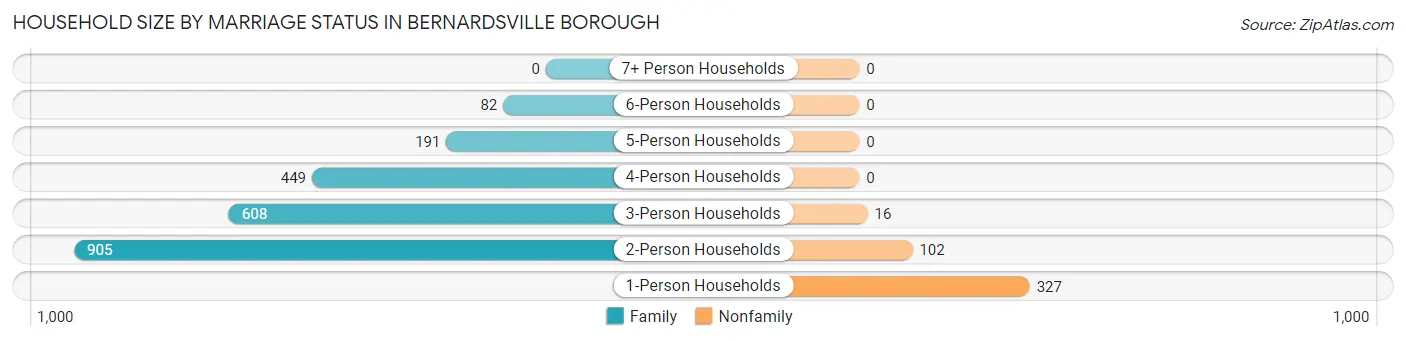
Household Size by Marriage Status in Bernardsville borough
Out of a total of 2,680 households in Bernardsville borough, 2,235 (83.4%) are family households, while 445 (16.6%) are nonfamily households. The most numerous type of family households are 2-person households, comprising 905, and the most common type of nonfamily households are 1-person households, comprising 327.
| Household Size | Family Households | Nonfamily Households |
| 1-Person Households | - | 327 (12.2%) |
| 2-Person Households | 905 (33.8%) | 102 (3.8%) |
| 3-Person Households | 608 (22.7%) | 16 (0.6%) |
| 4-Person Households | 449 (16.8%) | 0 (0.0%) |
| 5-Person Households | 191 (7.1%) | 0 (0.0%) |
| 6-Person Households | 82 (3.1%) | 0 (0.0%) |
| 7+ Person Households | 0 (0.0%) | 0 (0.0%) |
| Total | 2,235 (83.4%) | 445 (16.6%) |
Female Fertility in Bernardsville borough
Fertility by Age in Bernardsville borough
Average fertility rate in Bernardsville borough is 9.0 births per 1,000 women. Women in the age bracket of 20 to 34 years have the highest fertility rate with 40.0 births per 1,000 women. Women in the age bracket of 20 to 34 years acount for 100.0% of all women with births.
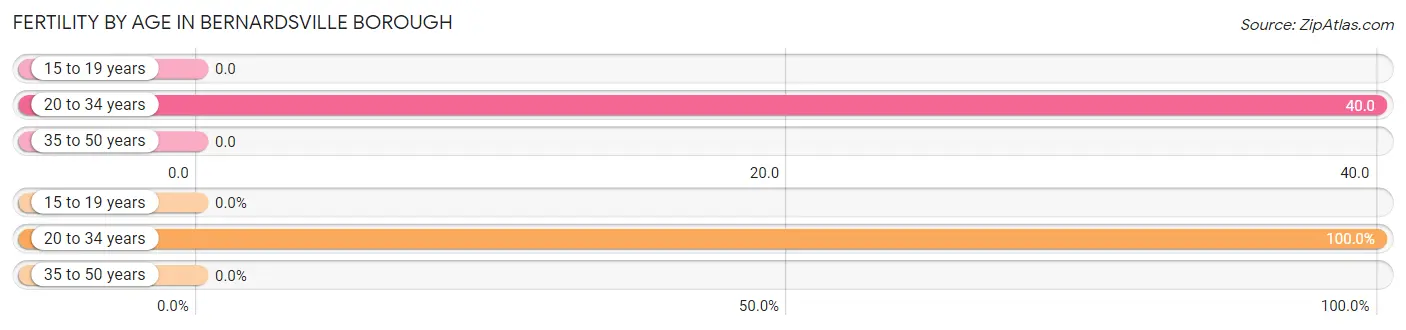
| Age Bracket | Women with Births | Births / 1,000 Women |
| 15 to 19 years | 0 (0.0%) | 0.0 |
| 20 to 34 years | 16 (100.0%) | 40.0 |
| 35 to 50 years | 0 (0.0%) | 0.0 |
| Total | 16 (100.0%) | 9.0 |
Fertility by Age by Marriage Status in Bernardsville borough
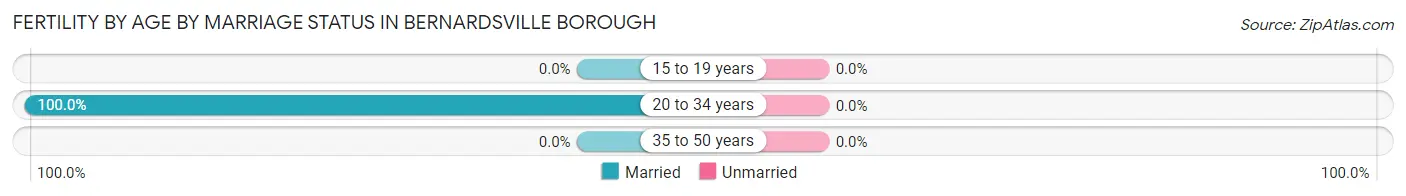
| Age Bracket | Married | Unmarried |
| 15 to 19 years | 0 (0.0%) | 0 (0.0%) |
| 20 to 34 years | 16 (100.0%) | 0 (0.0%) |
| 35 to 50 years | 0 (0.0%) | 0 (0.0%) |
| Total | 16 (100.0%) | 0 (0.0%) |
Fertility by Education in Bernardsville borough
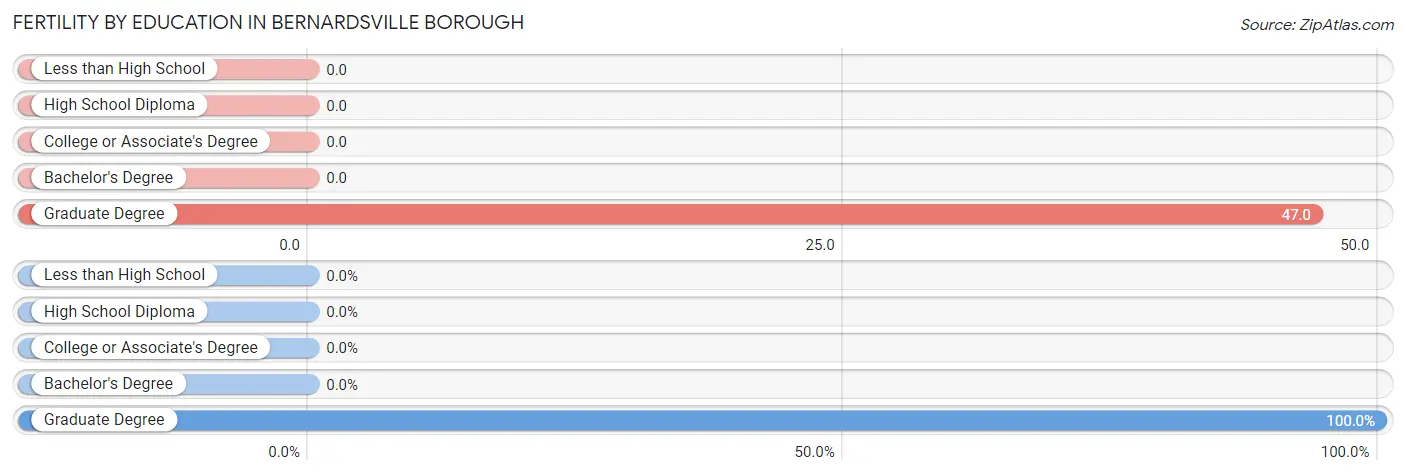
| Educational Attainment | Women with Births | Births / 1,000 Women |
| Less than High School | 0 (0.0%) | 0.0 |
| High School Diploma | 0 (0.0%) | 0.0 |
| College or Associate's Degree | 0 (0.0%) | 0.0 |
| Bachelor's Degree | 0 (0.0%) | 0.0 |
| Graduate Degree | 16 (100.0%) | 47.0 |
| Total | 16 (100.0%) | 9.0 |
Fertility by Education by Marriage Status in Bernardsville borough
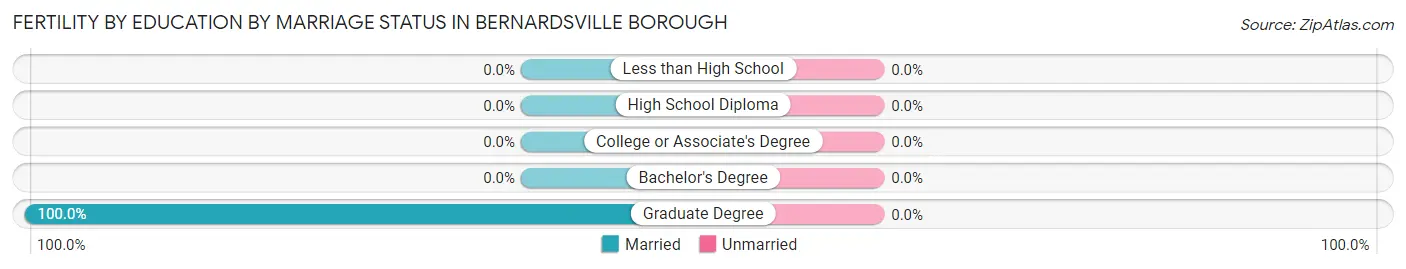
| Educational Attainment | Married | Unmarried |
| Less than High School | 0 (0.0%) | 0 (0.0%) |
| High School Diploma | 0 (0.0%) | 0 (0.0%) |
| College or Associate's Degree | 0 (0.0%) | 0 (0.0%) |
| Bachelor's Degree | 0 (0.0%) | 0 (0.0%) |
| Graduate Degree | 16 (100.0%) | 0 (0.0%) |
| Total | 16 (100.0%) | 0 (0.0%) |
Employment Characteristics in Bernardsville borough
Employment by Class of Employer in Bernardsville borough
Among the 3,861 employed individuals in Bernardsville borough, private company employees (2,672 | 69.2%), self-employed (incorporated) (434 | 11.2%), and self-employed (not incorporated) (284 | 7.4%) make up the most common classes of employment.
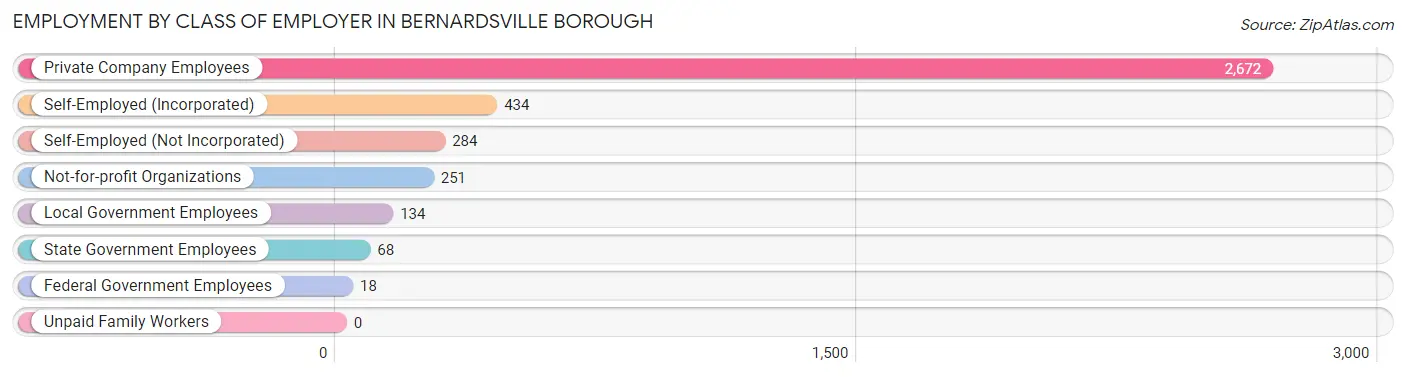
| Employer Class | # Employees | % Employees |
| Private Company Employees | 2,672 | 69.2% |
| Self-Employed (Incorporated) | 434 | 11.2% |
| Self-Employed (Not Incorporated) | 284 | 7.4% |
| Not-for-profit Organizations | 251 | 6.5% |
| Local Government Employees | 134 | 3.5% |
| State Government Employees | 68 | 1.8% |
| Federal Government Employees | 18 | 0.5% |
| Unpaid Family Workers | 0 | 0.0% |
| Total | 3,861 | 100.0% |
Employment Status by Age in Bernardsville borough
According to the labor force statistics for Bernardsville borough, out of the total population over 16 years of age (6,128), 67.1% or 4,112 individuals are in the labor force, with 5.5% or 226 of them unemployed. The age group with the highest labor force participation rate is 30 to 34 years, with 98.5% or 463 individuals in the labor force. Within the labor force, the 20 to 24 years age range has the highest percentage of unemployed individuals, with 15.8% or 29 of them being unemployed.
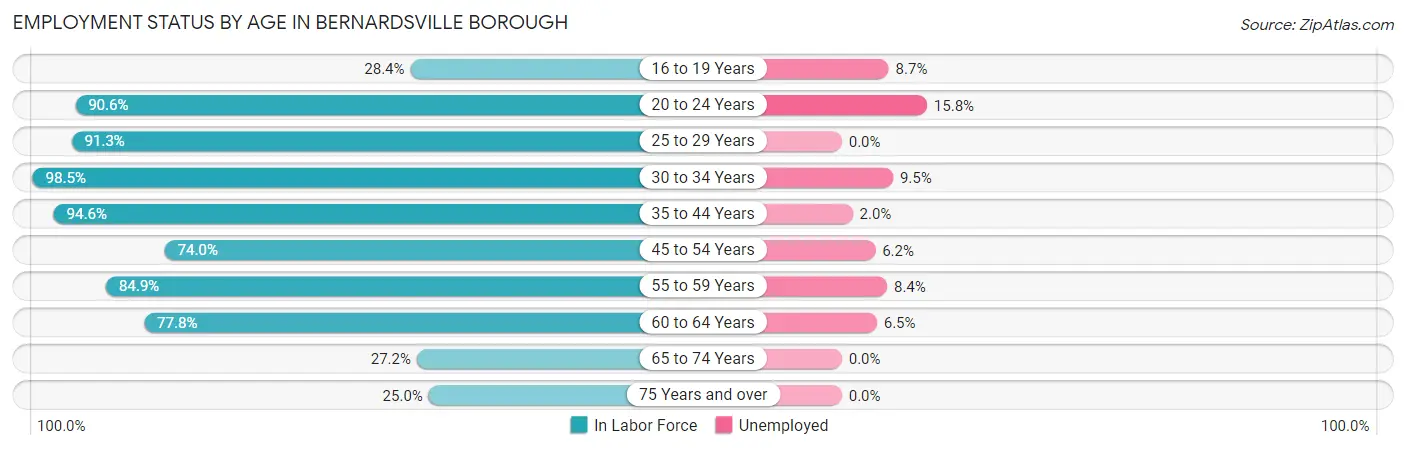
| Age Bracket | In Labor Force | Unemployed |
| 16 to 19 Years | 161 (28.4%) | 14 (8.7%) |
| 20 to 24 Years | 183 (90.6%) | 29 (15.8%) |
| 25 to 29 Years | 253 (91.3%) | 0 (0.0%) |
| 30 to 34 Years | 463 (98.5%) | 44 (9.5%) |
| 35 to 44 Years | 909 (94.6%) | 18 (2.0%) |
| 45 to 54 Years | 950 (74.0%) | 59 (6.2%) |
| 55 to 59 Years | 501 (84.9%) | 42 (8.4%) |
| 60 to 64 Years | 339 (77.8%) | 22 (6.5%) |
| 65 to 74 Years | 221 (27.2%) | 0 (0.0%) |
| 75 Years and over | 132 (25.0%) | 0 (0.0%) |
| Total | 4,112 (67.1%) | 226 (5.5%) |
Employment Status by Educational Attainment in Bernardsville borough
According to labor force statistics for Bernardsville borough, 85.0% of individuals (3,415) out of the total population between 25 and 64 years of age (4,018) are in the labor force, with 5.4% or 184 of them being unemployed. The group with the highest labor force participation rate are those with the educational attainment of high school diploma, with 88.4% or 574 individuals in the labor force. Within the labor force, individuals with college / associate degree education have the highest percentage of unemployment, with 22.2% or 28 of them being unemployed.
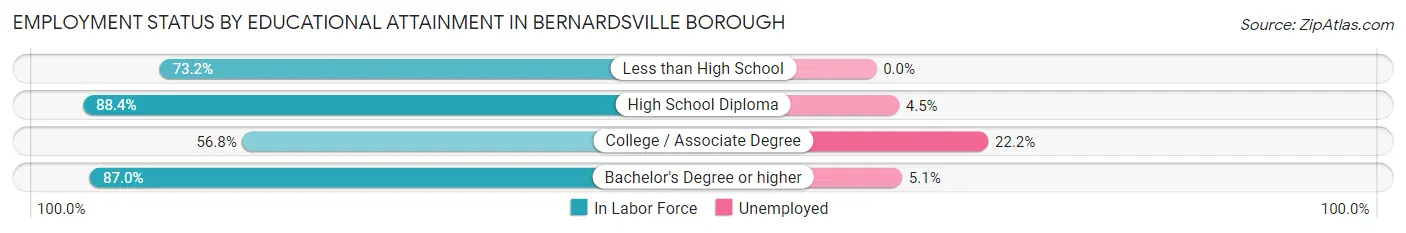
| Educational Attainment | In Labor Force | Unemployed |
| Less than High School | 123 (73.2%) | 0 (0.0%) |
| High School Diploma | 574 (88.4%) | 29 (4.5%) |
| College / Associate Degree | 126 (56.8%) | 49 (22.2%) |
| Bachelor's Degree or higher | 2,592 (87.0%) | 152 (5.1%) |
| Total | 3,415 (85.0%) | 217 (5.4%) |
Employment Occupations by Sex in Bernardsville borough
Management, Business, Science and Arts Occupations
The most common Management, Business, Science and Arts occupations in Bernardsville borough are Management (899 | 23.2%), Community & Social Service (552 | 14.2%), Business & Financial (413 | 10.6%), Education Instruction & Library (305 | 7.9%), and Health Diagnosing & Treating (257 | 6.6%).
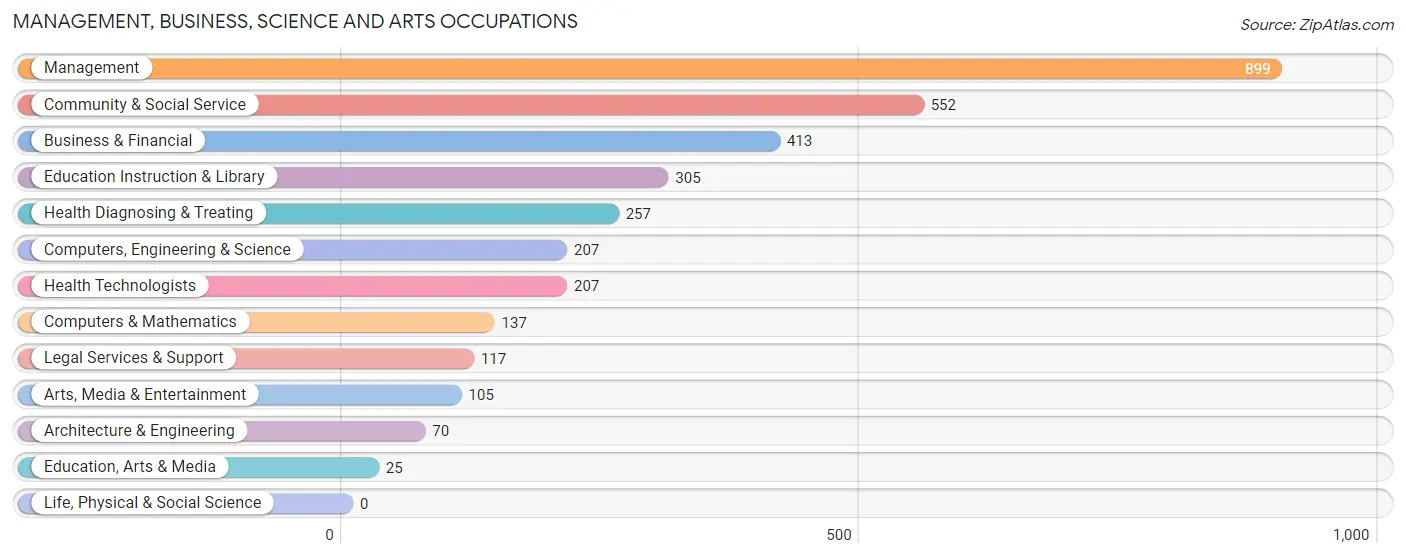
Management, Business, Science and Arts Occupations by Sex
Within the Management, Business, Science and Arts occupations in Bernardsville borough, the most male-oriented occupations are Legal Services & Support (81.2%), Architecture & Engineering (68.6%), and Management (62.6%), while the most female-oriented occupations are Education, Arts & Media (100.0%), Health Technologists (79.2%), and Health Diagnosing & Treating (77.8%).
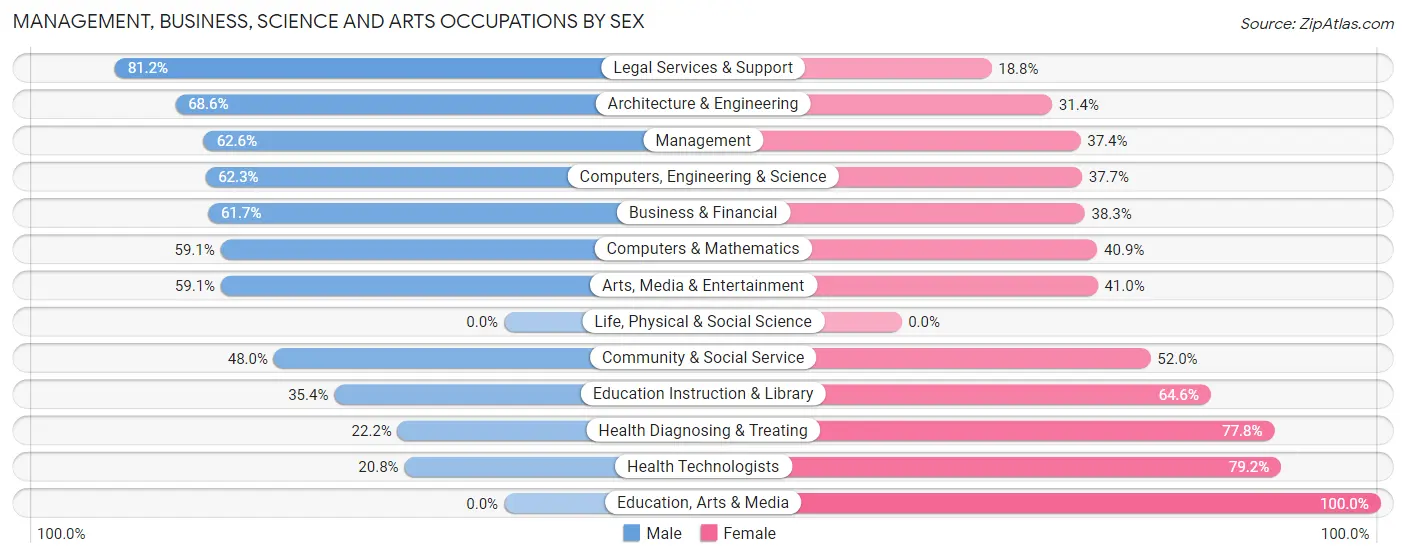
| Occupation | Male | Female |
| Management | 563 (62.6%) | 336 (37.4%) |
| Business & Financial | 255 (61.7%) | 158 (38.3%) |
| Computers, Engineering & Science | 129 (62.3%) | 78 (37.7%) |
| Computers & Mathematics | 81 (59.1%) | 56 (40.9%) |
| Architecture & Engineering | 48 (68.6%) | 22 (31.4%) |
| Life, Physical & Social Science | 0 (0.0%) | 0 (0.0%) |
| Community & Social Service | 265 (48.0%) | 287 (52.0%) |
| Education, Arts & Media | 0 (0.0%) | 25 (100.0%) |
| Legal Services & Support | 95 (81.2%) | 22 (18.8%) |
| Education Instruction & Library | 108 (35.4%) | 197 (64.6%) |
| Arts, Media & Entertainment | 62 (59.1%) | 43 (40.9%) |
| Health Diagnosing & Treating | 57 (22.2%) | 200 (77.8%) |
| Health Technologists | 43 (20.8%) | 164 (79.2%) |
| Total (Category) | 1,269 (54.5%) | 1,059 (45.5%) |
| Total (Overall) | 2,262 (58.2%) | 1,622 (41.8%) |
Services Occupations
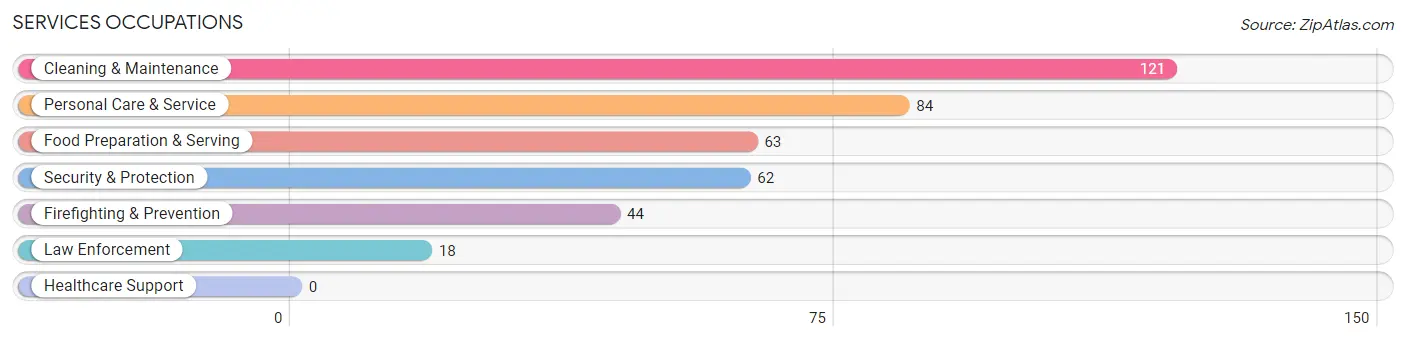
The most common Services occupations in Bernardsville borough are Cleaning & Maintenance (121 | 3.1%), Personal Care & Service (84 | 2.2%), Food Preparation & Serving (63 | 1.6%), Security & Protection (62 | 1.6%), and Firefighting & Prevention (44 | 1.1%).
Services Occupations by Sex
Within the Services occupations in Bernardsville borough, the most male-oriented occupations are Law Enforcement (100.0%), Food Preparation & Serving (100.0%), and Cleaning & Maintenance (83.5%), while the most female-oriented occupations are Personal Care & Service (84.5%), Firefighting & Prevention (61.4%), and Security & Protection (43.5%).
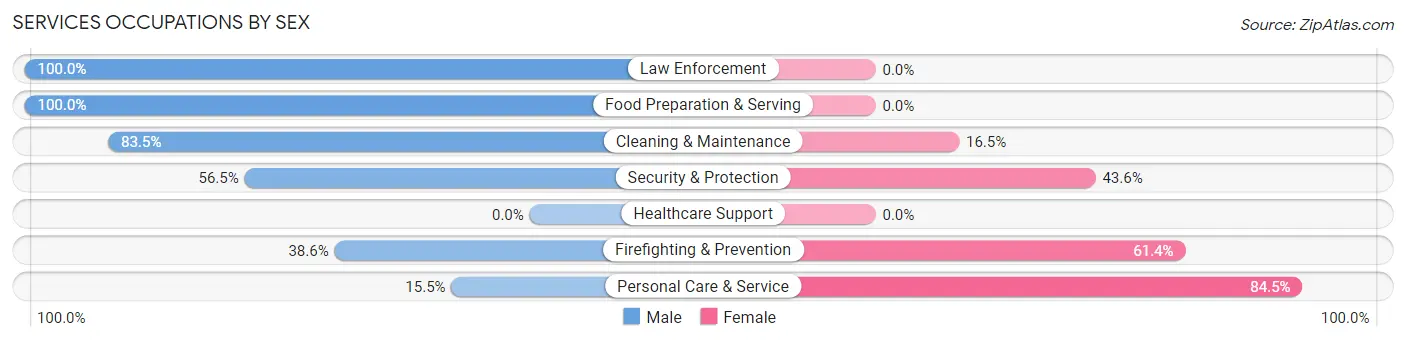
| Occupation | Male | Female |
| Healthcare Support | 0 (0.0%) | 0 (0.0%) |
| Security & Protection | 35 (56.5%) | 27 (43.5%) |
| Firefighting & Prevention | 17 (38.6%) | 27 (61.4%) |
| Law Enforcement | 18 (100.0%) | 0 (0.0%) |
| Food Preparation & Serving | 63 (100.0%) | 0 (0.0%) |
| Cleaning & Maintenance | 101 (83.5%) | 20 (16.5%) |
| Personal Care & Service | 13 (15.5%) | 71 (84.5%) |
| Total (Category) | 212 (64.2%) | 118 (35.8%) |
| Total (Overall) | 2,262 (58.2%) | 1,622 (41.8%) |
Sales and Office Occupations
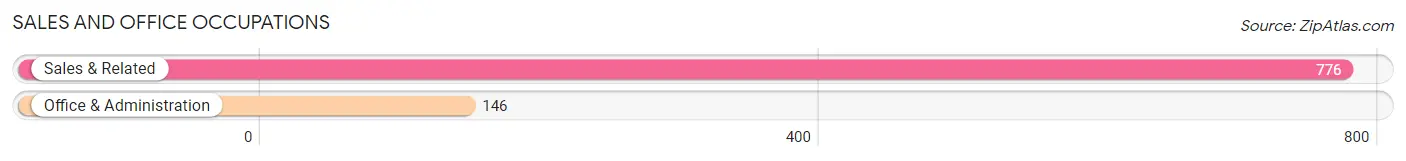
The most common Sales and Office occupations in Bernardsville borough are Sales & Related (776 | 20.0%), and Office & Administration (146 | 3.8%).
Sales and Office Occupations by Sex

| Occupation | Male | Female |
| Sales & Related | 508 (65.5%) | 268 (34.5%) |
| Office & Administration | 0 (0.0%) | 146 (100.0%) |
| Total (Category) | 508 (55.1%) | 414 (44.9%) |
| Total (Overall) | 2,262 (58.2%) | 1,622 (41.8%) |
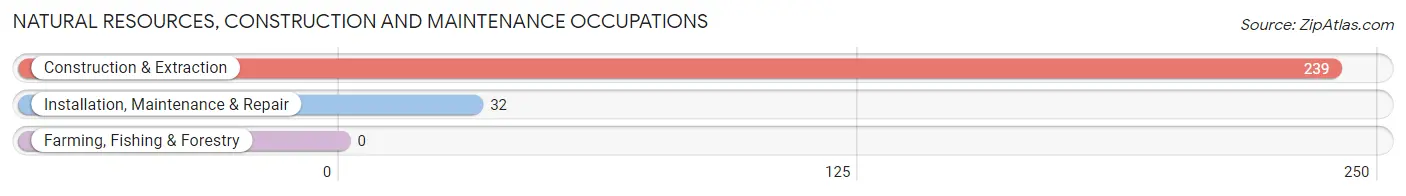
Natural Resources, Construction and Maintenance Occupations
The most common Natural Resources, Construction and Maintenance occupations in Bernardsville borough are Construction & Extraction (239 | 6.1%), and Installation, Maintenance & Repair (32 | 0.8%).
Natural Resources, Construction and Maintenance Occupations by Sex
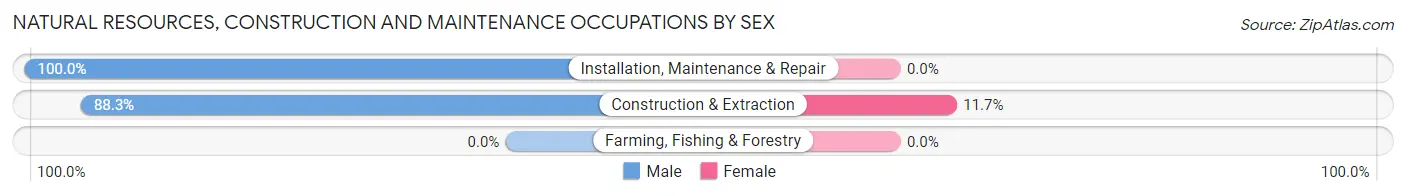
| Occupation | Male | Female |
| Farming, Fishing & Forestry | 0 (0.0%) | 0 (0.0%) |
| Construction & Extraction | 211 (88.3%) | 28 (11.7%) |
| Installation, Maintenance & Repair | 32 (100.0%) | 0 (0.0%) |
| Total (Category) | 243 (89.7%) | 28 (10.3%) |
| Total (Overall) | 2,262 (58.2%) | 1,622 (41.8%) |
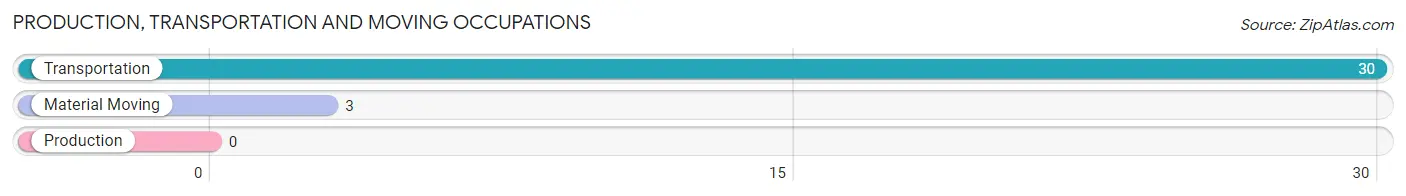
Production, Transportation and Moving Occupations
The most common Production, Transportation and Moving occupations in Bernardsville borough are Transportation (30 | 0.8%), and Material Moving (3 | 0.1%).
Production, Transportation and Moving Occupations by Sex
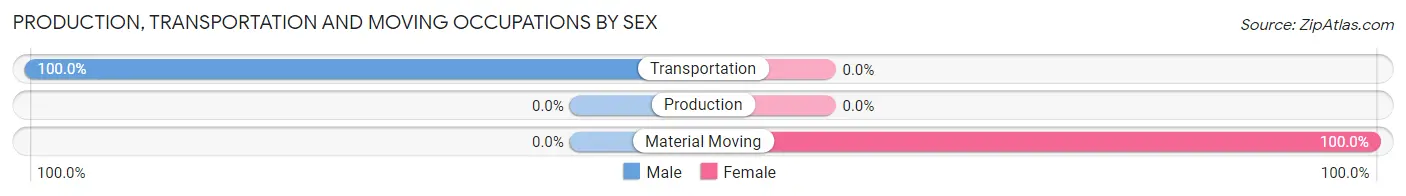
| Occupation | Male | Female |
| Production | 0 (0.0%) | 0 (0.0%) |
| Transportation | 30 (100.0%) | 0 (0.0%) |
| Material Moving | 0 (0.0%) | 3 (100.0%) |
| Total (Category) | 30 (90.9%) | 3 (9.1%) |
| Total (Overall) | 2,262 (58.2%) | 1,622 (41.8%) |
Employment Industries by Sex in Bernardsville borough
Employment Industries in Bernardsville borough
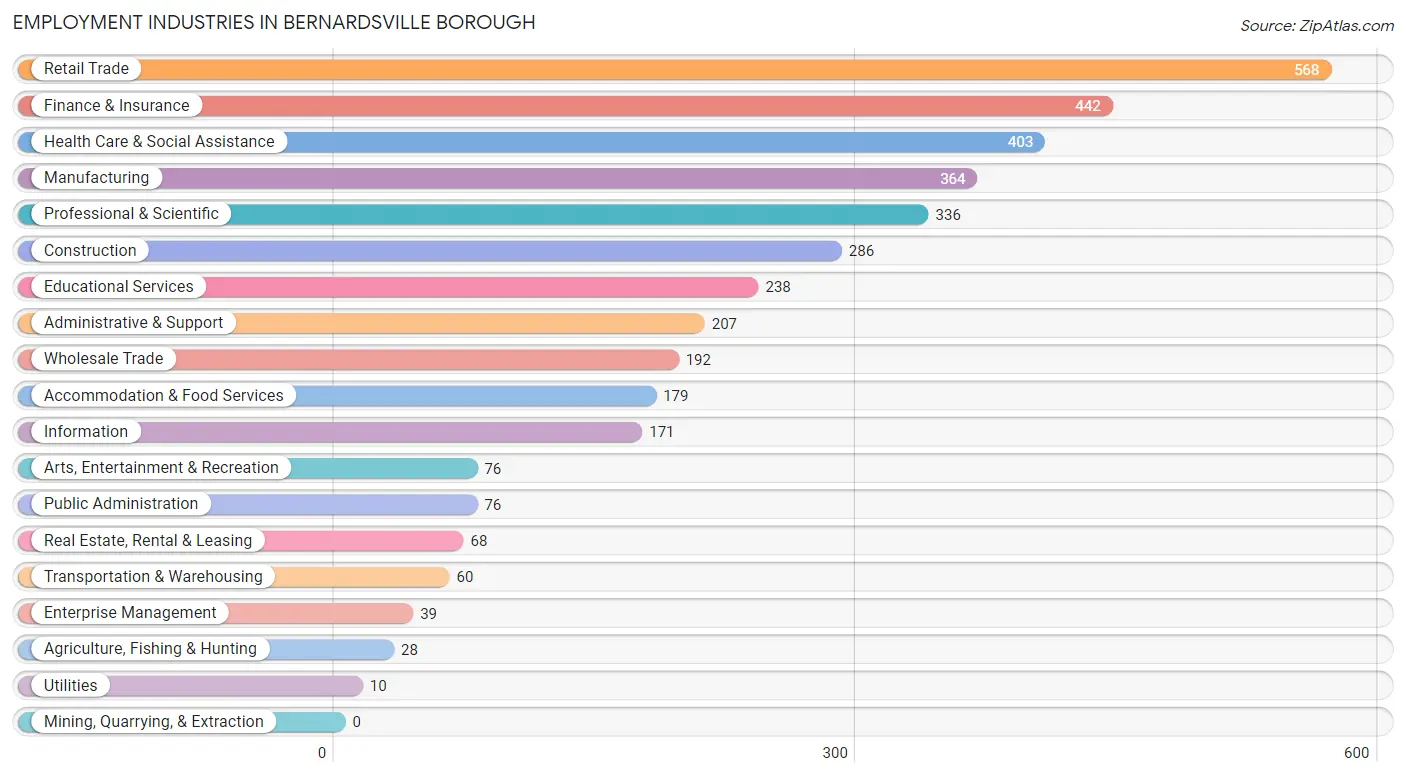
The major employment industries in Bernardsville borough include Retail Trade (568 | 14.6%), Finance & Insurance (442 | 11.4%), Health Care & Social Assistance (403 | 10.4%), Manufacturing (364 | 9.4%), and Professional & Scientific (336 | 8.6%).
Employment Industries by Sex in Bernardsville borough
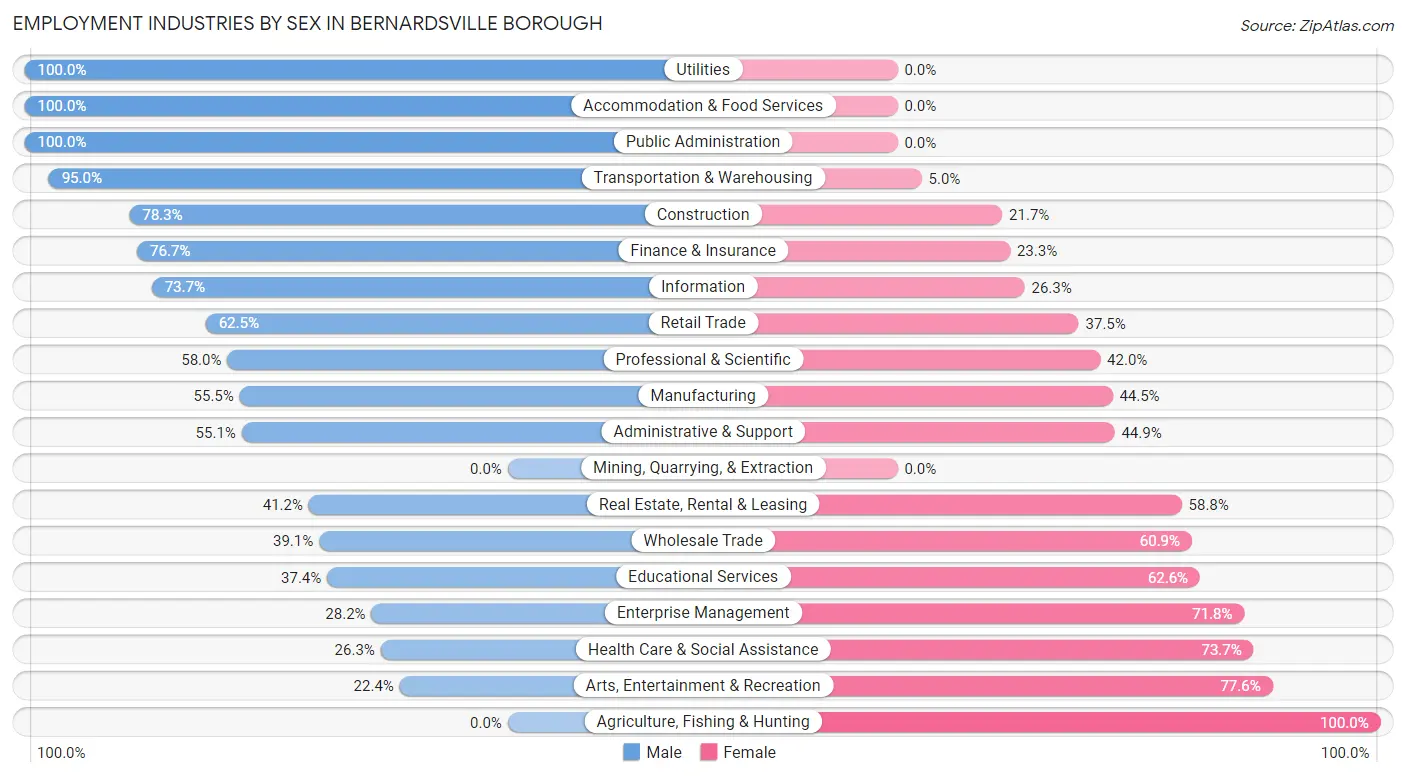
The Bernardsville borough industries that see more men than women are Utilities (100.0%), Accommodation & Food Services (100.0%), and Public Administration (100.0%), whereas the industries that tend to have a higher number of women are Agriculture, Fishing & Hunting (100.0%), Arts, Entertainment & Recreation (77.6%), and Health Care & Social Assistance (73.7%).
| Industry | Male | Female |
| Agriculture, Fishing & Hunting | 0 (0.0%) | 28 (100.0%) |
| Mining, Quarrying, & Extraction | 0 (0.0%) | 0 (0.0%) |
| Construction | 224 (78.3%) | 62 (21.7%) |
| Manufacturing | 202 (55.5%) | 162 (44.5%) |
| Wholesale Trade | 75 (39.1%) | 117 (60.9%) |
| Retail Trade | 355 (62.5%) | 213 (37.5%) |
| Transportation & Warehousing | 57 (95.0%) | 3 (5.0%) |
| Utilities | 10 (100.0%) | 0 (0.0%) |
| Information | 126 (73.7%) | 45 (26.3%) |
| Finance & Insurance | 339 (76.7%) | 103 (23.3%) |
| Real Estate, Rental & Leasing | 28 (41.2%) | 40 (58.8%) |
| Professional & Scientific | 195 (58.0%) | 141 (42.0%) |
| Enterprise Management | 11 (28.2%) | 28 (71.8%) |
| Administrative & Support | 114 (55.1%) | 93 (44.9%) |
| Educational Services | 89 (37.4%) | 149 (62.6%) |
| Health Care & Social Assistance | 106 (26.3%) | 297 (73.7%) |
| Arts, Entertainment & Recreation | 17 (22.4%) | 59 (77.6%) |
| Accommodation & Food Services | 179 (100.0%) | 0 (0.0%) |
| Public Administration | 76 (100.0%) | 0 (0.0%) |
| Total | 2,262 (58.2%) | 1,622 (41.8%) |
Education in Bernardsville borough
School Enrollment in Bernardsville borough
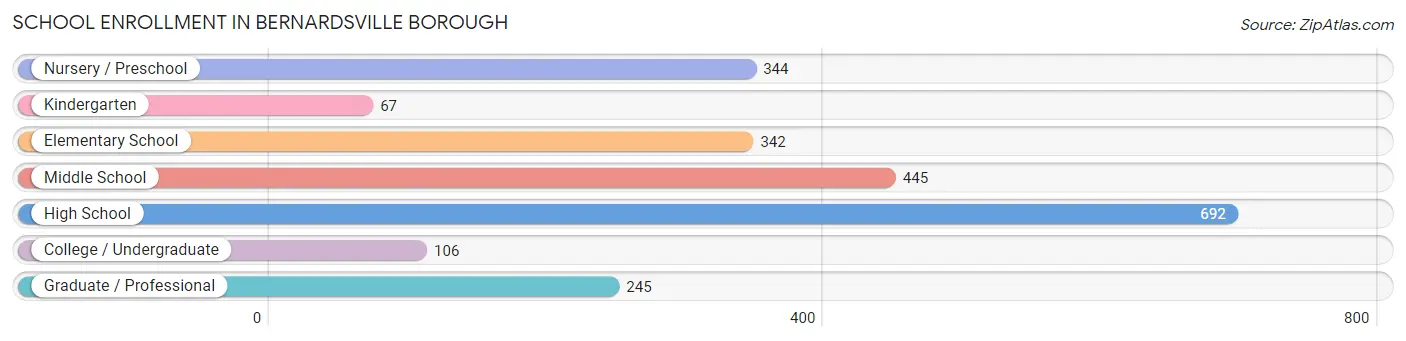
The most common levels of schooling among the 2,241 students in Bernardsville borough are high school (692 | 30.9%), middle school (445 | 19.9%), and nursery / preschool (344 | 15.3%).
| School Level | # Students | % Students |
| Nursery / Preschool | 344 | 15.3% |
| Kindergarten | 67 | 3.0% |
| Elementary School | 342 | 15.3% |
| Middle School | 445 | 19.9% |
| High School | 692 | 30.9% |
| College / Undergraduate | 106 | 4.7% |
| Graduate / Professional | 245 | 10.9% |
| Total | 2,241 | 100.0% |
School Enrollment by Age by Funding Source in Bernardsville borough
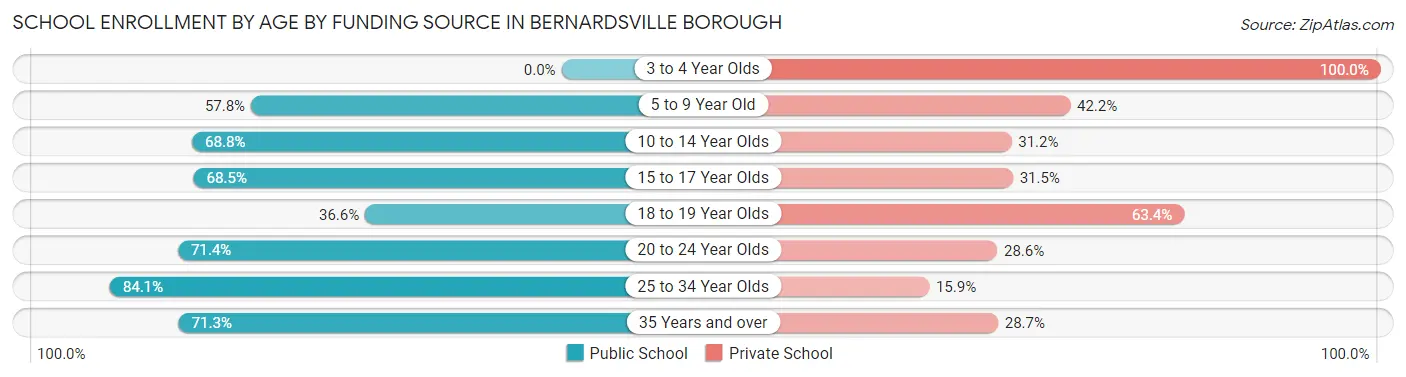
Out of a total of 2,241 students who are enrolled in schools in Bernardsville borough, 870 (38.8%) attend a private institution, while the remaining 1,371 (61.2%) are enrolled in public schools. The age group of 3 to 4 year olds has the highest likelihood of being enrolled in private schools, with 101 (100.0% in the age bracket) enrolled. Conversely, the age group of 25 to 34 year olds has the lowest likelihood of being enrolled in a private school, with 90 (84.1% in the age bracket) attending a public institution.
| Age Bracket | Public School | Private School |
| 3 to 4 Year Olds | 0 (0.0%) | 101 (100.0%) |
| 5 to 9 Year Old | 358 (57.8%) | 261 (42.2%) |
| 10 to 14 Year Olds | 379 (68.8%) | 172 (31.2%) |
| 15 to 17 Year Olds | 333 (68.5%) | 153 (31.5%) |
| 18 to 19 Year Olds | 60 (36.6%) | 104 (63.4%) |
| 20 to 24 Year Olds | 75 (71.4%) | 30 (28.6%) |
| 25 to 34 Year Olds | 90 (84.1%) | 17 (15.9%) |
| 35 Years and over | 77 (71.3%) | 31 (28.7%) |
| Total | 1,371 (61.2%) | 870 (38.8%) |
Educational Attainment by Field of Study in Bernardsville borough
Business (986 | 25.6%), social sciences (579 | 15.0%), education (419 | 10.9%), science & technology (344 | 8.9%), and engineering (267 | 6.9%) are the most common fields of study among 3,848 individuals in Bernardsville borough who have obtained a bachelor's degree or higher.
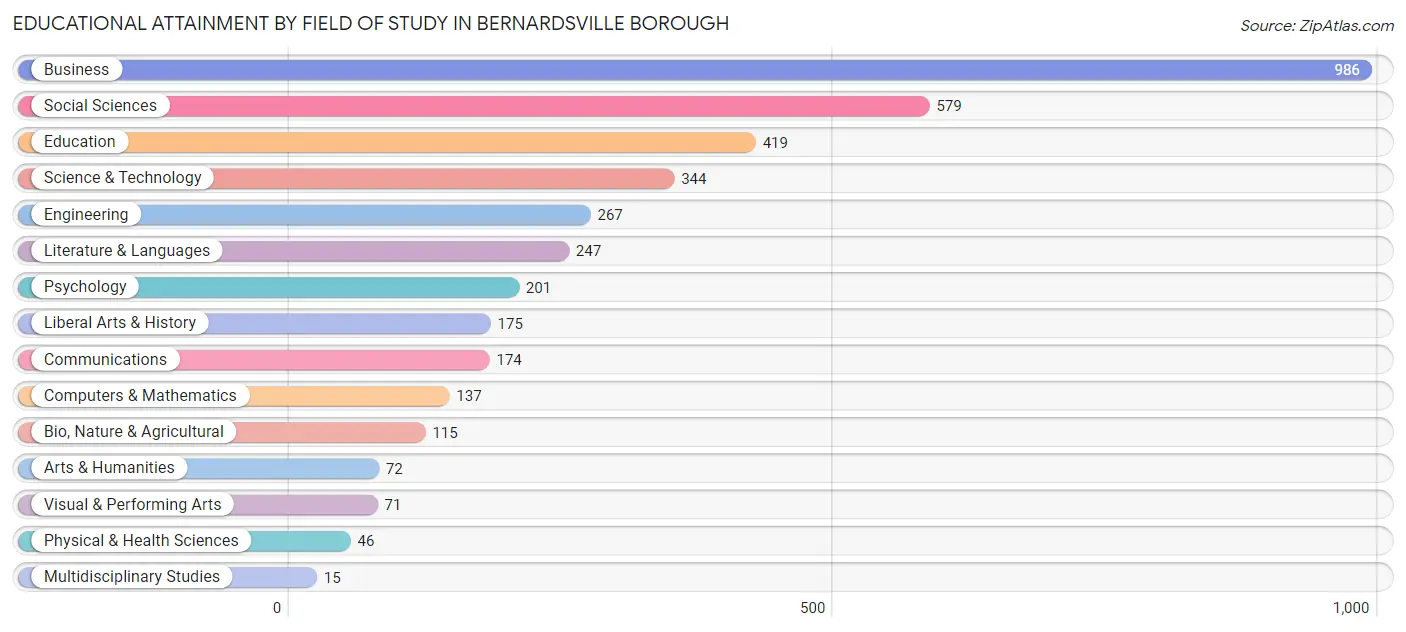
| Field of Study | # Graduates | % Graduates |
| Computers & Mathematics | 137 | 3.6% |
| Bio, Nature & Agricultural | 115 | 3.0% |
| Physical & Health Sciences | 46 | 1.2% |
| Psychology | 201 | 5.2% |
| Social Sciences | 579 | 15.0% |
| Engineering | 267 | 6.9% |
| Multidisciplinary Studies | 15 | 0.4% |
| Science & Technology | 344 | 8.9% |
| Business | 986 | 25.6% |
| Education | 419 | 10.9% |
| Literature & Languages | 247 | 6.4% |
| Liberal Arts & History | 175 | 4.5% |
| Visual & Performing Arts | 71 | 1.8% |
| Communications | 174 | 4.5% |
| Arts & Humanities | 72 | 1.9% |
| Total | 3,848 | 100.0% |
Transportation & Commute in Bernardsville borough
Vehicle Availability by Sex in Bernardsville borough
The most prevalent vehicle ownership categories in Bernardsville borough are males with 2 vehicles (1,055, accounting for 47.1%) and females with 2 vehicles (904, making up 65.2%).
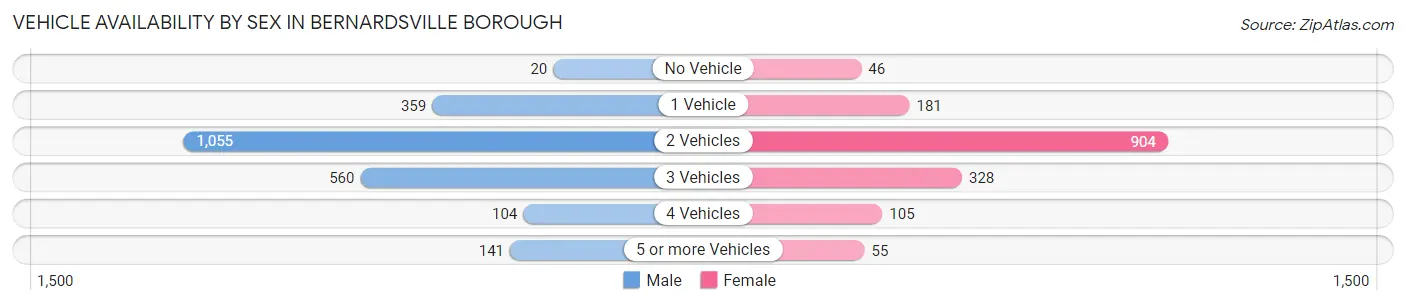
| Vehicles Available | Male | Female |
| No Vehicle | 20 (0.9%) | 46 (2.8%) |
| 1 Vehicle | 359 (16.0%) | 181 (11.2%) |
| 2 Vehicles | 1,055 (47.1%) | 904 (55.8%) |
| 3 Vehicles | 560 (25.0%) | 328 (20.3%) |
| 4 Vehicles | 104 (4.6%) | 105 (6.5%) |
| 5 or more Vehicles | 141 (6.3%) | 55 (3.4%) |
| Total | 2,239 (100.0%) | 1,619 (100.0%) |
Commute Time in Bernardsville borough
The most frequently occuring commute durations in Bernardsville borough are 30 to 34 minutes (598 commuters, 20.0%), 5 to 9 minutes (497 commuters, 16.6%), and 20 to 24 minutes (346 commuters, 11.5%).
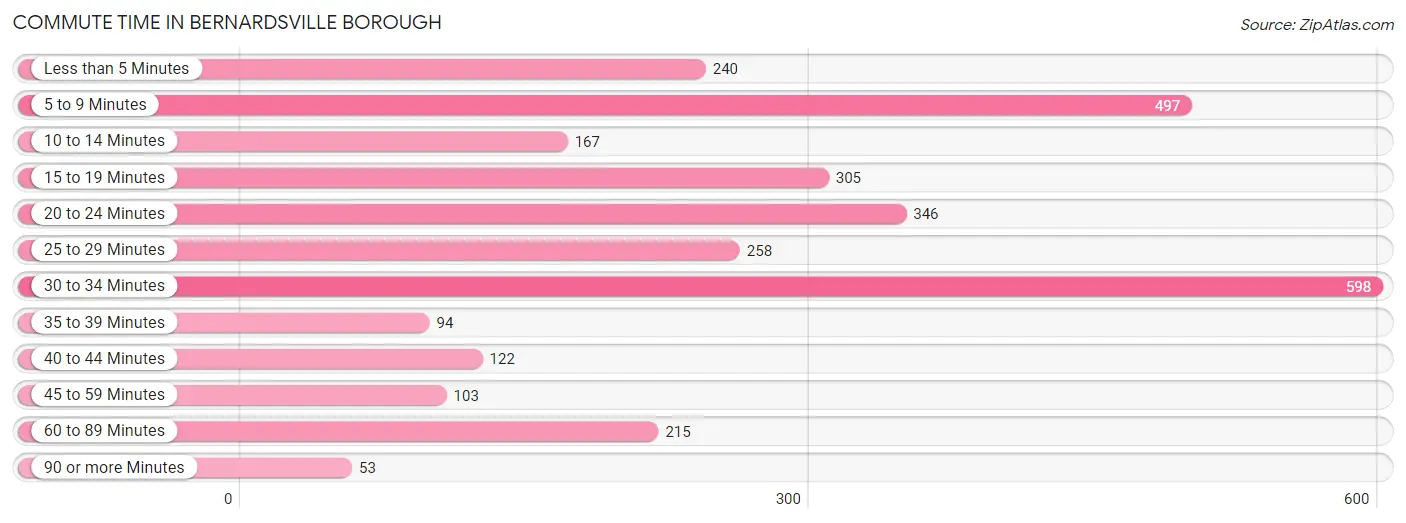
| Commute Time | # Commuters | % Commuters |
| Less than 5 Minutes | 240 | 8.0% |
| 5 to 9 Minutes | 497 | 16.6% |
| 10 to 14 Minutes | 167 | 5.6% |
| 15 to 19 Minutes | 305 | 10.2% |
| 20 to 24 Minutes | 346 | 11.5% |
| 25 to 29 Minutes | 258 | 8.6% |
| 30 to 34 Minutes | 598 | 20.0% |
| 35 to 39 Minutes | 94 | 3.1% |
| 40 to 44 Minutes | 122 | 4.1% |
| 45 to 59 Minutes | 103 | 3.4% |
| 60 to 89 Minutes | 215 | 7.2% |
| 90 or more Minutes | 53 | 1.8% |
Commute Time by Sex in Bernardsville borough
The most common commute times in Bernardsville borough are 30 to 34 minutes (427 commuters, 22.5%) for males and 25 to 29 minutes (206 commuters, 18.7%) for females.
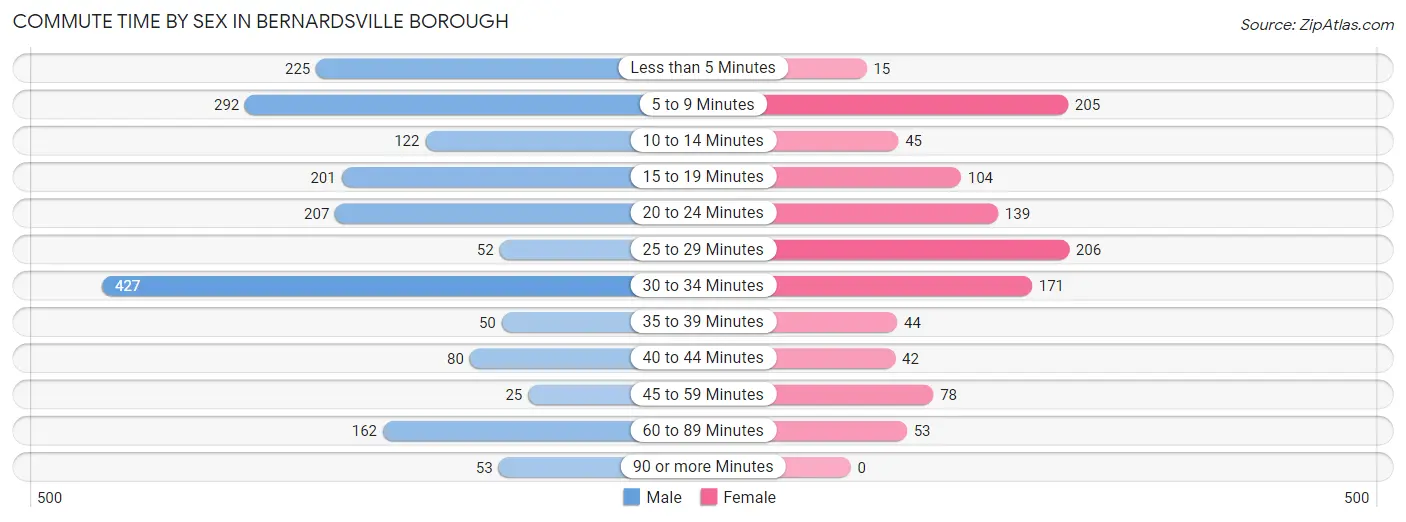
| Commute Time | Male | Female |
| Less than 5 Minutes | 225 (11.9%) | 15 (1.4%) |
| 5 to 9 Minutes | 292 (15.4%) | 205 (18.6%) |
| 10 to 14 Minutes | 122 (6.4%) | 45 (4.1%) |
| 15 to 19 Minutes | 201 (10.6%) | 104 (9.4%) |
| 20 to 24 Minutes | 207 (10.9%) | 139 (12.6%) |
| 25 to 29 Minutes | 52 (2.7%) | 206 (18.7%) |
| 30 to 34 Minutes | 427 (22.5%) | 171 (15.5%) |
| 35 to 39 Minutes | 50 (2.6%) | 44 (4.0%) |
| 40 to 44 Minutes | 80 (4.2%) | 42 (3.8%) |
| 45 to 59 Minutes | 25 (1.3%) | 78 (7.1%) |
| 60 to 89 Minutes | 162 (8.5%) | 53 (4.8%) |
| 90 or more Minutes | 53 (2.8%) | 0 (0.0%) |
Time of Departure to Work by Sex in Bernardsville borough
The most frequent times of departure to work in Bernardsville borough are 7:30 AM to 7:59 AM (445, 23.5%) for males and 8:30 AM to 8:59 AM (269, 24.4%) for females.
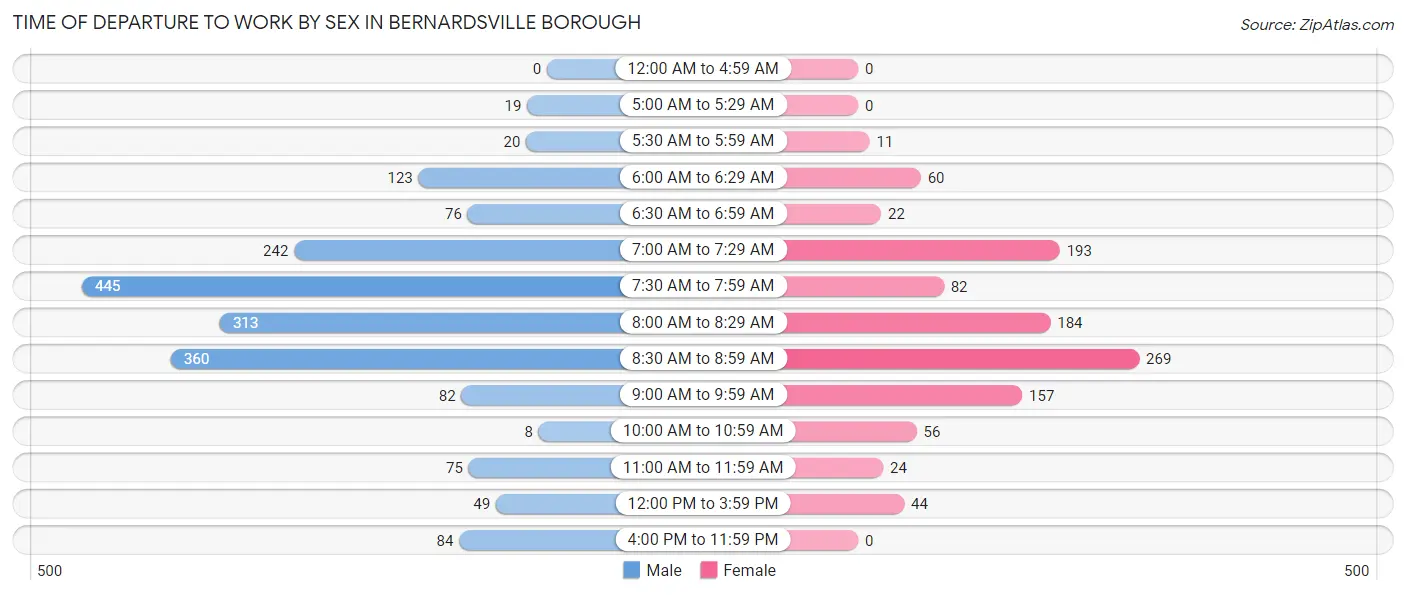
| Time of Departure | Male | Female |
| 12:00 AM to 4:59 AM | 0 (0.0%) | 0 (0.0%) |
| 5:00 AM to 5:29 AM | 19 (1.0%) | 0 (0.0%) |
| 5:30 AM to 5:59 AM | 20 (1.1%) | 11 (1.0%) |
| 6:00 AM to 6:29 AM | 123 (6.5%) | 60 (5.4%) |
| 6:30 AM to 6:59 AM | 76 (4.0%) | 22 (2.0%) |
| 7:00 AM to 7:29 AM | 242 (12.8%) | 193 (17.5%) |
| 7:30 AM to 7:59 AM | 445 (23.5%) | 82 (7.4%) |
| 8:00 AM to 8:29 AM | 313 (16.5%) | 184 (16.7%) |
| 8:30 AM to 8:59 AM | 360 (19.0%) | 269 (24.4%) |
| 9:00 AM to 9:59 AM | 82 (4.3%) | 157 (14.2%) |
| 10:00 AM to 10:59 AM | 8 (0.4%) | 56 (5.1%) |
| 11:00 AM to 11:59 AM | 75 (4.0%) | 24 (2.2%) |
| 12:00 PM to 3:59 PM | 49 (2.6%) | 44 (4.0%) |
| 4:00 PM to 11:59 PM | 84 (4.4%) | 0 (0.0%) |
| Total | 1,896 (100.0%) | 1,102 (100.0%) |
Housing Occupancy in Bernardsville borough
Occupancy by Ownership in Bernardsville borough
Of the total 2,680 dwellings in Bernardsville borough, owner-occupied units account for 2,383 (88.9%), while renter-occupied units make up 297 (11.1%).
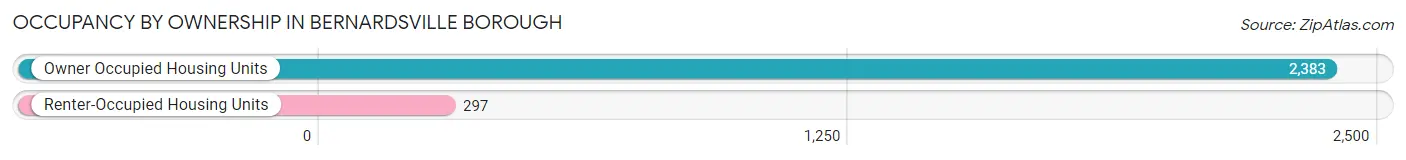
| Occupancy | # Housing Units | % Housing Units |
| Owner Occupied Housing Units | 2,383 | 88.9% |
| Renter-Occupied Housing Units | 297 | 11.1% |
| Total Occupied Housing Units | 2,680 | 100.0% |
Occupancy by Household Size in Bernardsville borough
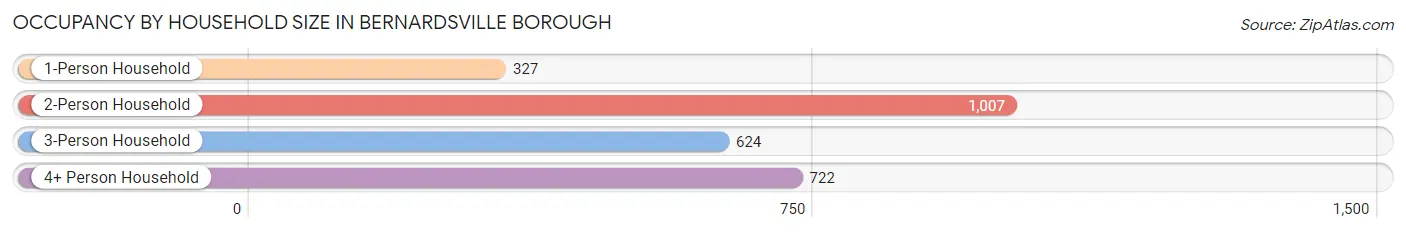
| Household Size | # Housing Units | % Housing Units |
| 1-Person Household | 327 | 12.2% |
| 2-Person Household | 1,007 | 37.6% |
| 3-Person Household | 624 | 23.3% |
| 4+ Person Household | 722 | 26.9% |
| Total Housing Units | 2,680 | 100.0% |
Occupancy by Ownership by Household Size in Bernardsville borough
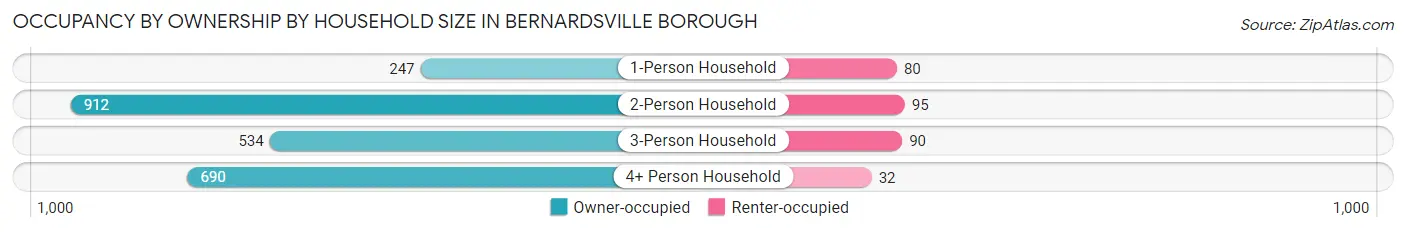
| Household Size | Owner-occupied | Renter-occupied |
| 1-Person Household | 247 (75.5%) | 80 (24.5%) |
| 2-Person Household | 912 (90.6%) | 95 (9.4%) |
| 3-Person Household | 534 (85.6%) | 90 (14.4%) |
| 4+ Person Household | 690 (95.6%) | 32 (4.4%) |
| Total Housing Units | 2,383 (88.9%) | 297 (11.1%) |
Occupancy by Educational Attainment in Bernardsville borough
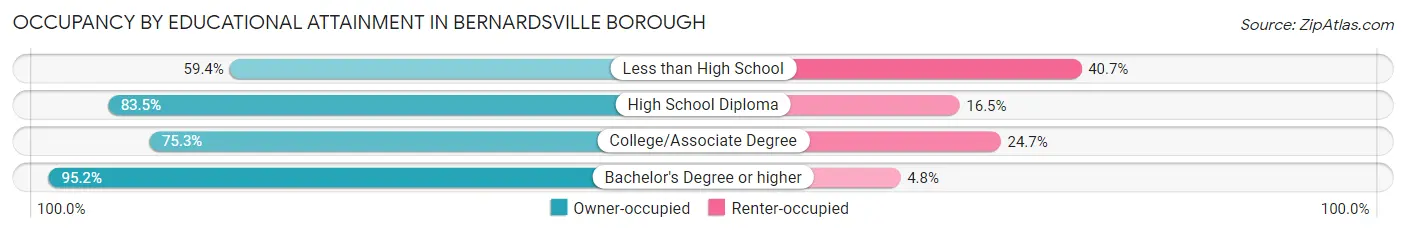
| Household Size | Owner-occupied | Renter-occupied |
| Less than High School | 127 (59.4%) | 87 (40.6%) |
| High School Diploma | 238 (83.5%) | 47 (16.5%) |
| College/Associate Degree | 223 (75.3%) | 73 (24.7%) |
| Bachelor's Degree or higher | 1,795 (95.2%) | 90 (4.8%) |
Occupancy by Age of Householder in Bernardsville borough
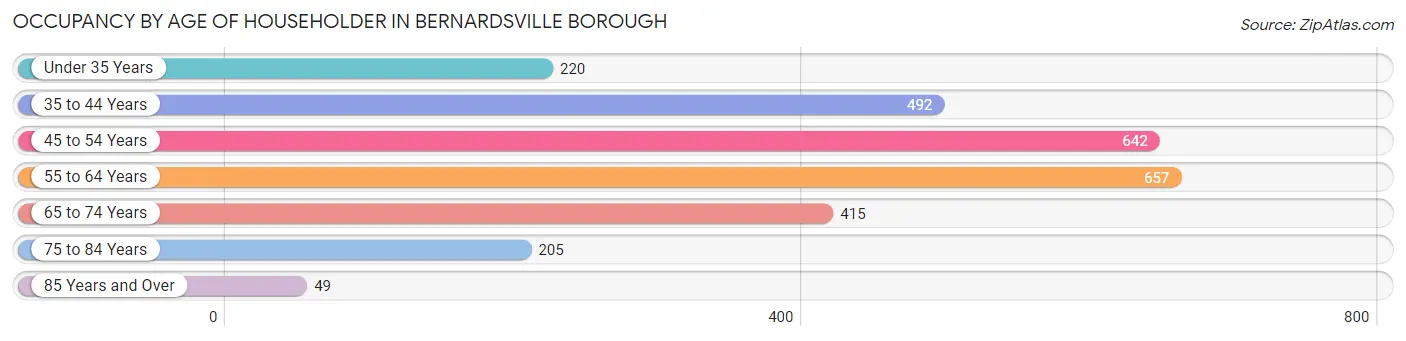
| Age Bracket | # Households | % Households |
| Under 35 Years | 220 | 8.2% |
| 35 to 44 Years | 492 | 18.4% |
| 45 to 54 Years | 642 | 24.0% |
| 55 to 64 Years | 657 | 24.5% |
| 65 to 74 Years | 415 | 15.5% |
| 75 to 84 Years | 205 | 7.6% |
| 85 Years and Over | 49 | 1.8% |
| Total | 2,680 | 100.0% |
Housing Finances in Bernardsville borough
Median Income by Occupancy in Bernardsville borough
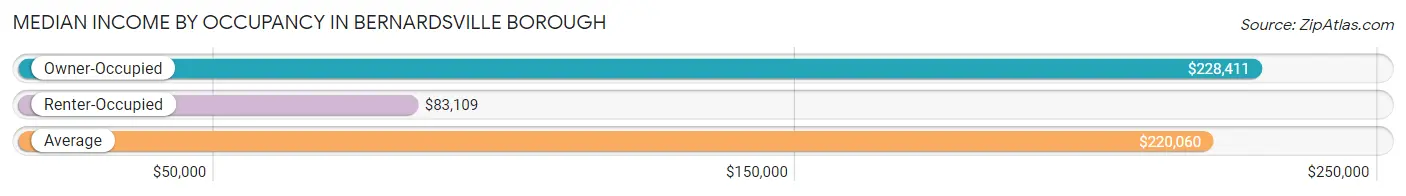
| Occupancy Type | # Households | Median Income |
| Owner-Occupied | 2,383 (88.9%) | $228,411 |
| Renter-Occupied | 297 (11.1%) | $83,109 |
| Average | 2,680 (100.0%) | $220,060 |
Occupancy by Householder Income Bracket in Bernardsville borough
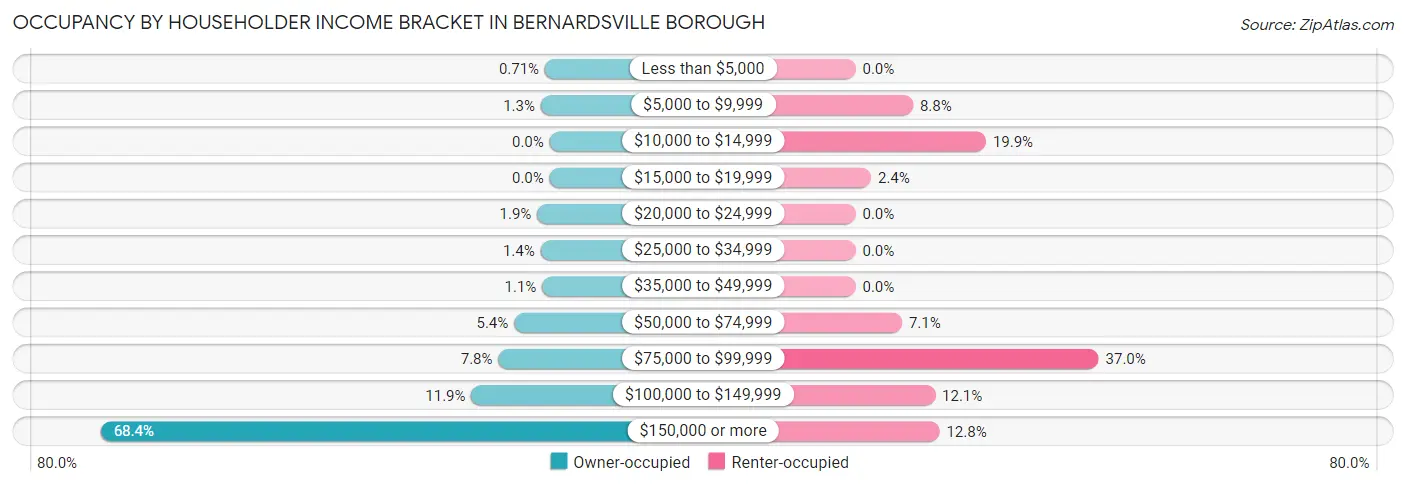
| Income Bracket | Owner-occupied | Renter-occupied |
| Less than $5,000 | 17 (0.7%) | 0 (0.0%) |
| $5,000 to $9,999 | 32 (1.3%) | 26 (8.7%) |
| $10,000 to $14,999 | 0 (0.0%) | 59 (19.9%) |
| $15,000 to $19,999 | 0 (0.0%) | 7 (2.4%) |
| $20,000 to $24,999 | 45 (1.9%) | 0 (0.0%) |
| $25,000 to $34,999 | 33 (1.4%) | 0 (0.0%) |
| $35,000 to $49,999 | 27 (1.1%) | 0 (0.0%) |
| $50,000 to $74,999 | 129 (5.4%) | 21 (7.1%) |
| $75,000 to $99,999 | 186 (7.8%) | 110 (37.0%) |
| $100,000 to $149,999 | 284 (11.9%) | 36 (12.1%) |
| $150,000 or more | 1,630 (68.4%) | 38 (12.8%) |
| Total | 2,383 (100.0%) | 297 (100.0%) |
Monthly Housing Cost Tiers in Bernardsville borough
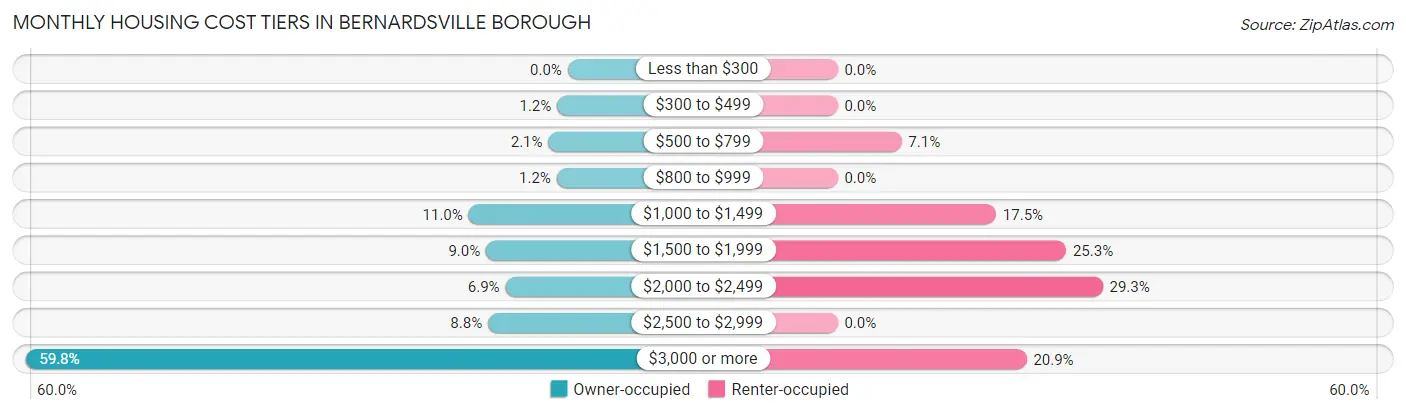
| Monthly Cost | Owner-occupied | Renter-occupied |
| Less than $300 | 0 (0.0%) | 0 (0.0%) |
| $300 to $499 | 28 (1.2%) | 0 (0.0%) |
| $500 to $799 | 51 (2.1%) | 21 (7.1%) |
| $800 to $999 | 29 (1.2%) | 0 (0.0%) |
| $1,000 to $1,499 | 261 (11.0%) | 52 (17.5%) |
| $1,500 to $1,999 | 215 (9.0%) | 75 (25.3%) |
| $2,000 to $2,499 | 164 (6.9%) | 87 (29.3%) |
| $2,500 to $2,999 | 210 (8.8%) | 0 (0.0%) |
| $3,000 or more | 1,425 (59.8%) | 62 (20.9%) |
| Total | 2,383 (100.0%) | 297 (100.0%) |
Physical Housing Characteristics in Bernardsville borough
Housing Structures in Bernardsville borough
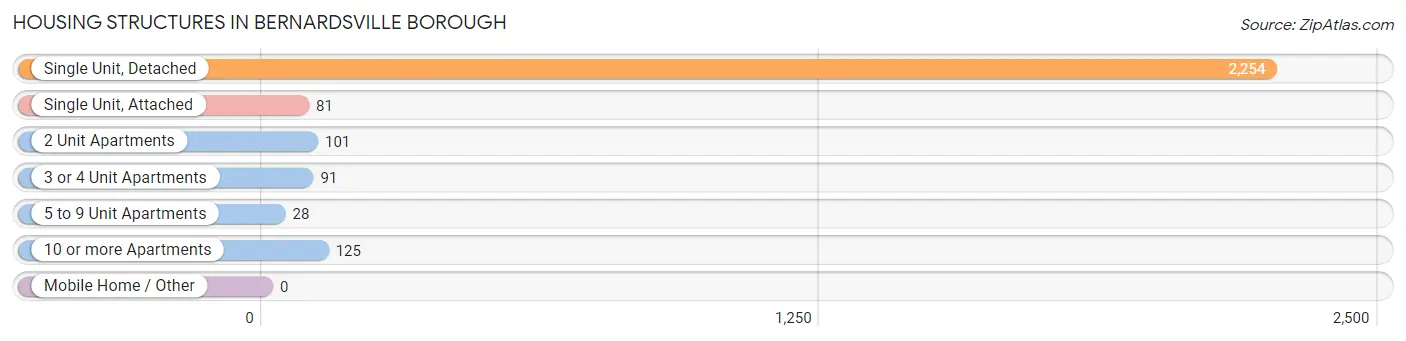
| Structure Type | # Housing Units | % Housing Units |
| Single Unit, Detached | 2,254 | 84.1% |
| Single Unit, Attached | 81 | 3.0% |
| 2 Unit Apartments | 101 | 3.8% |
| 3 or 4 Unit Apartments | 91 | 3.4% |
| 5 to 9 Unit Apartments | 28 | 1.0% |
| 10 or more Apartments | 125 | 4.7% |
| Mobile Home / Other | 0 | 0.0% |
| Total | 2,680 | 100.0% |
Housing Structures by Occupancy in Bernardsville borough
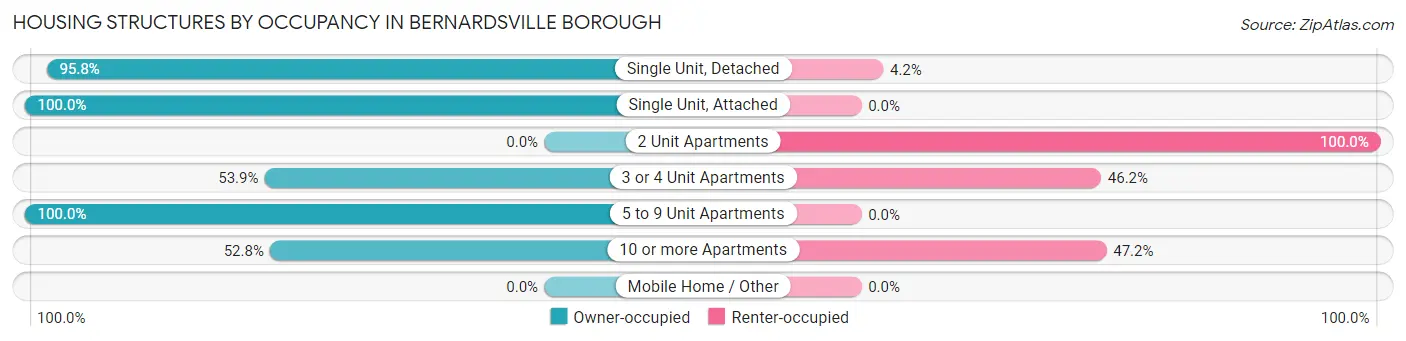
| Structure Type | Owner-occupied | Renter-occupied |
| Single Unit, Detached | 2,159 (95.8%) | 95 (4.2%) |
| Single Unit, Attached | 81 (100.0%) | 0 (0.0%) |
| 2 Unit Apartments | 0 (0.0%) | 101 (100.0%) |
| 3 or 4 Unit Apartments | 49 (53.8%) | 42 (46.2%) |
| 5 to 9 Unit Apartments | 28 (100.0%) | 0 (0.0%) |
| 10 or more Apartments | 66 (52.8%) | 59 (47.2%) |
| Mobile Home / Other | 0 (0.0%) | 0 (0.0%) |
| Total | 2,383 (88.9%) | 297 (11.1%) |
Housing Structures by Number of Rooms in Bernardsville borough
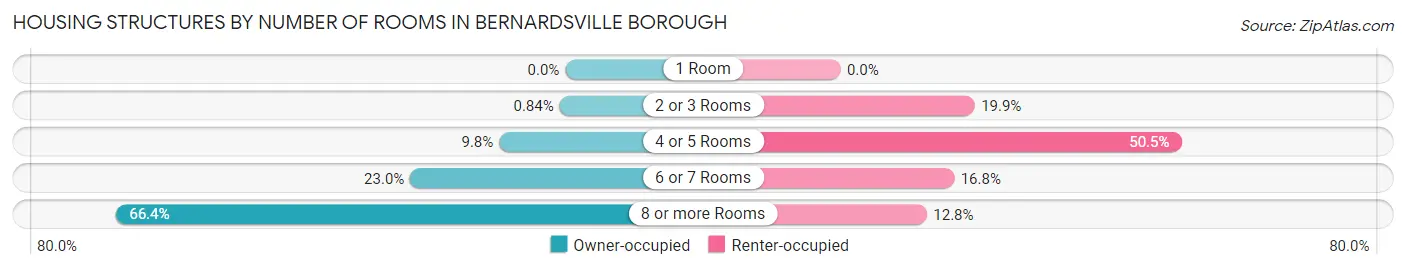
| Number of Rooms | Owner-occupied | Renter-occupied |
| 1 Room | 0 (0.0%) | 0 (0.0%) |
| 2 or 3 Rooms | 20 (0.8%) | 59 (19.9%) |
| 4 or 5 Rooms | 233 (9.8%) | 150 (50.5%) |
| 6 or 7 Rooms | 547 (23.0%) | 50 (16.8%) |
| 8 or more Rooms | 1,583 (66.4%) | 38 (12.8%) |
| Total | 2,383 (100.0%) | 297 (100.0%) |
Housing Structure by Heating Type in Bernardsville borough
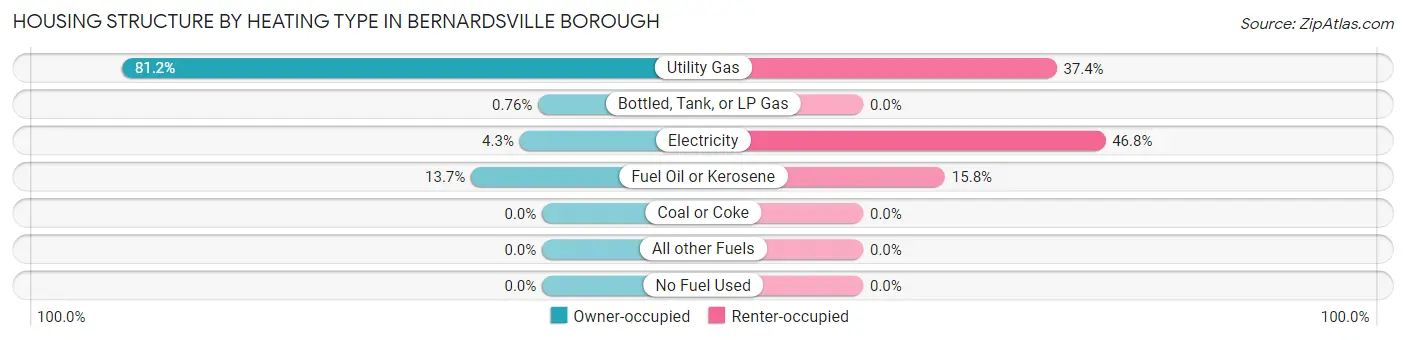
| Heating Type | Owner-occupied | Renter-occupied |
| Utility Gas | 1,935 (81.2%) | 111 (37.4%) |
| Bottled, Tank, or LP Gas | 18 (0.8%) | 0 (0.0%) |
| Electricity | 103 (4.3%) | 139 (46.8%) |
| Fuel Oil or Kerosene | 327 (13.7%) | 47 (15.8%) |
| Coal or Coke | 0 (0.0%) | 0 (0.0%) |
| All other Fuels | 0 (0.0%) | 0 (0.0%) |
| No Fuel Used | 0 (0.0%) | 0 (0.0%) |
| Total | 2,383 (100.0%) | 297 (100.0%) |
Household Vehicle Usage in Bernardsville borough
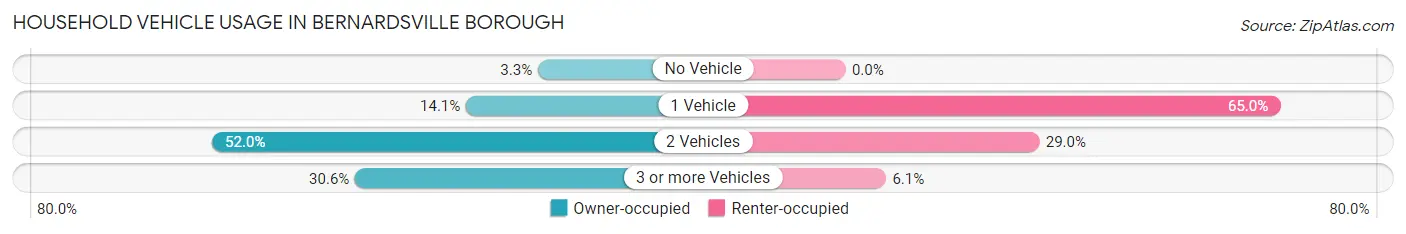
| Vehicles per Household | Owner-occupied | Renter-occupied |
| No Vehicle | 79 (3.3%) | 0 (0.0%) |
| 1 Vehicle | 335 (14.1%) | 193 (65.0%) |
| 2 Vehicles | 1,239 (52.0%) | 86 (29.0%) |
| 3 or more Vehicles | 730 (30.6%) | 18 (6.1%) |
| Total | 2,383 (100.0%) | 297 (100.0%) |
Real Estate & Mortgages in Bernardsville borough
Real Estate and Mortgage Overview in Bernardsville borough
| Characteristic | Without Mortgage | With Mortgage |
| Housing Units | 769 | 1,614 |
| Median Property Value | $663,100 | $753,900 |
| Median Household Income | $220,236 | $1,186 |
| Monthly Housing Costs | $1,501 | $1,217 |
| Real Estate Taxes | $10,001 | $45 |
Property Value by Mortgage Status in Bernardsville borough
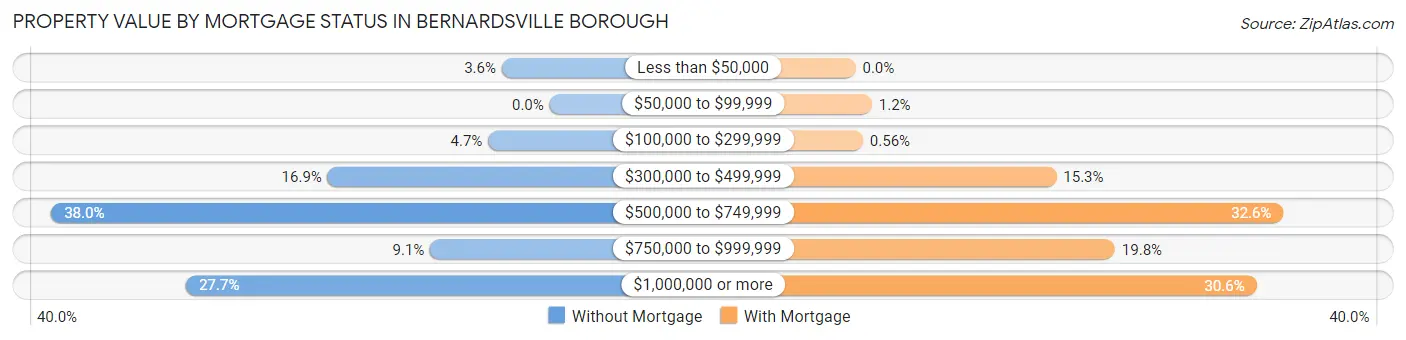
| Property Value | Without Mortgage | With Mortgage |
| Less than $50,000 | 28 (3.6%) | 0 (0.0%) |
| $50,000 to $99,999 | 0 (0.0%) | 20 (1.2%) |
| $100,000 to $299,999 | 36 (4.7%) | 9 (0.6%) |
| $300,000 to $499,999 | 130 (16.9%) | 247 (15.3%) |
| $500,000 to $749,999 | 292 (38.0%) | 526 (32.6%) |
| $750,000 to $999,999 | 70 (9.1%) | 319 (19.8%) |
| $1,000,000 or more | 213 (27.7%) | 493 (30.5%) |
| Total | 769 (100.0%) | 1,614 (100.0%) |
Household Income by Mortgage Status in Bernardsville borough
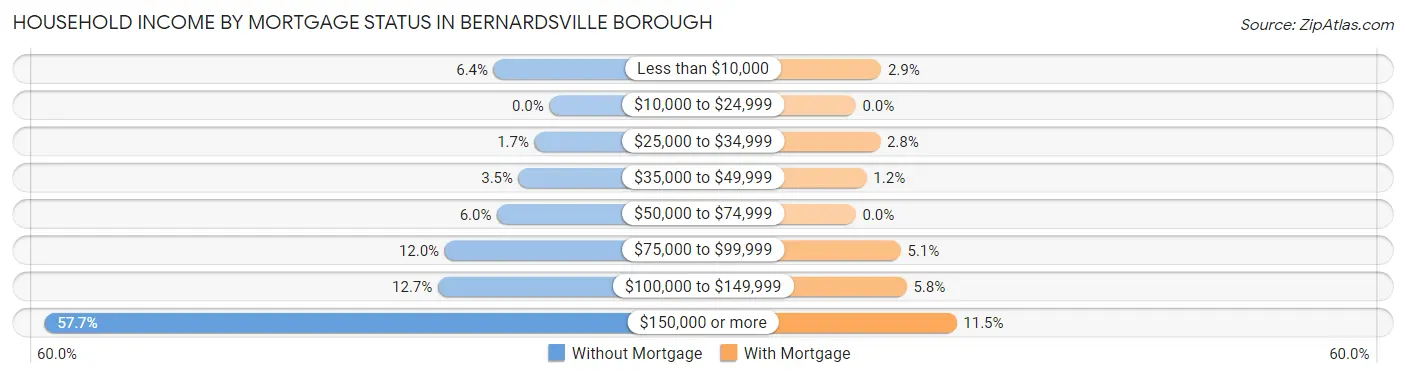
| Household Income | Without Mortgage | With Mortgage |
| Less than $10,000 | 49 (6.4%) | 47 (2.9%) |
| $10,000 to $24,999 | 0 (0.0%) | 0 (0.0%) |
| $25,000 to $34,999 | 13 (1.7%) | 45 (2.8%) |
| $35,000 to $49,999 | 27 (3.5%) | 20 (1.2%) |
| $50,000 to $74,999 | 46 (6.0%) | 0 (0.0%) |
| $75,000 to $99,999 | 92 (12.0%) | 83 (5.1%) |
| $100,000 to $149,999 | 98 (12.7%) | 94 (5.8%) |
| $150,000 or more | 444 (57.7%) | 186 (11.5%) |
| Total | 769 (100.0%) | 1,614 (100.0%) |
Property Value to Household Income Ratio in Bernardsville borough
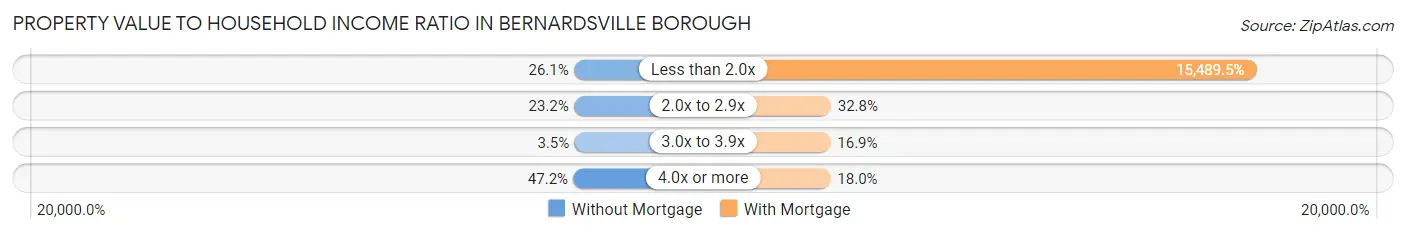
| Value-to-Income Ratio | Without Mortgage | With Mortgage |
| Less than 2.0x | 201 (26.1%) | 250,001 (15,489.5%) |
| 2.0x to 2.9x | 178 (23.2%) | 529 (32.8%) |
| 3.0x to 3.9x | 27 (3.5%) | 272 (16.9%) |
| 4.0x or more | 363 (47.2%) | 291 (18.0%) |
| Total | 769 (100.0%) | 1,614 (100.0%) |
Real Estate Taxes by Mortgage Status in Bernardsville borough
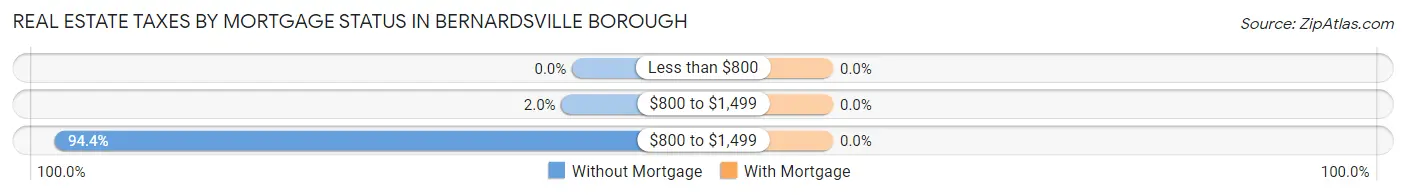
| Property Taxes | Without Mortgage | With Mortgage |
| Less than $800 | 0 (0.0%) | 0 (0.0%) |
| $800 to $1,499 | 15 (1.9%) | 0 (0.0%) |
| $800 to $1,499 | 726 (94.4%) | 0 (0.0%) |
| Total | 769 (100.0%) | 1,614 (100.0%) |
Health & Disability in Bernardsville borough
Health Insurance Coverage by Age in Bernardsville borough
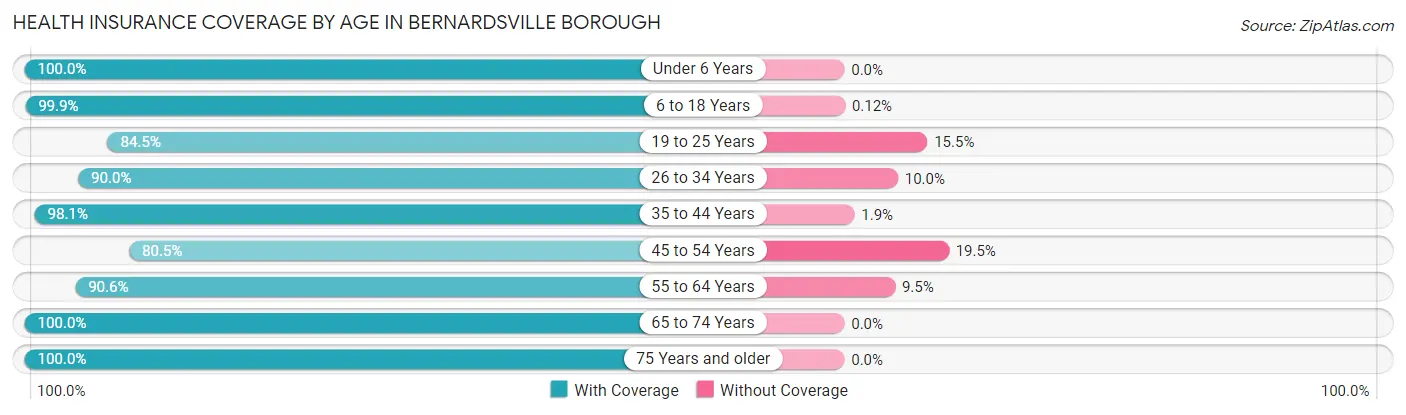
| Age Bracket | With Coverage | Without Coverage |
| Under 6 Years | 595 (100.0%) | 0 (0.0%) |
| 6 to 18 Years | 1,698 (99.9%) | 2 (0.1%) |
| 19 to 25 Years | 235 (84.5%) | 43 (15.5%) |
| 26 to 34 Years | 632 (90.0%) | 70 (10.0%) |
| 35 to 44 Years | 943 (98.1%) | 18 (1.9%) |
| 45 to 54 Years | 1,034 (80.5%) | 250 (19.5%) |
| 55 to 64 Years | 929 (90.5%) | 97 (9.5%) |
| 65 to 74 Years | 813 (100.0%) | 0 (0.0%) |
| 75 Years and older | 529 (100.0%) | 0 (0.0%) |
| Total | 7,408 (93.9%) | 480 (6.1%) |
Health Insurance Coverage by Citizenship Status in Bernardsville borough
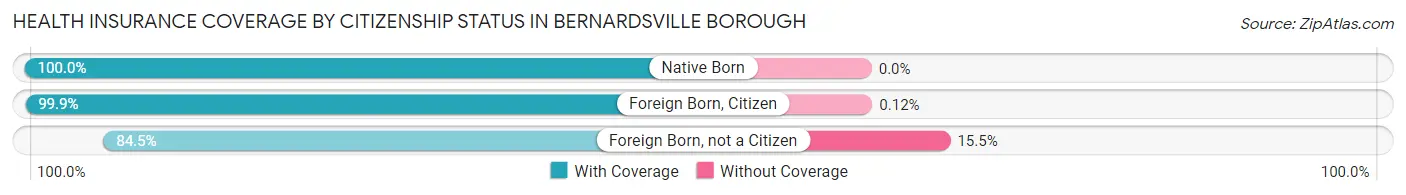
| Citizenship Status | With Coverage | Without Coverage |
| Native Born | 595 (100.0%) | 0 (0.0%) |
| Foreign Born, Citizen | 1,698 (99.9%) | 2 (0.1%) |
| Foreign Born, not a Citizen | 235 (84.5%) | 43 (15.5%) |
Health Insurance Coverage by Household Income in Bernardsville borough
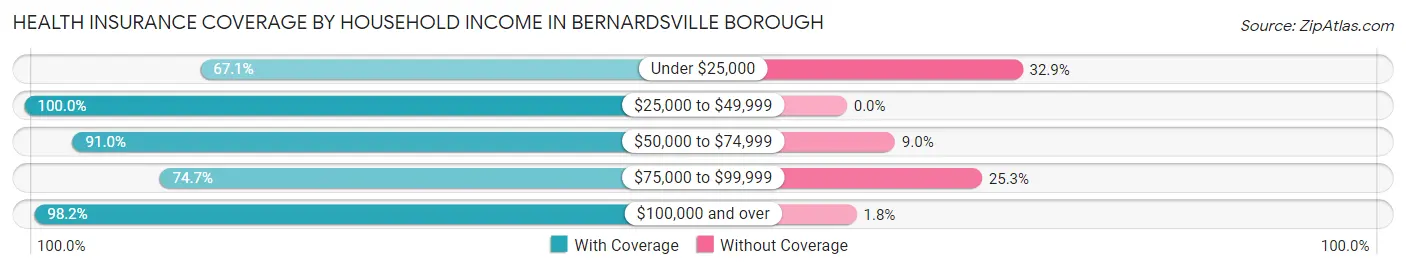
| Household Income | With Coverage | Without Coverage |
| Under $25,000 | 222 (67.1%) | 109 (32.9%) |
| $25,000 to $49,999 | 88 (100.0%) | 0 (0.0%) |
| $50,000 to $74,999 | 293 (91.0%) | 29 (9.0%) |
| $75,000 to $99,999 | 664 (74.7%) | 225 (25.3%) |
| $100,000 and over | 6,135 (98.2%) | 115 (1.8%) |
Public vs Private Health Insurance Coverage by Age in Bernardsville borough
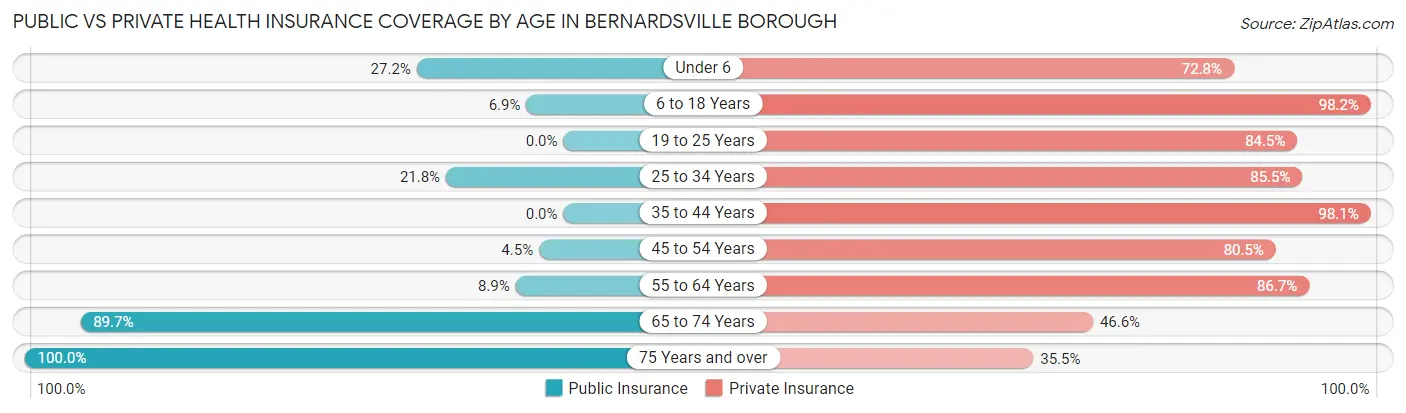
| Age Bracket | Public Insurance | Private Insurance |
| Under 6 | 162 (27.2%) | 433 (72.8%) |
| 6 to 18 Years | 117 (6.9%) | 1,669 (98.2%) |
| 19 to 25 Years | 0 (0.0%) | 235 (84.5%) |
| 25 to 34 Years | 153 (21.8%) | 600 (85.5%) |
| 35 to 44 Years | 0 (0.0%) | 943 (98.1%) |
| 45 to 54 Years | 58 (4.5%) | 1,034 (80.5%) |
| 55 to 64 Years | 91 (8.9%) | 890 (86.7%) |
| 65 to 74 Years | 729 (89.7%) | 379 (46.6%) |
| 75 Years and over | 529 (100.0%) | 188 (35.5%) |
| Total | 1,839 (23.3%) | 6,371 (80.8%) |
Disability Status by Sex by Age in Bernardsville borough
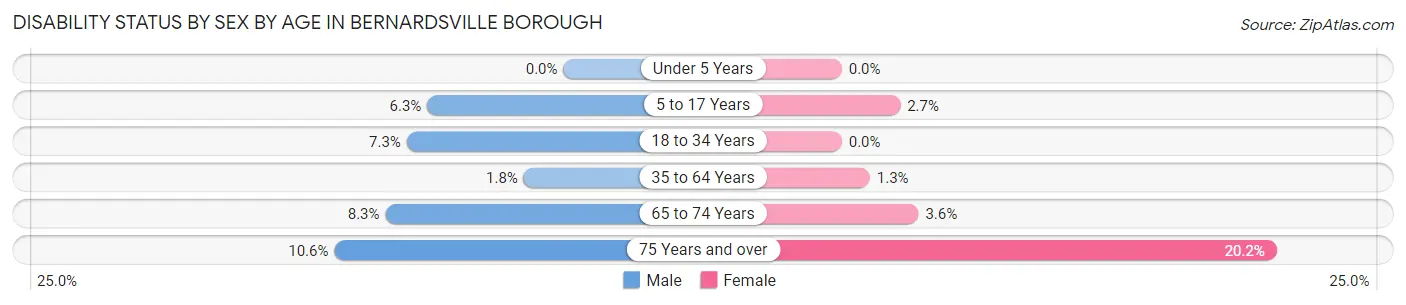
| Age Bracket | Male | Female |
| Under 5 Years | 0 (0.0%) | 0 (0.0%) |
| 5 to 17 Years | 48 (6.3%) | 25 (2.7%) |
| 18 to 34 Years | 45 (7.3%) | 0 (0.0%) |
| 35 to 64 Years | 29 (1.8%) | 22 (1.3%) |
| 65 to 74 Years | 30 (8.3%) | 16 (3.6%) |
| 75 Years and over | 32 (10.6%) | 46 (20.2%) |
Disability Class by Sex by Age in Bernardsville borough
Disability Class: Hearing Difficulty
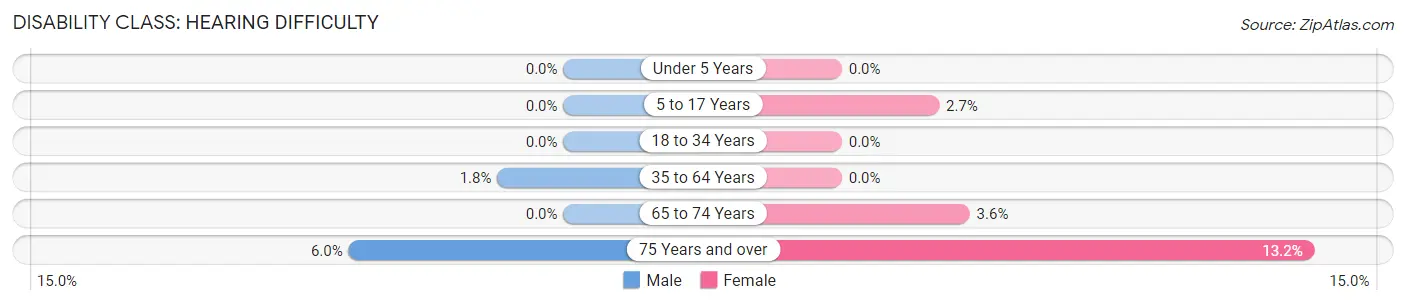
| Age Bracket | Male | Female |
| Under 5 Years | 0 (0.0%) | 0 (0.0%) |
| 5 to 17 Years | 0 (0.0%) | 25 (2.7%) |
| 18 to 34 Years | 0 (0.0%) | 0 (0.0%) |
| 35 to 64 Years | 29 (1.8%) | 0 (0.0%) |
| 65 to 74 Years | 0 (0.0%) | 16 (3.6%) |
| 75 Years and over | 18 (6.0%) | 30 (13.2%) |
Disability Class: Vision Difficulty
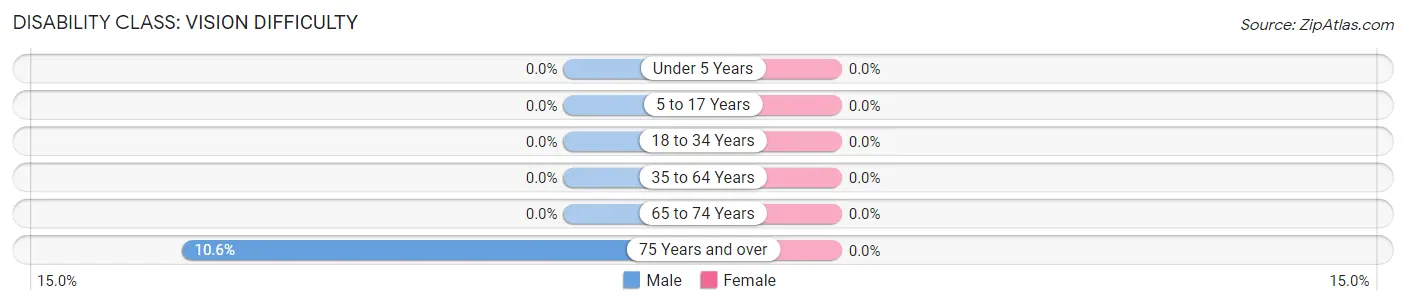
| Age Bracket | Male | Female |
| Under 5 Years | 0 (0.0%) | 0 (0.0%) |
| 5 to 17 Years | 0 (0.0%) | 0 (0.0%) |
| 18 to 34 Years | 0 (0.0%) | 0 (0.0%) |
| 35 to 64 Years | 0 (0.0%) | 0 (0.0%) |
| 65 to 74 Years | 0 (0.0%) | 0 (0.0%) |
| 75 Years and over | 32 (10.6%) | 0 (0.0%) |
Disability Class: Cognitive Difficulty
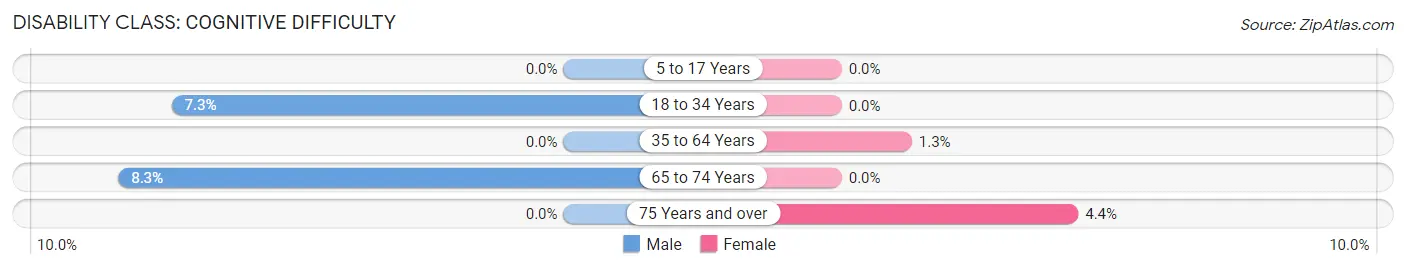
| Age Bracket | Male | Female |
| 5 to 17 Years | 0 (0.0%) | 0 (0.0%) |
| 18 to 34 Years | 45 (7.3%) | 0 (0.0%) |
| 35 to 64 Years | 0 (0.0%) | 22 (1.3%) |
| 65 to 74 Years | 30 (8.3%) | 0 (0.0%) |
| 75 Years and over | 0 (0.0%) | 10 (4.4%) |
Disability Class: Ambulatory Difficulty
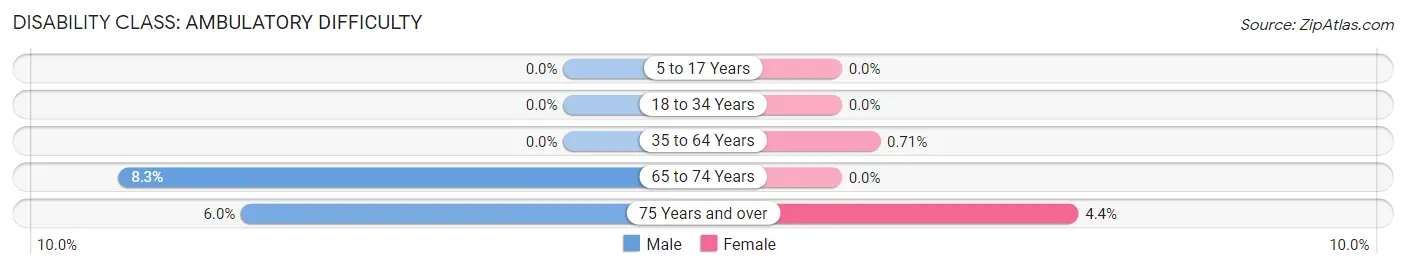
| Age Bracket | Male | Female |
| 5 to 17 Years | 0 (0.0%) | 0 (0.0%) |
| 18 to 34 Years | 0 (0.0%) | 0 (0.0%) |
| 35 to 64 Years | 0 (0.0%) | 12 (0.7%) |
| 65 to 74 Years | 30 (8.3%) | 0 (0.0%) |
| 75 Years and over | 18 (6.0%) | 10 (4.4%) |
Disability Class: Self-Care Difficulty
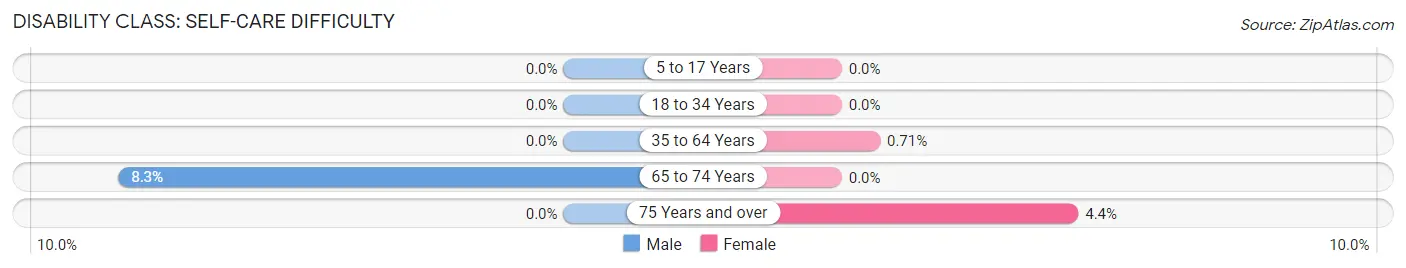
| Age Bracket | Male | Female |
| 5 to 17 Years | 0 (0.0%) | 0 (0.0%) |
| 18 to 34 Years | 0 (0.0%) | 0 (0.0%) |
| 35 to 64 Years | 0 (0.0%) | 12 (0.7%) |
| 65 to 74 Years | 30 (8.3%) | 0 (0.0%) |
| 75 Years and over | 0 (0.0%) | 10 (4.4%) |
Technology Access in Bernardsville borough
Computing Device Access in Bernardsville borough
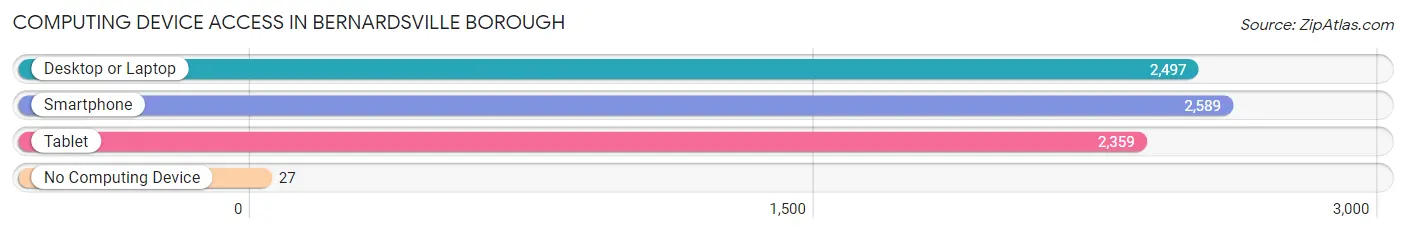
| Device Type | # Households | % Households |
| Desktop or Laptop | 2,497 | 93.2% |
| Smartphone | 2,589 | 96.6% |
| Tablet | 2,359 | 88.0% |
| No Computing Device | 27 | 1.0% |
| Total | 2,680 | 100.0% |
Internet Access in Bernardsville borough
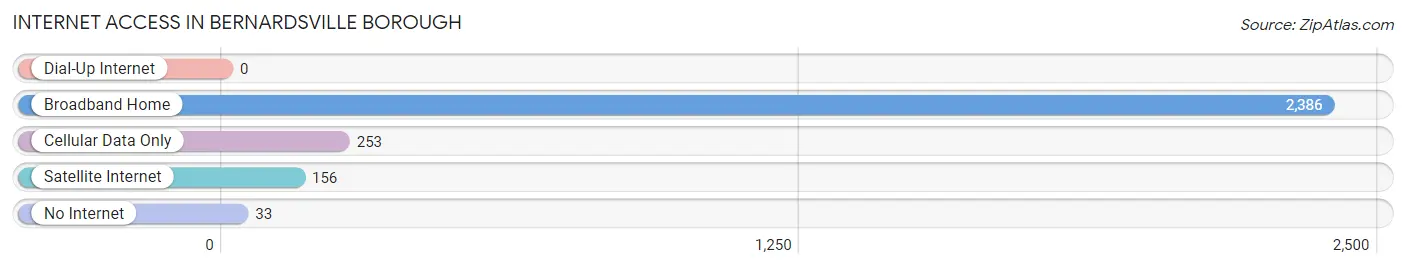
| Internet Type | # Households | % Households |
| Dial-Up Internet | 0 | 0.0% |
| Broadband Home | 2,386 | 89.0% |
| Cellular Data Only | 253 | 9.4% |
| Satellite Internet | 156 | 5.8% |
| No Internet | 33 | 1.2% |
| Total | 2,680 | 100.0% |
Bernardsville borough Summary
Bernardsville Borough is a small borough located in Somerset County, New Jersey. It is situated in the northern part of the state, approximately 25 miles west of New York City. The borough is bordered by Mendham Township to the north, Bernards Township to the east, Far Hills to the south, and Bedminster Township to the west. The population of Bernardsville Borough was 7,707 as of the 2010 census.
History
The area that is now Bernardsville Borough was originally inhabited by the Lenape Native Americans. The first European settlers arrived in the area in the late 17th century. The area was originally part of the larger Bernards Township, which was established in 1760. In 1840, the area was incorporated as the Borough of Bernardsville.
Geography
Bernardsville Borough is located at 40°44'17" North, 74°33'17" West (40.738, -74.554). According to the United States Census Bureau, the borough has a total area of 4.2 square miles, all of which is land.
The borough is located in the northern part of Somerset County, approximately 25 miles west of New York City. It is bordered by Mendham Township to the north, Bernards Township to the east, Far Hills to the south, and Bedminster Township to the west.
Economy
The economy of Bernardsville Borough is largely based on the service industry. The borough is home to a number of restaurants, retail stores, and professional services. The borough is also home to a number of corporate headquarters, including the headquarters of the pharmaceutical company Merck & Co.
Demographics
As of the 2010 census, there were 7,707 people, 2,845 households, and 2,092 families residing in the borough. The population density was 1,837.2 people per square mile. The racial makeup of the borough was 90.2% White, 2.2% African American, 0.2% Native American, 5.3% Asian, 0.1% Pacific Islander, 0.7% from other races, and 1.3% from two or more races. Hispanic or Latino of any race were 4.2% of the population.
The median age in the borough was 45.2 years. 22.2% of residents were under the age of 18; 5.7% were between the ages of 18 and 24; 21.3% were from 25 to 44; 33.2% were from 45 to 64; and 17.6% were 65 years of age or older. The gender makeup of the borough was 48.2% male and 51.8% female.
The median income for a household in the borough was $117,917, and the median income for a family was $142,917. The per capita income for the borough was $63,917. About 1.7% of families and 2.9% of the population were below the poverty line, including 2.2% of those under age 18 and 2.2% of those age 65 or over.
Common Questions
What is Per Capita Income in Bernardsville borough?
Per Capita income in Bernardsville borough is $106,706.
What is the Median Family Income in Bernardsville borough?
Median Family Income in Bernardsville borough is $235,625.
What is the Median Household income in Bernardsville borough?
Median Household Income in Bernardsville borough is $220,060.
What is Income or Wage Gap in Bernardsville borough?
Income or Wage Gap in Bernardsville borough is 33.4%.
Women in Bernardsville borough earn 66.6 cents for every dollar earned by a man.
What is Inequality or Gini Index in Bernardsville borough?
Inequality or Gini Index in Bernardsville borough is 0.50.
What is the Total Population of Bernardsville borough?
Total Population of Bernardsville borough is 7,888.
What is the Total Male Population of Bernardsville borough?
Total Male Population of Bernardsville borough is 4,016.
What is the Total Female Population of Bernardsville borough?
Total Female Population of Bernardsville borough is 3,872.
What is the Ratio of Males per 100 Females in Bernardsville borough?
There are 103.72 Males per 100 Females in Bernardsville borough.
What is the Ratio of Females per 100 Males in Bernardsville borough?
There are 96.41 Females per 100 Males in Bernardsville borough.
What is the Median Population Age in Bernardsville borough?
Median Population Age in Bernardsville borough is 40.5 Years.
What is the Average Family Size in Bernardsville borough
Average Family Size in Bernardsville borough is 3.2 People.
What is the Average Household Size in Bernardsville borough
Average Household Size in Bernardsville borough is 2.9 People.
How Large is the Labor Force in Bernardsville borough?
There are 4,112 People in the Labor Forcein in Bernardsville borough.
What is the Percentage of People in the Labor Force in Bernardsville borough?
67.1% of People are in the Labor Force in Bernardsville borough.
What is the Unemployment Rate in Bernardsville borough?
Unemployment Rate in Bernardsville borough is 5.5%.